-
-
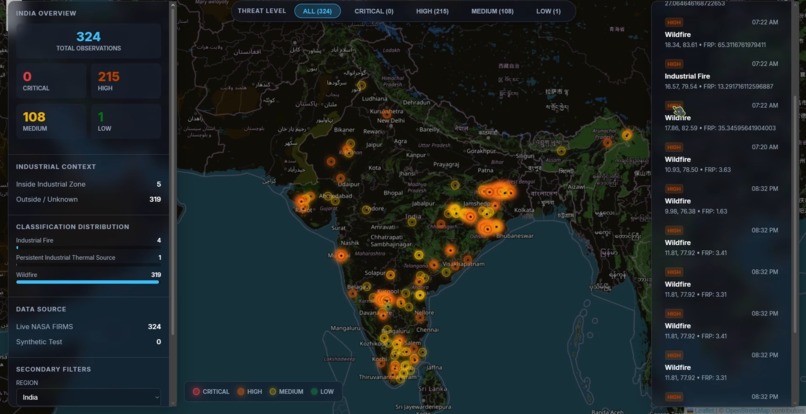
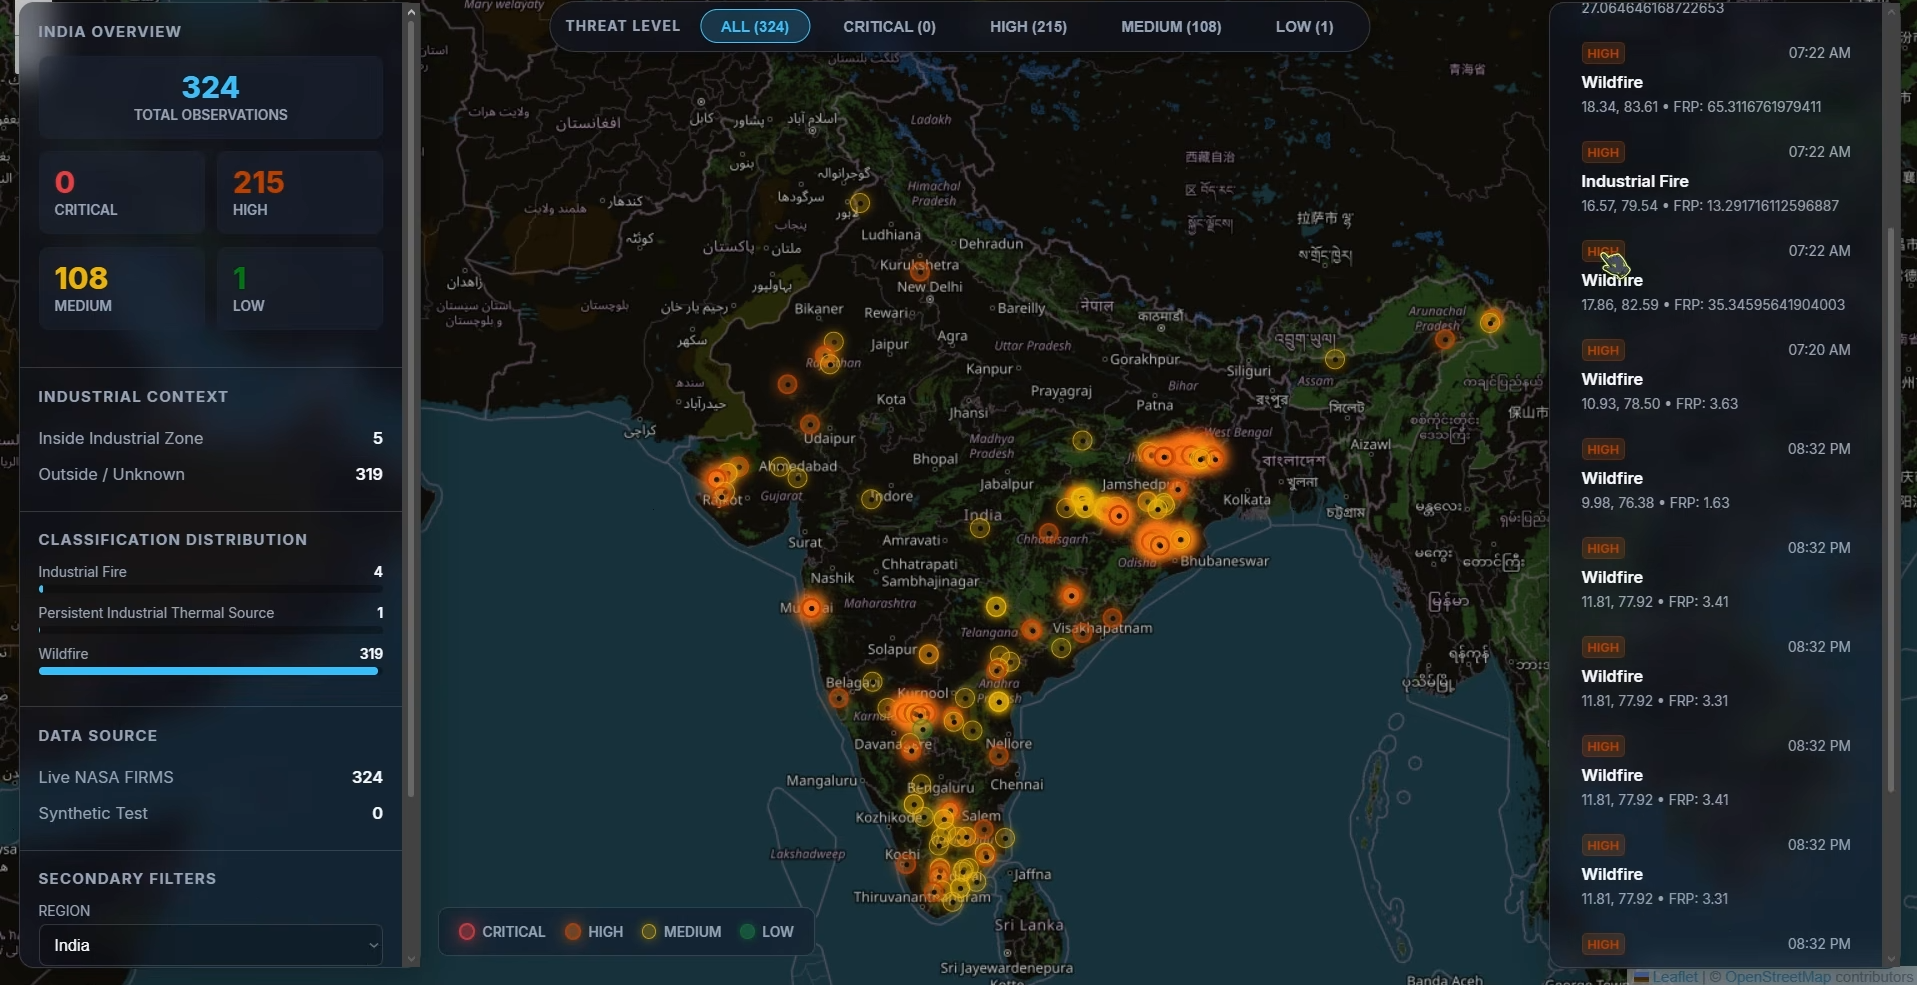
Dashboard
ThermaWatch AI
Industrial Thermal Intelligence & Wildfire Command Center
Project Overview
ThermaWatch AI is an advanced, full-stack geospatial intelligence platform designed to monitor, classify, and assess thermal anomalies (fires, industrial heat sources) in near real-time. By ingesting live satellite telemetry and correlating it with geographic infrastructure data, ThermaWatch distinguishes between standard wildfires, controlled agricultural burns, and critical industrial anomalies (like power plant flare-ups or factory fires).
The ecosystem consists of two primary applications:
- The Web Command Center (
thermawatch-ai): A high-performance, glassmorphic React dashboard for global/regional monitoring and analytics. - The Mobile Field App (
thermawatch-mobile): An offline-capable React Native (Expo) application providing role-based alerts and inspection routing for citizens and forest officers on the ground.
🏗️ System Architecture
1. Data Ingestion & Processing Pipeline
- Satellite Telemetry: Ingests active fire and thermal anomaly data from NASA FIRMS (VIIRS and MODIS sensors), capturing exact coordinates, Fire Radiative Power (FRP), and confidence levels.
- Geospatial Context (PostGIS): Uses a PostgreSQL database supercharged with PostGIS to perform heavy spatial queries. It correlates every thermal reading with OpenStreetMap (OSM) polygons to calculate exact distances to known industrial zones, power plants, and mines.
- Historical Persistence: Analyzes historical databases to determine if a fire is a one-off event (like a wildfire) or a persistent, recurring thermal signature (like a factory furnace).
2. Machine Learning Classification
- Random Forest Spatial Model: A custom Python
scikit-learnmachine learning pipeline evaluates the spatial context, historical persistence, FRP, and satellite confidence of every hotspot. - Categorization: It classifies raw thermal data into distinct categories: Wildfire, Industrial Fire, Persistent Industrial Thermal Source, or Agricultural Burning.
- Intelligence Scoring: Generates an anomaly risk score (0-100) and severity level (LOW, MEDIUM, HIGH, CRITICAL) based on the classification and proximity to human infrastructure.
3. The Web Dashboard
- Tech Stack: React, TypeScript, Leaflet, FastAPI (Python).
- Features:
- A sleek, dark-themed, glassmorphic UI designed for command centers.
- Live map plotting with custom glowing threat markers based on risk level.
- Real-time filtering (Threat Level, Classification) and statistical breakdowns of current global or regional thermal events.
- Detailed inspection panels revealing exact coordinates, ML probabilities, and contextual reasoning for every fire.
4. The Mobile Field App
- Tech Stack: React Native, Expo.
- Features:
- Role-Based Access Control: Users select their role upon opening the app.
- Forest Officer Mode: Routes officers to an "Inspect" dashboard, providing a prioritized list of nearby anomalies sorted by risk level for field verification.
- Common Man Mode: Operates as a localized safety tool, providing GPS-based proximity alerts to safeguard citizens from advancing wildfires or thermal risks.
- Offline-First: Capable of running locally on cached intelligence data when deep in the field without cellular service.
Built With
- css
- dockerfile
- html
- python
- typescript

Log in or sign up for Devpost to join the conversation.