-
-
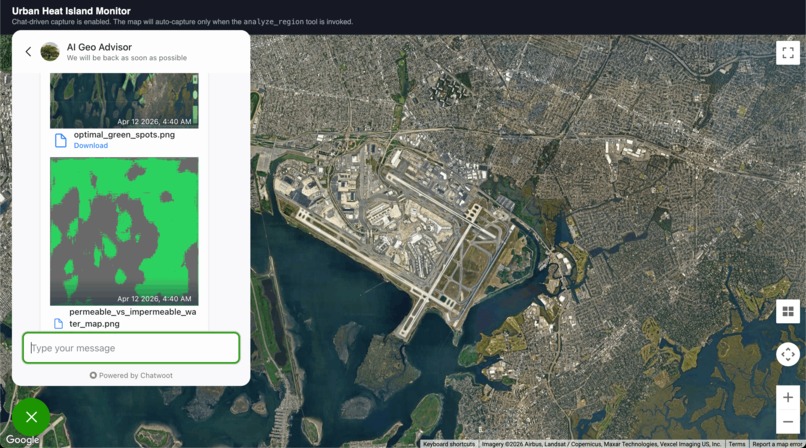
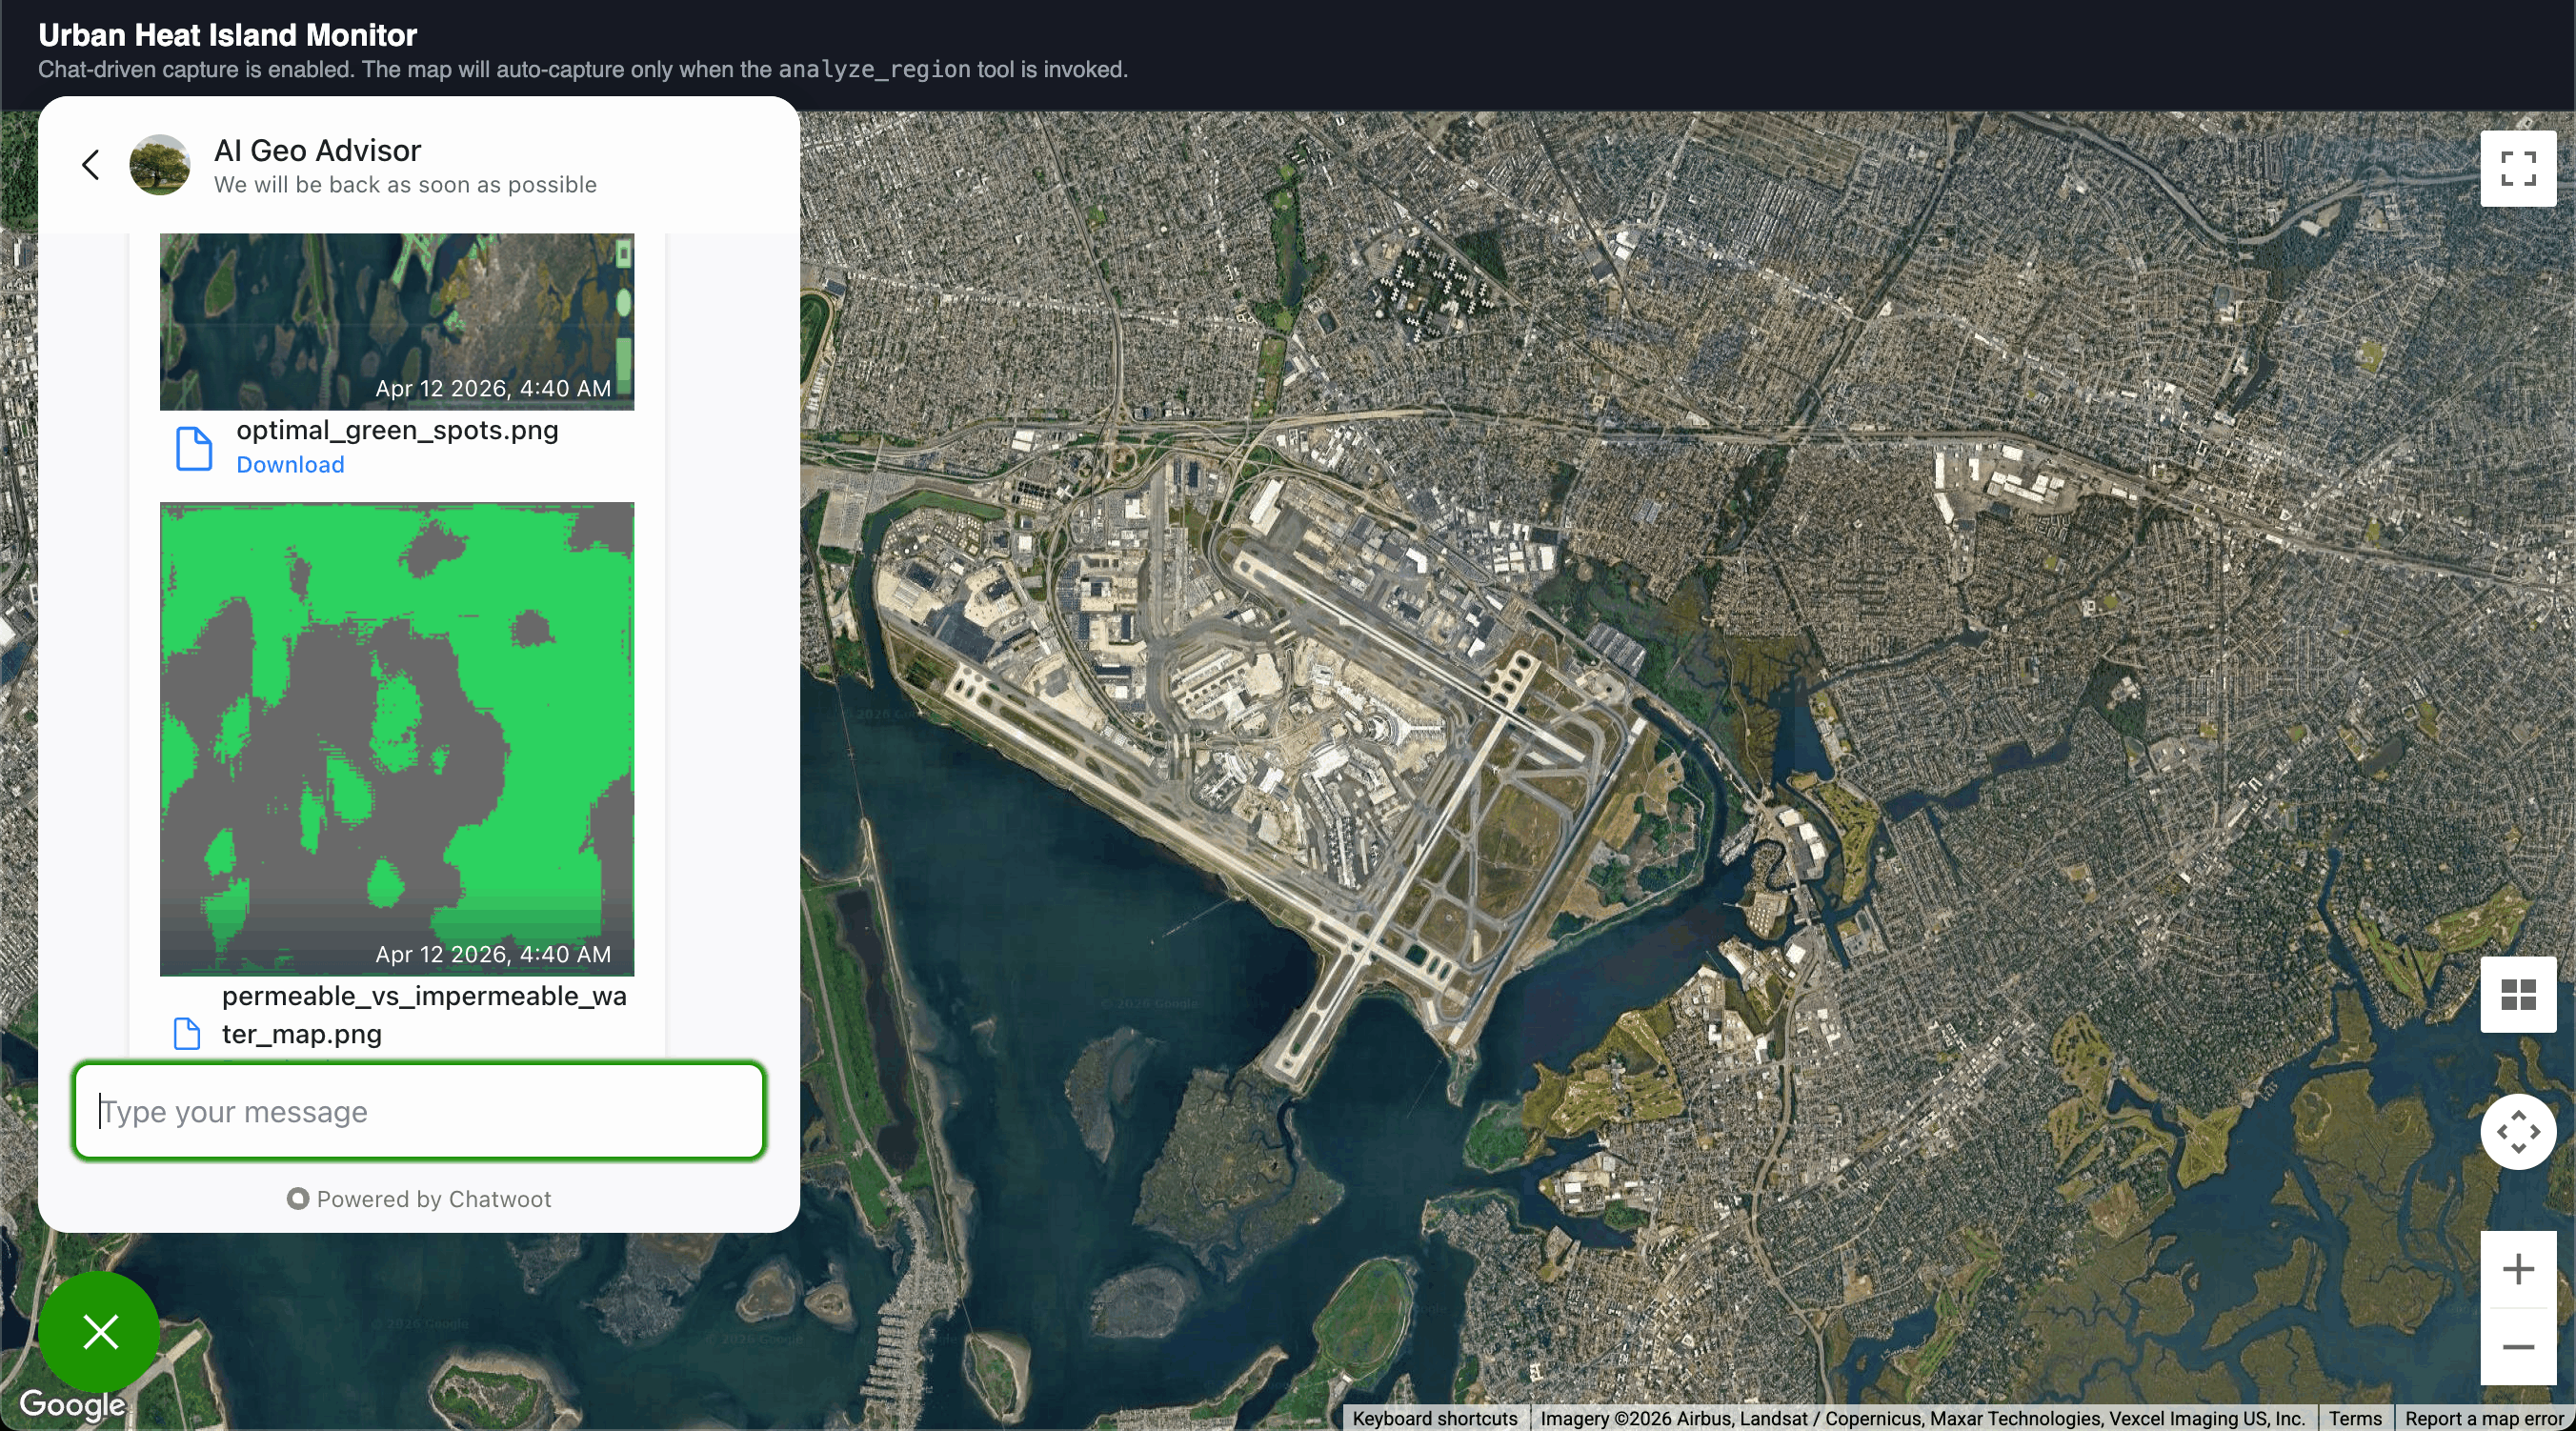
Real-time satellite view with computer vision segmentation identifying permeable vs impermeable surfaces to score urban heat island effect.
Inspiration
One of us grew up in a big city in India surrounded by concrete everywhere and the heat was genuinely unbearable. It wasn't just uncomfortable, it affected the environment and people's daily lives in a real way. That stuck with us and when we saw this problem statement we thought, let's actually try to solve this. Start small, start digitally and expand from there.
What it does
ThermaVision lets urban planners search any region and see a heatmap overlay on live satellite imagery showing exactly where urban heat island hotspots are. It assigns a risk score to each area based on heat intensity and what type of surface it is like concrete, asphalt or vegetation. The idea is planners can look at this and immediately know where to put trees, cool roofs or other greening projects.
How we built it
We used a U-Net model with TensorFlow for image segmentation to classify surface types, OpenCV and NumPy for image processing and the OpenEarth dataset for map data. The map runs on the Google Maps API with OpenStreetMap's Nominatim for geocoding and Flask handles the backend. For the chatbot side we self-hosted Chatwoot on a Digital Ocean Linux server using Docker, built a Gemini-powered AI agent that answers geospatial questions and returns structured JSON for regional analysis and wrote a Java Spring Boot middleware to connect everything together. Conversation history is stored via Docker volumes so it's stateful and we handled all the webhook plumbing between systems ourselves.
Challenges we ran into
The biggest one was resolution. When zoomed out the model just couldn't figure out what it was looking at because there weren't enough pixels to segment properly. We fixed it by tiling, splitting each image into 250x250 tiles so the model could still classify surface types accurately without losing the bigger picture.
Accomplishments that we're proud of
Honestly just that it all works together. A live satellite map, a CV pipeline, a self-hosted AI chatbot and a Spring Boot middleware all containerised and deployed with no gaps. That's a lot of moving parts to get talking to each other correctly and we got it done in a hackathon.
What we learned
A lot. Google Maps API in depth, U-Net and how image segmentation actually works, Flask, Docker properly with multi-container setups, volumes and networking between containers. Also how to build a custom chatbot with Gemini, containerise it and actually host it on a live server. Most of this was new to us going in.
What's next for ThermaVision
We want to add delta scoring. Instead of just showing the heat score for right now we want to track how it changes over time so planners can see if things are getting better or worse. Map it chronologically so you can actually see progress or decline. We also want to pull in real time thermal data from the Google Maps Engine API to make the heatmap more accurate.
Built With
- chatwoot
- docker
- flask
- gemini
- google-maps
- html5
- java
- javascript
- python
- spring
- tensorflow
- u-net


Log in or sign up for Devpost to join the conversation.