Inspiration
Every heat map of a World Cup host city colors a polygon and calls it risk. But nobody stands still in a polygon. A fan gets off the train, walks a half mile of sidewalk with no shade on it, and arrives at the gate already cooked. That walk is the highest heat liability of the tournament and it is the one part of the trip nobody measured.
Air temperature does not describe what happens to a body on that sidewalk. Wet bulb globe temperature does, because it folds in humidity, wind and radiant load, and it is the standard OSHA, the military and athletics governing bodies actually use. FIFA's own threshold for extra heat precautions is WBGT 32. So we asked a question with a number attached: how many minutes did a fan spend above that threshold on the last mile, and where exactly did it happen.
What it does
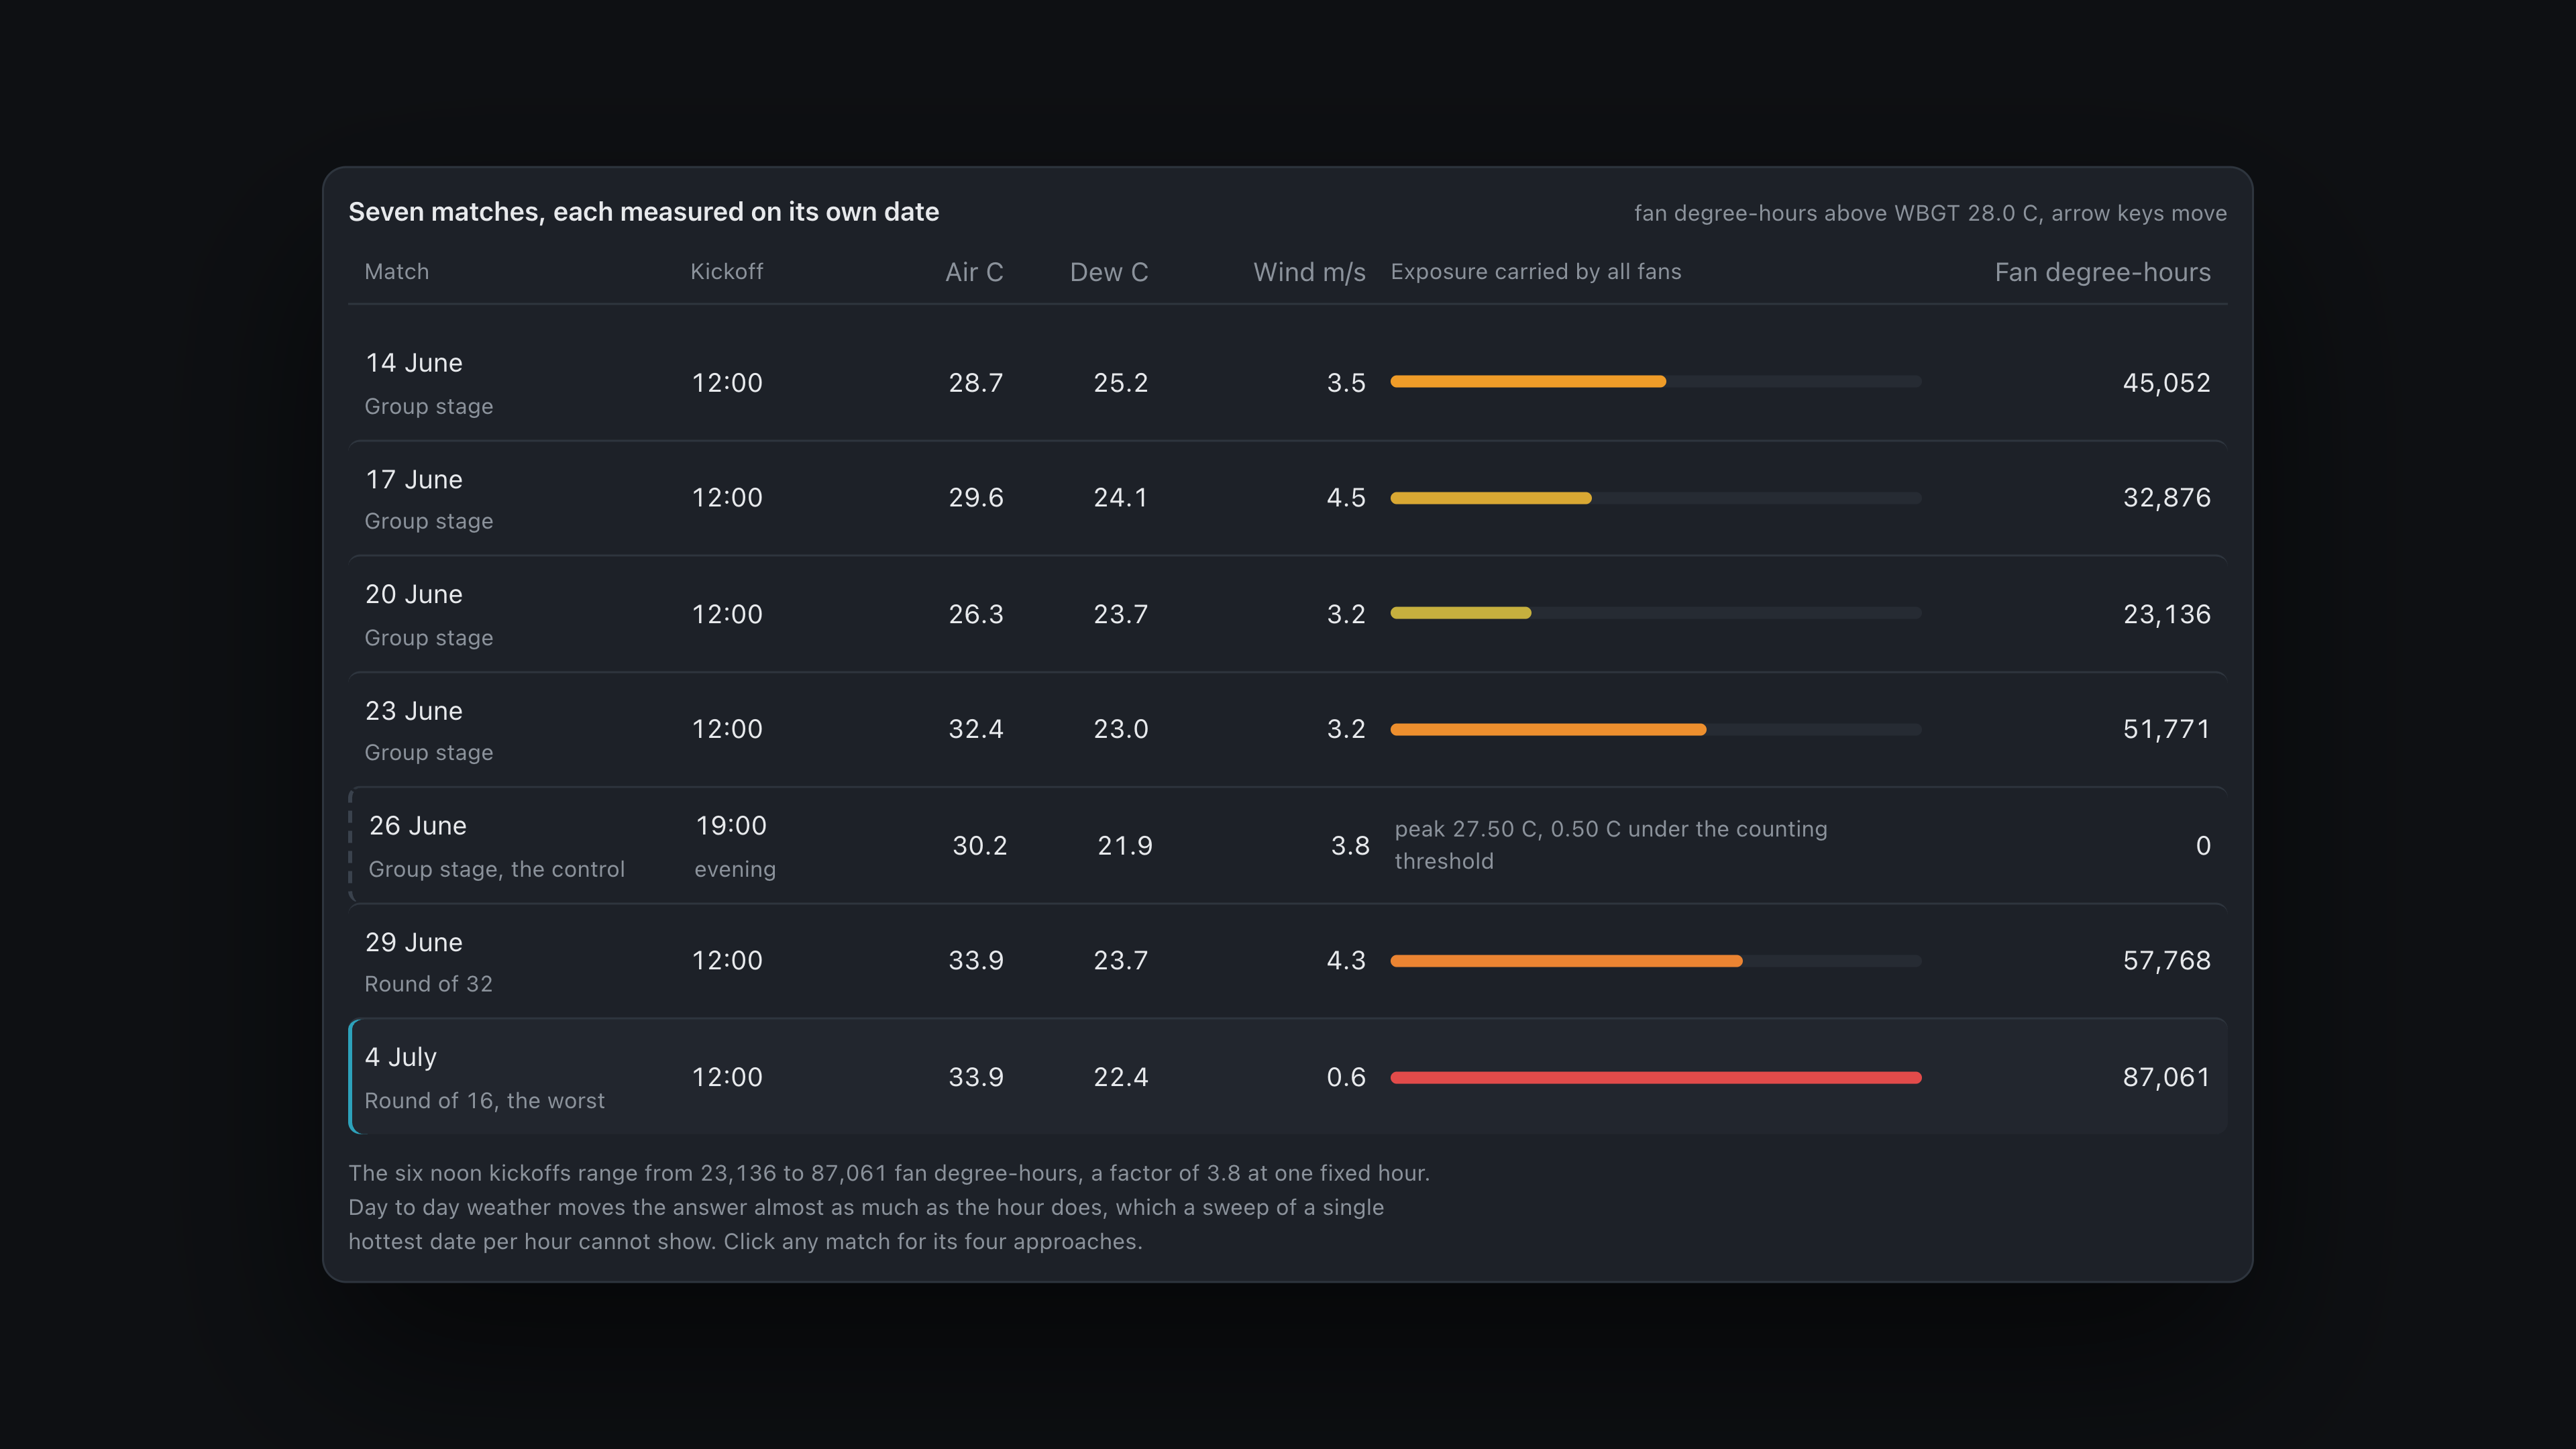
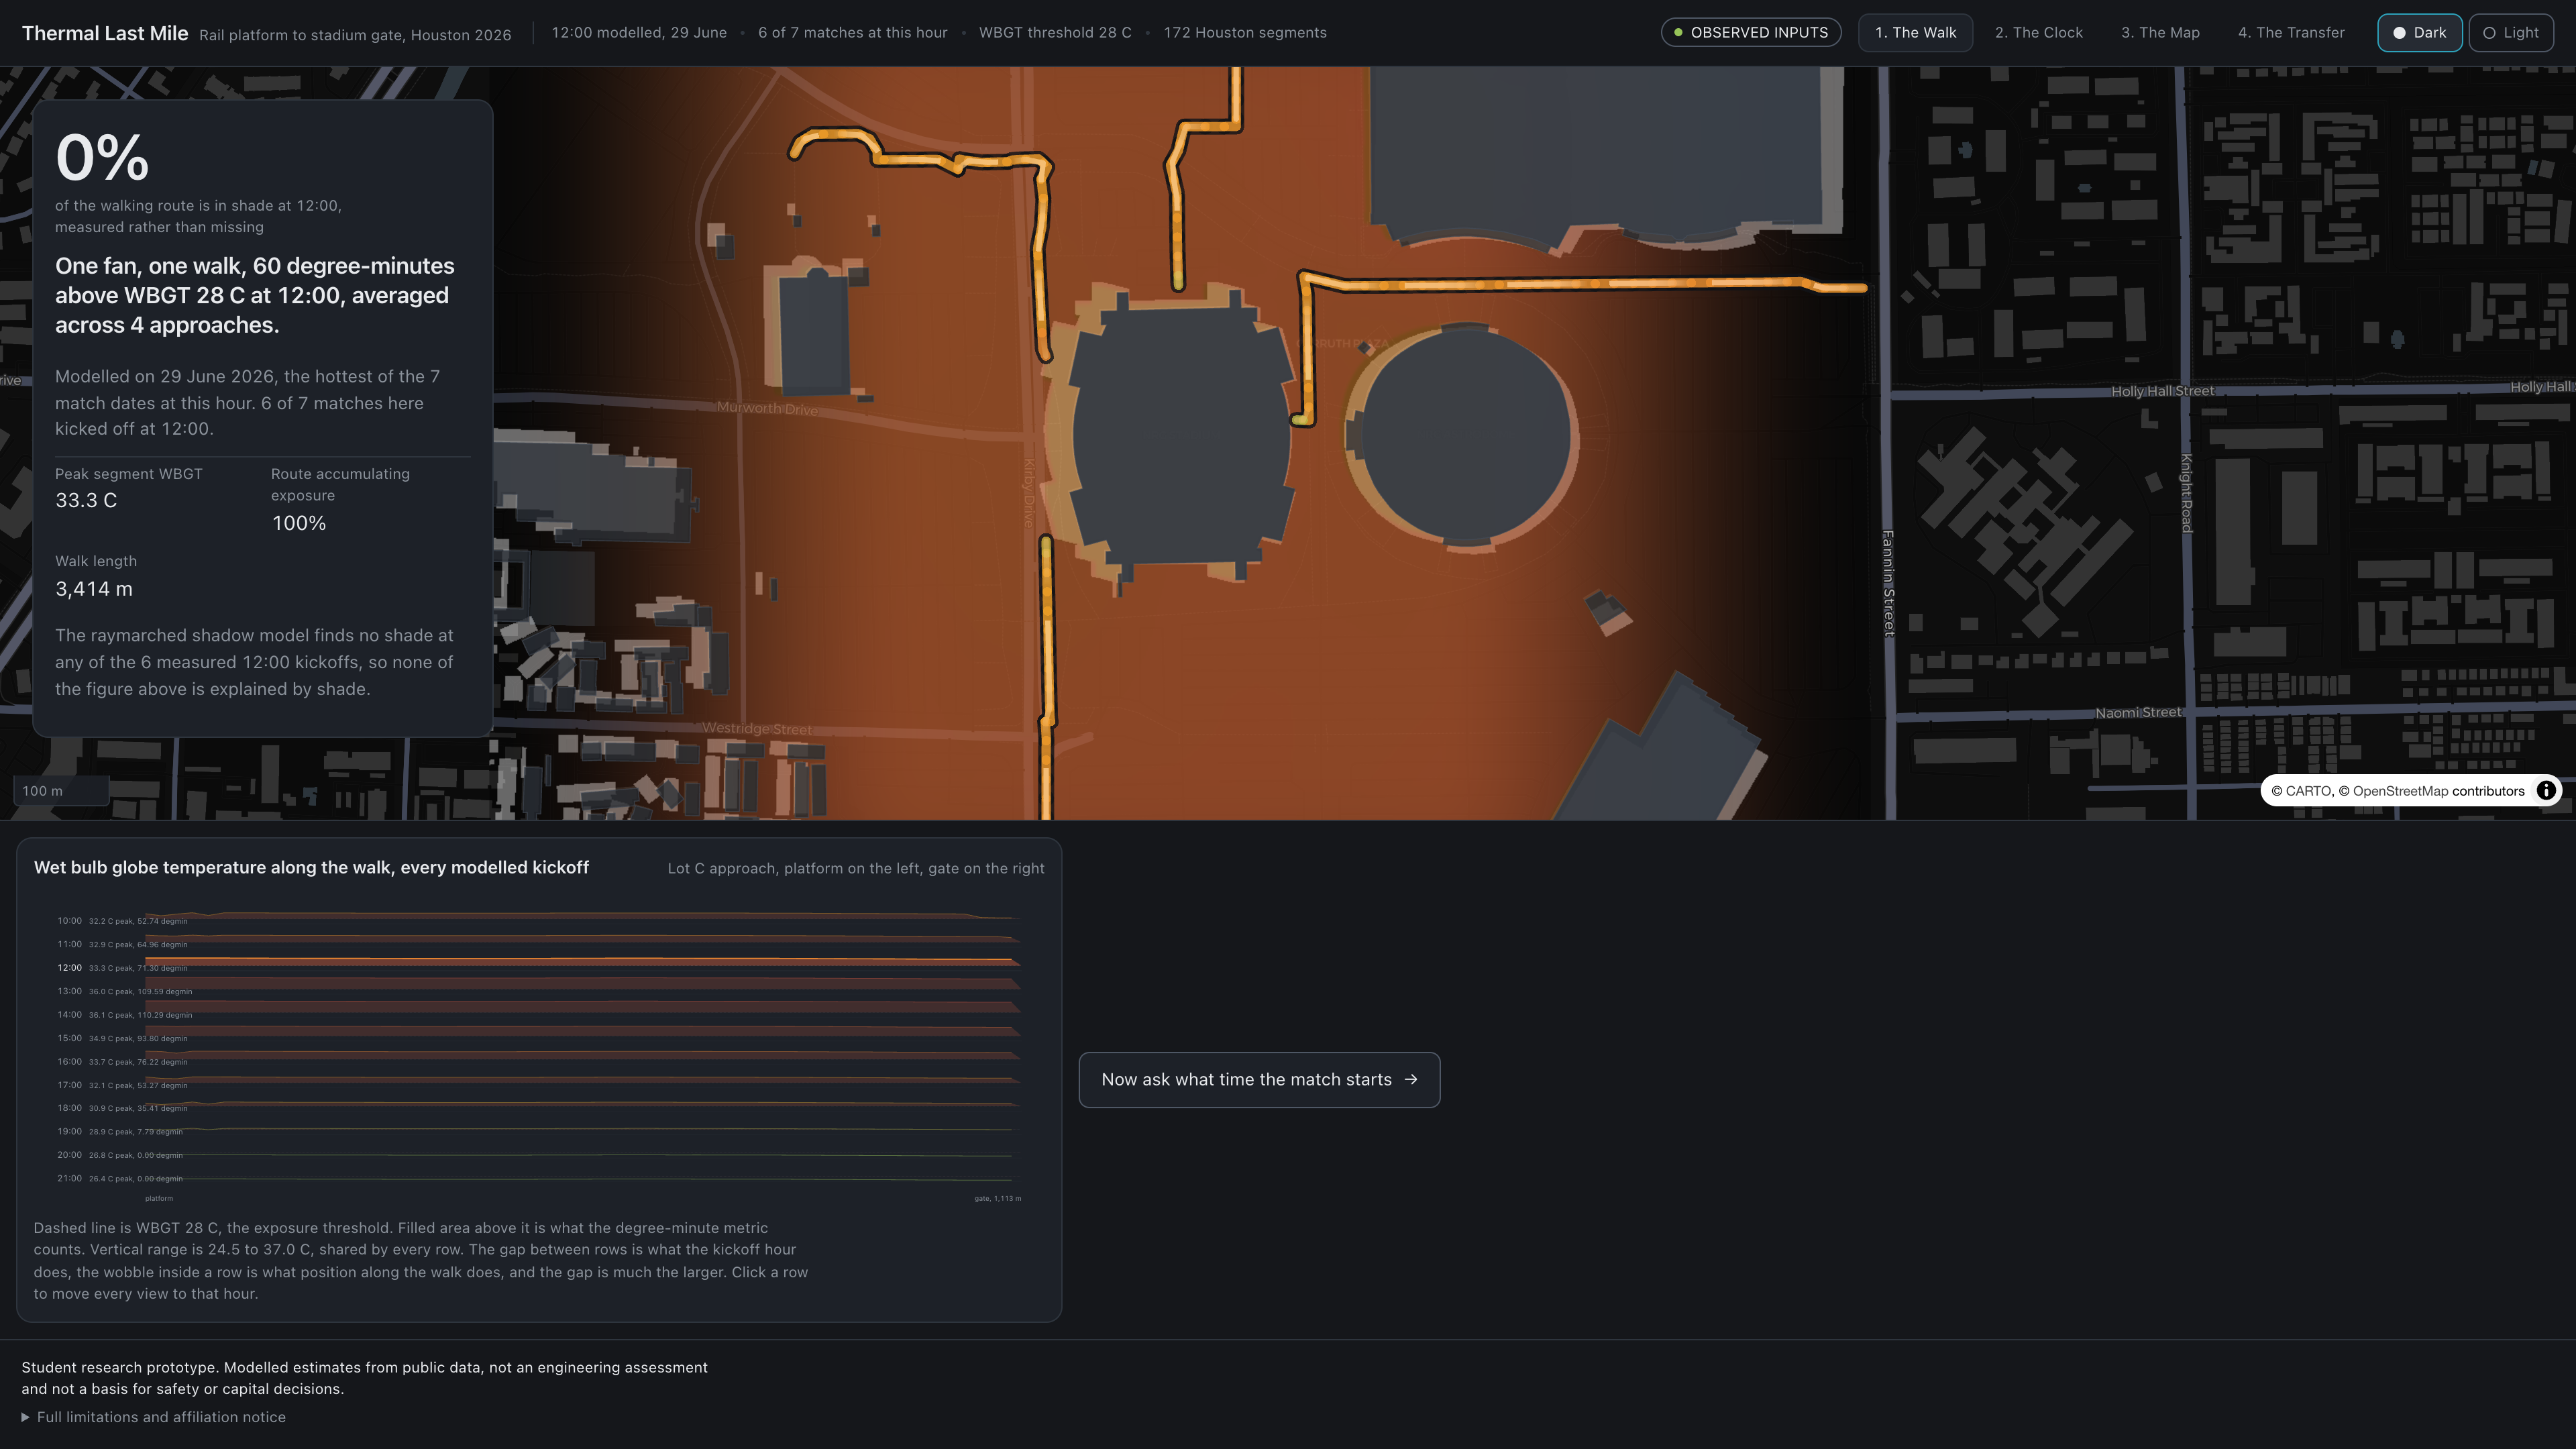
Thermal Last Mile measures heat exposure along the pedestrian route from the METRORail Stadium Park / Astrodome platform to the NRG Stadium gates, segment by segment, at four kickoff hours.
The unit is degree-minutes above WBGT 32 accumulated by one fan walking at 1.3 m/s. Exposure is integrated along the path rather than sampled at a point, which matters: two projects can report the same peak temperature, but only one can say how long a fan spent over the limit and where the shaded relief happened to fall.
Four screens:
- The Walk. One fan journey, platform to gate, with the exposure profile beneath it and the total for the whole walk at each kickoff hour.
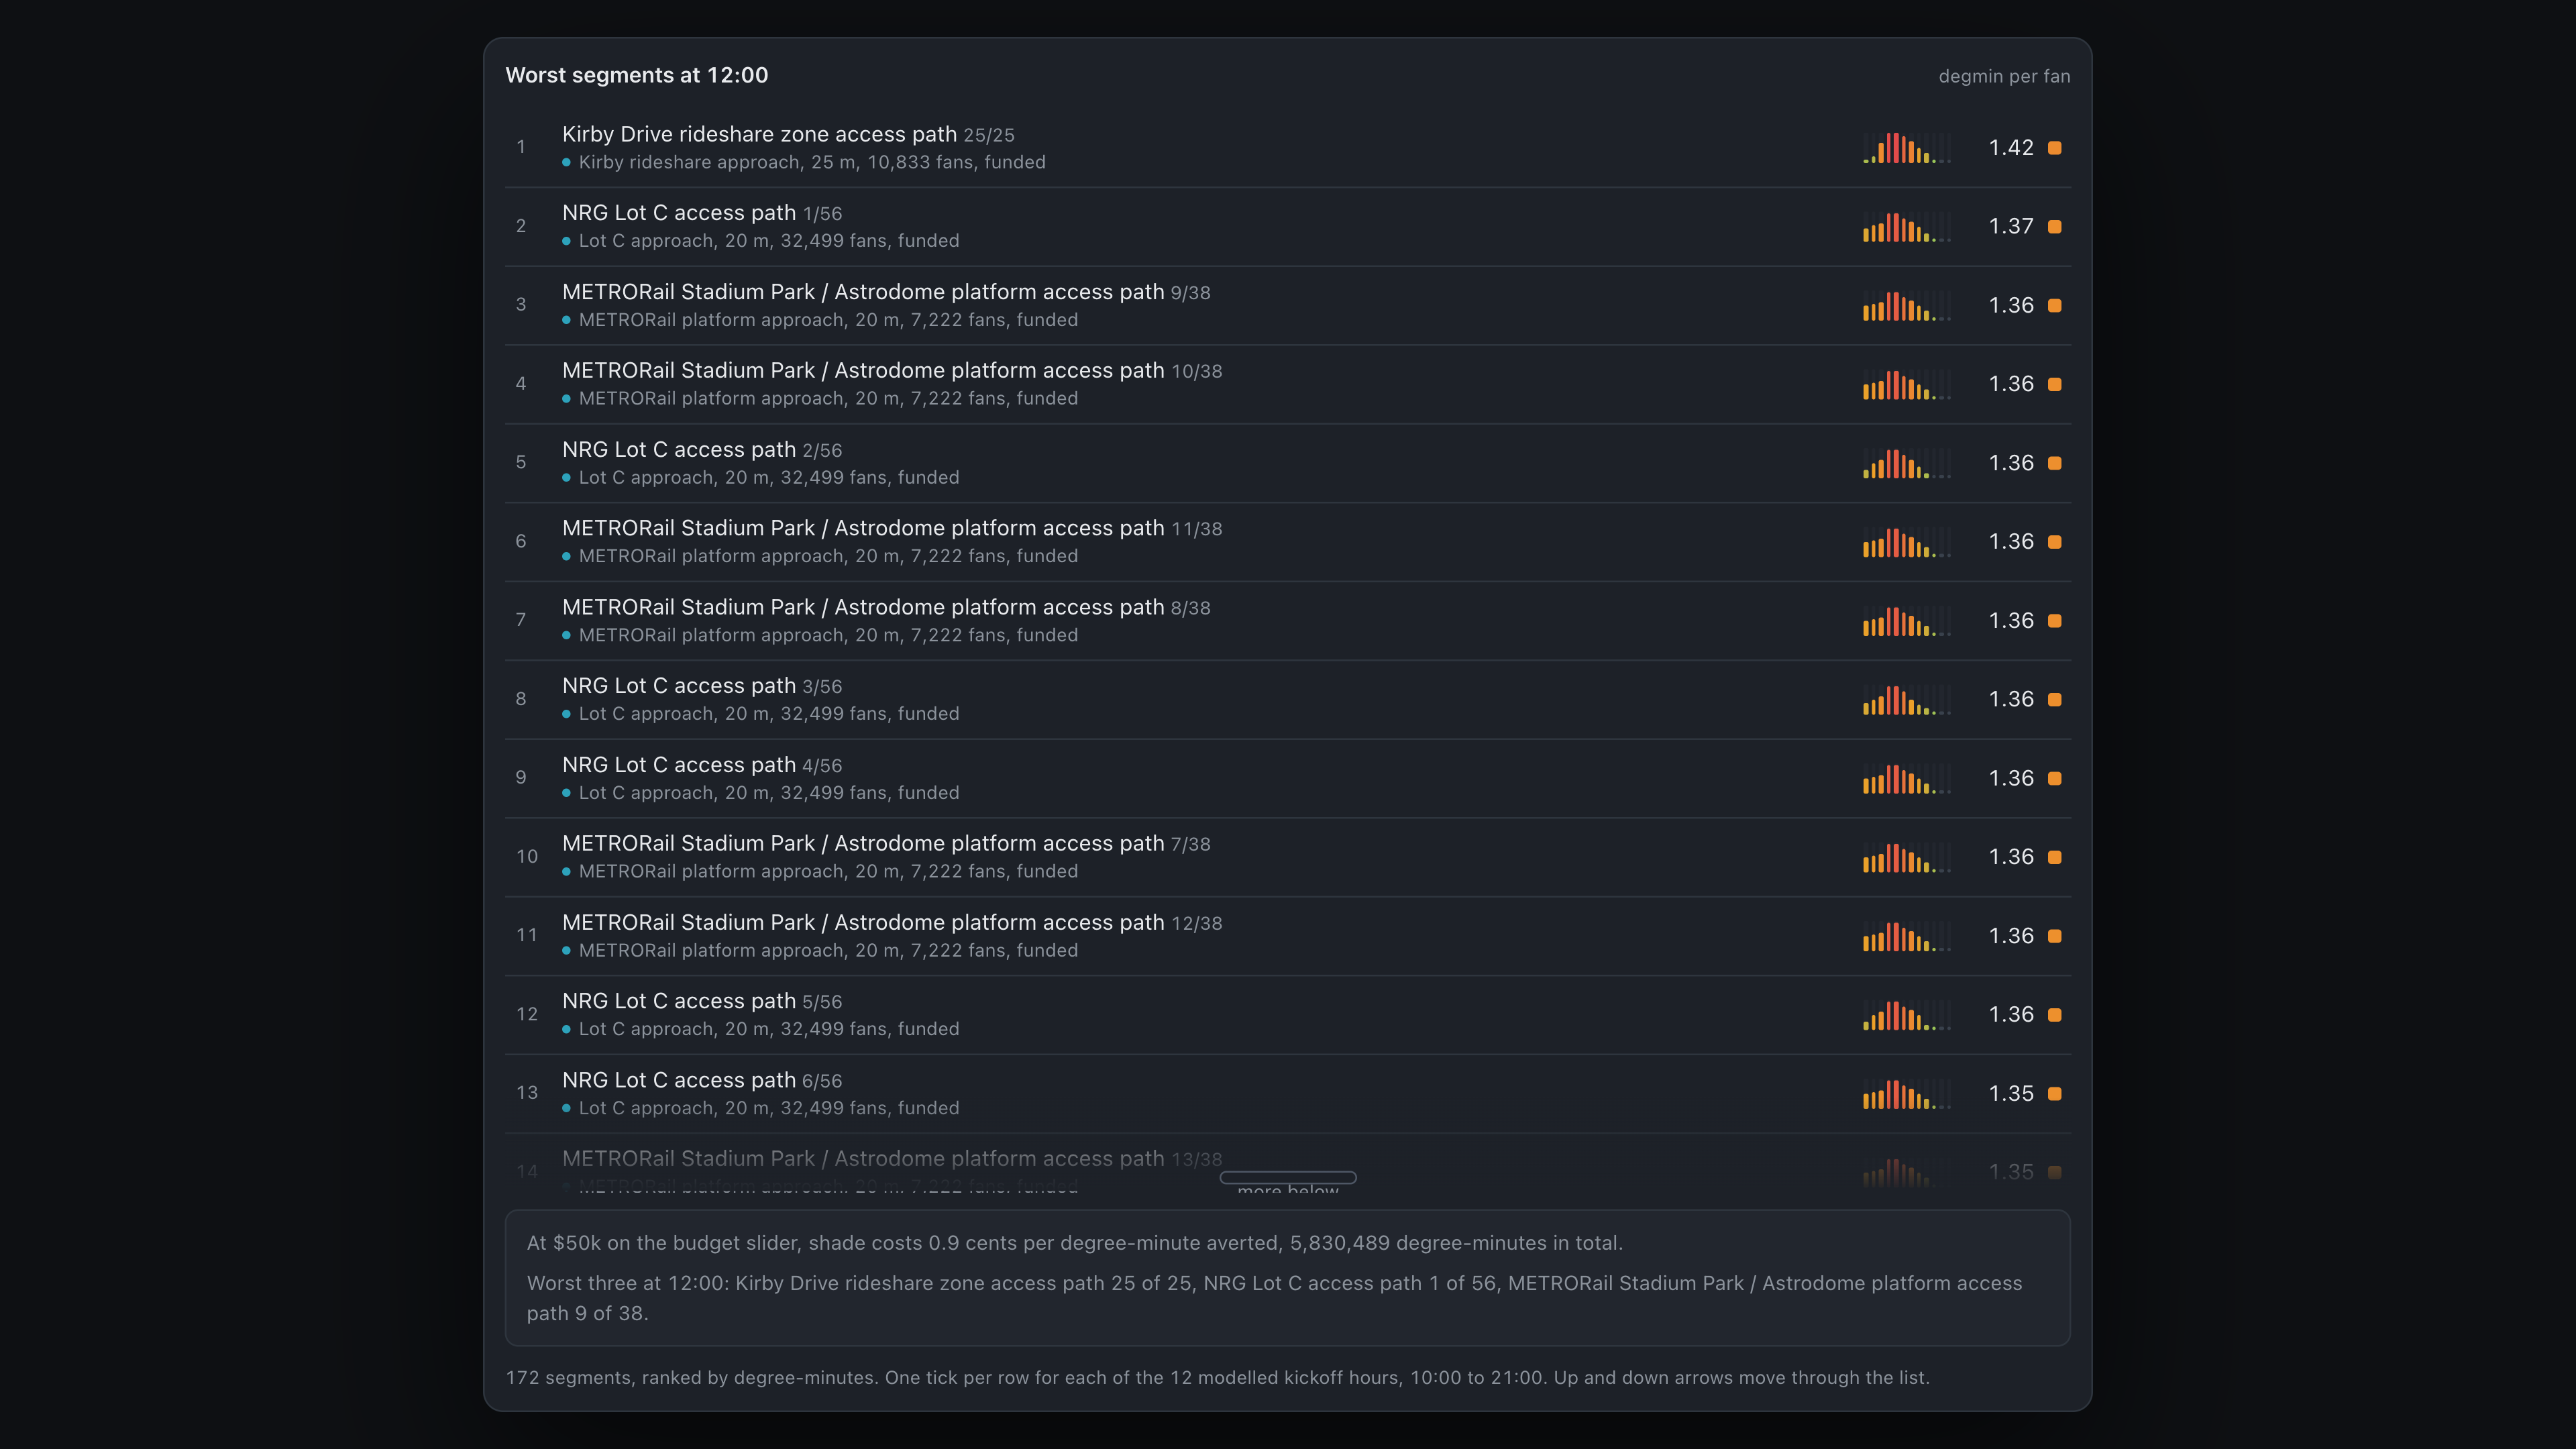
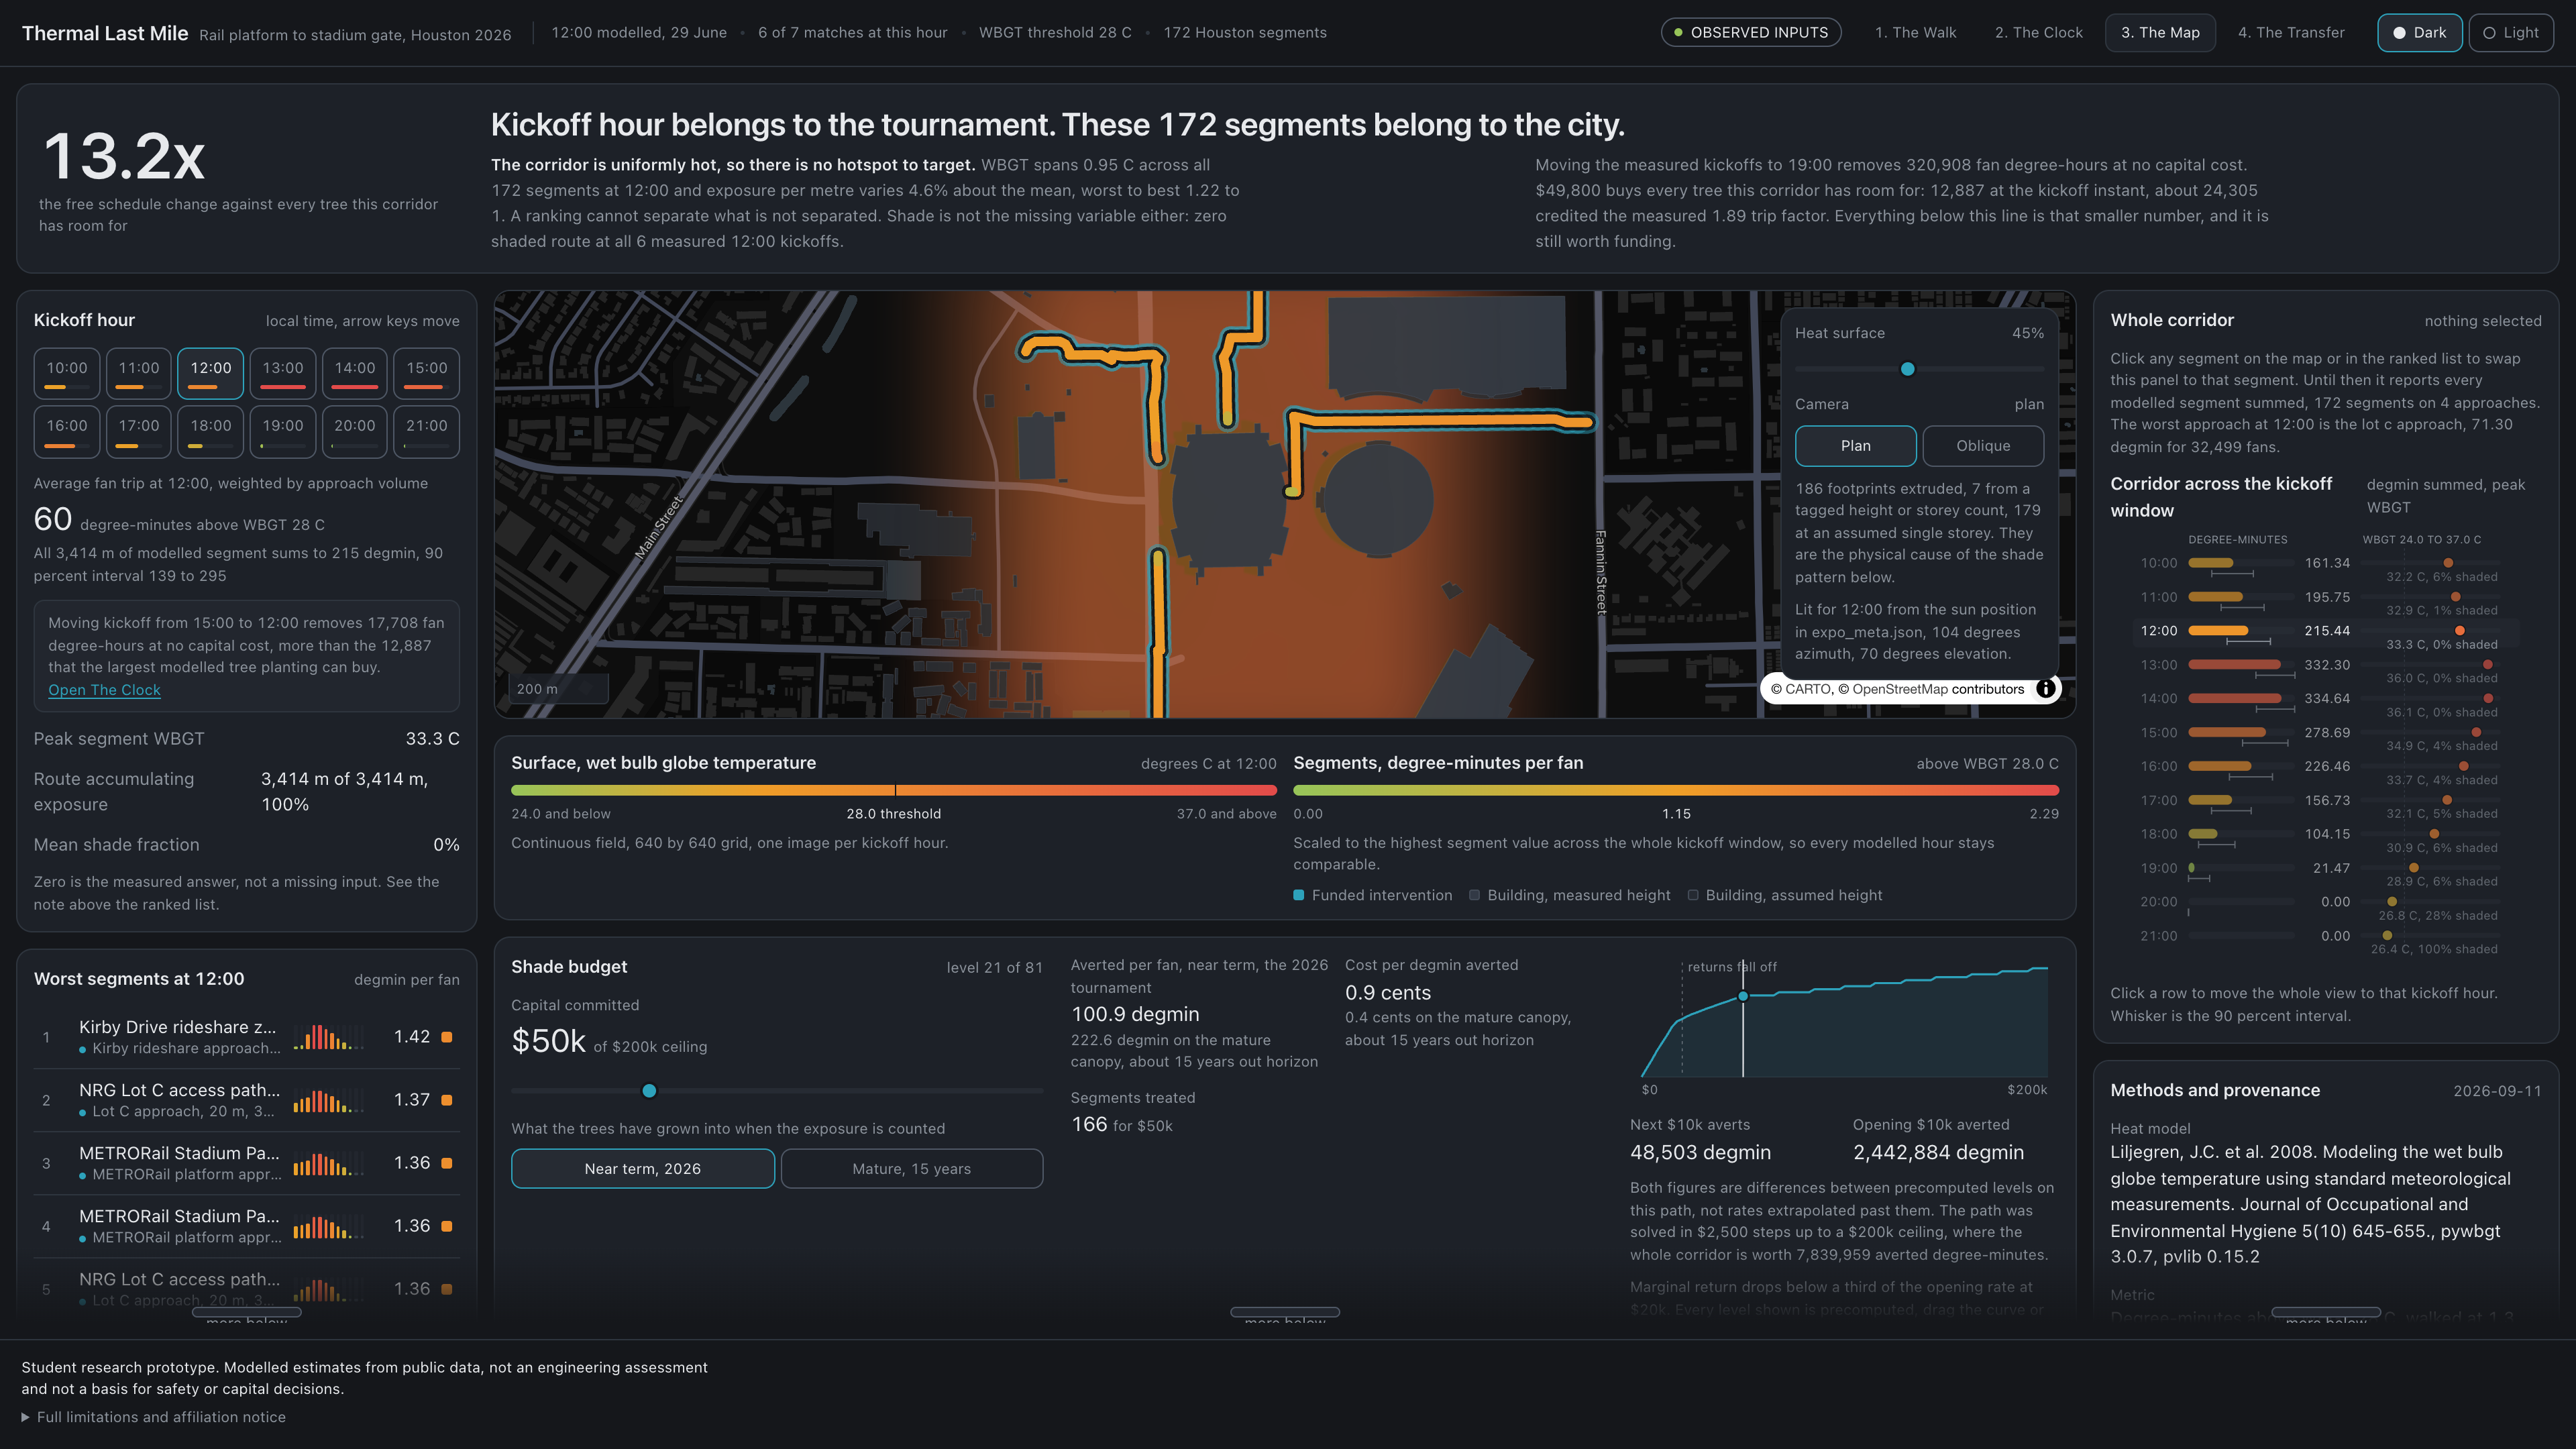
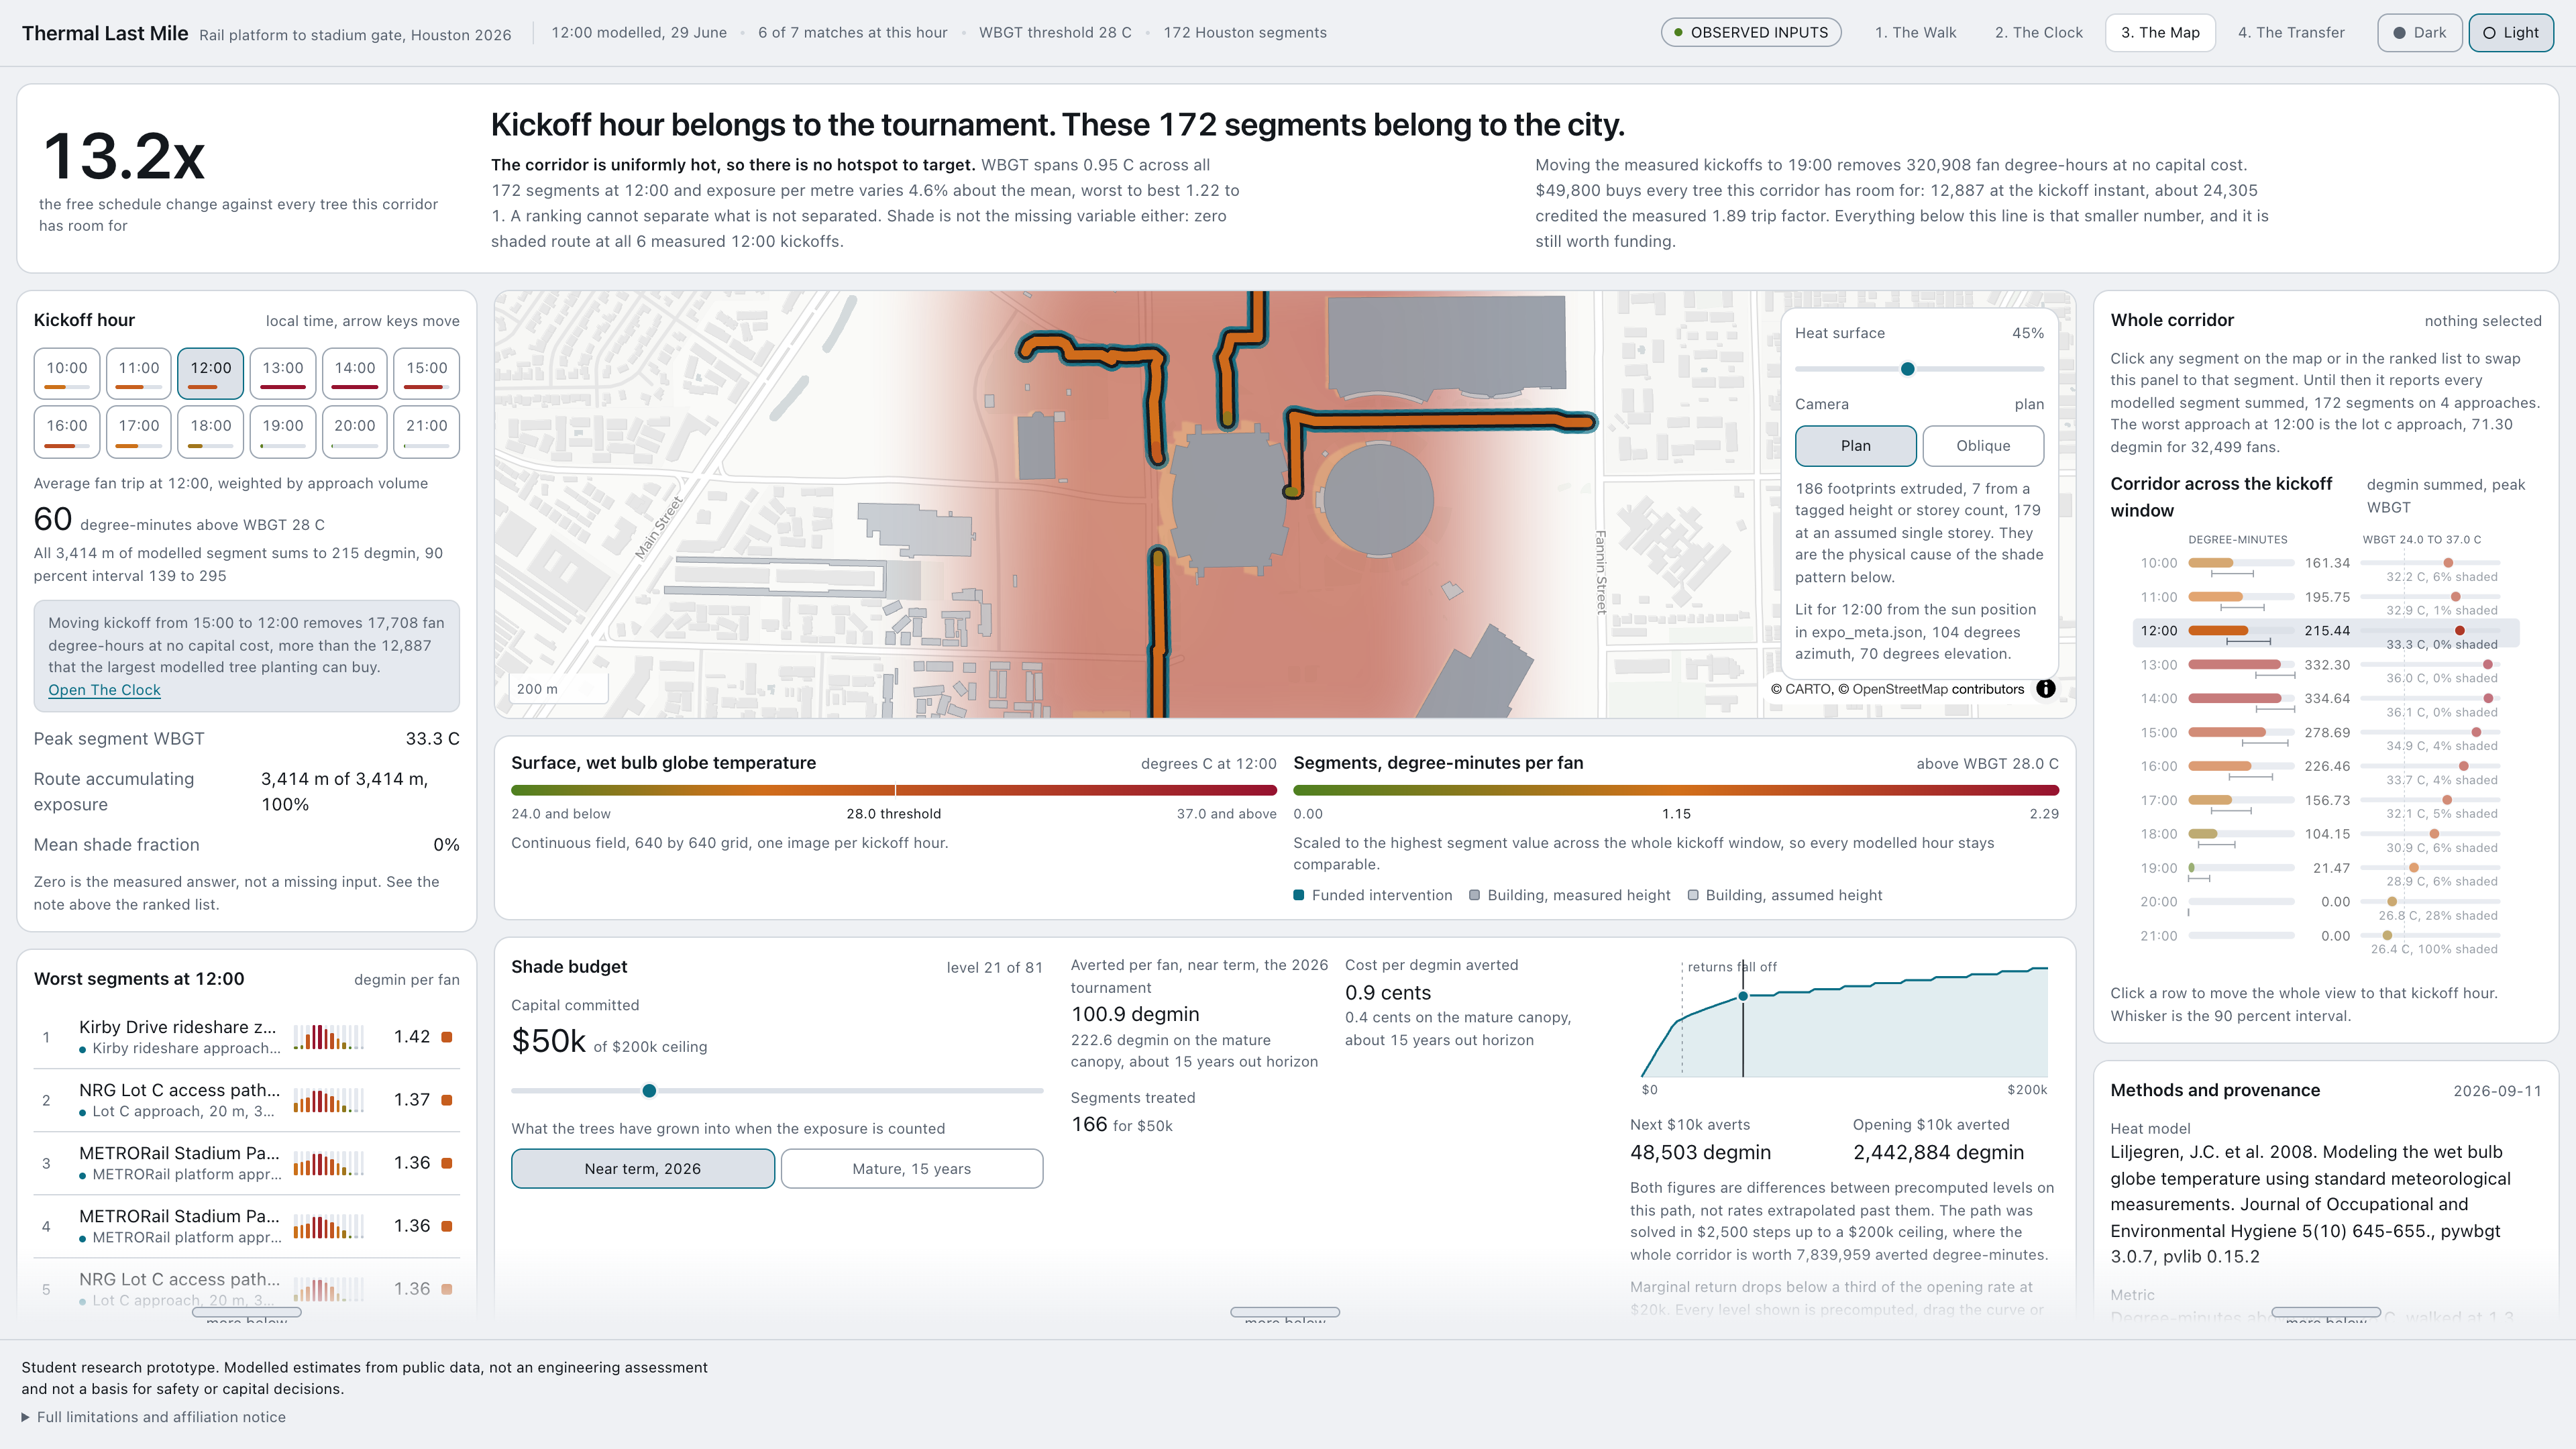
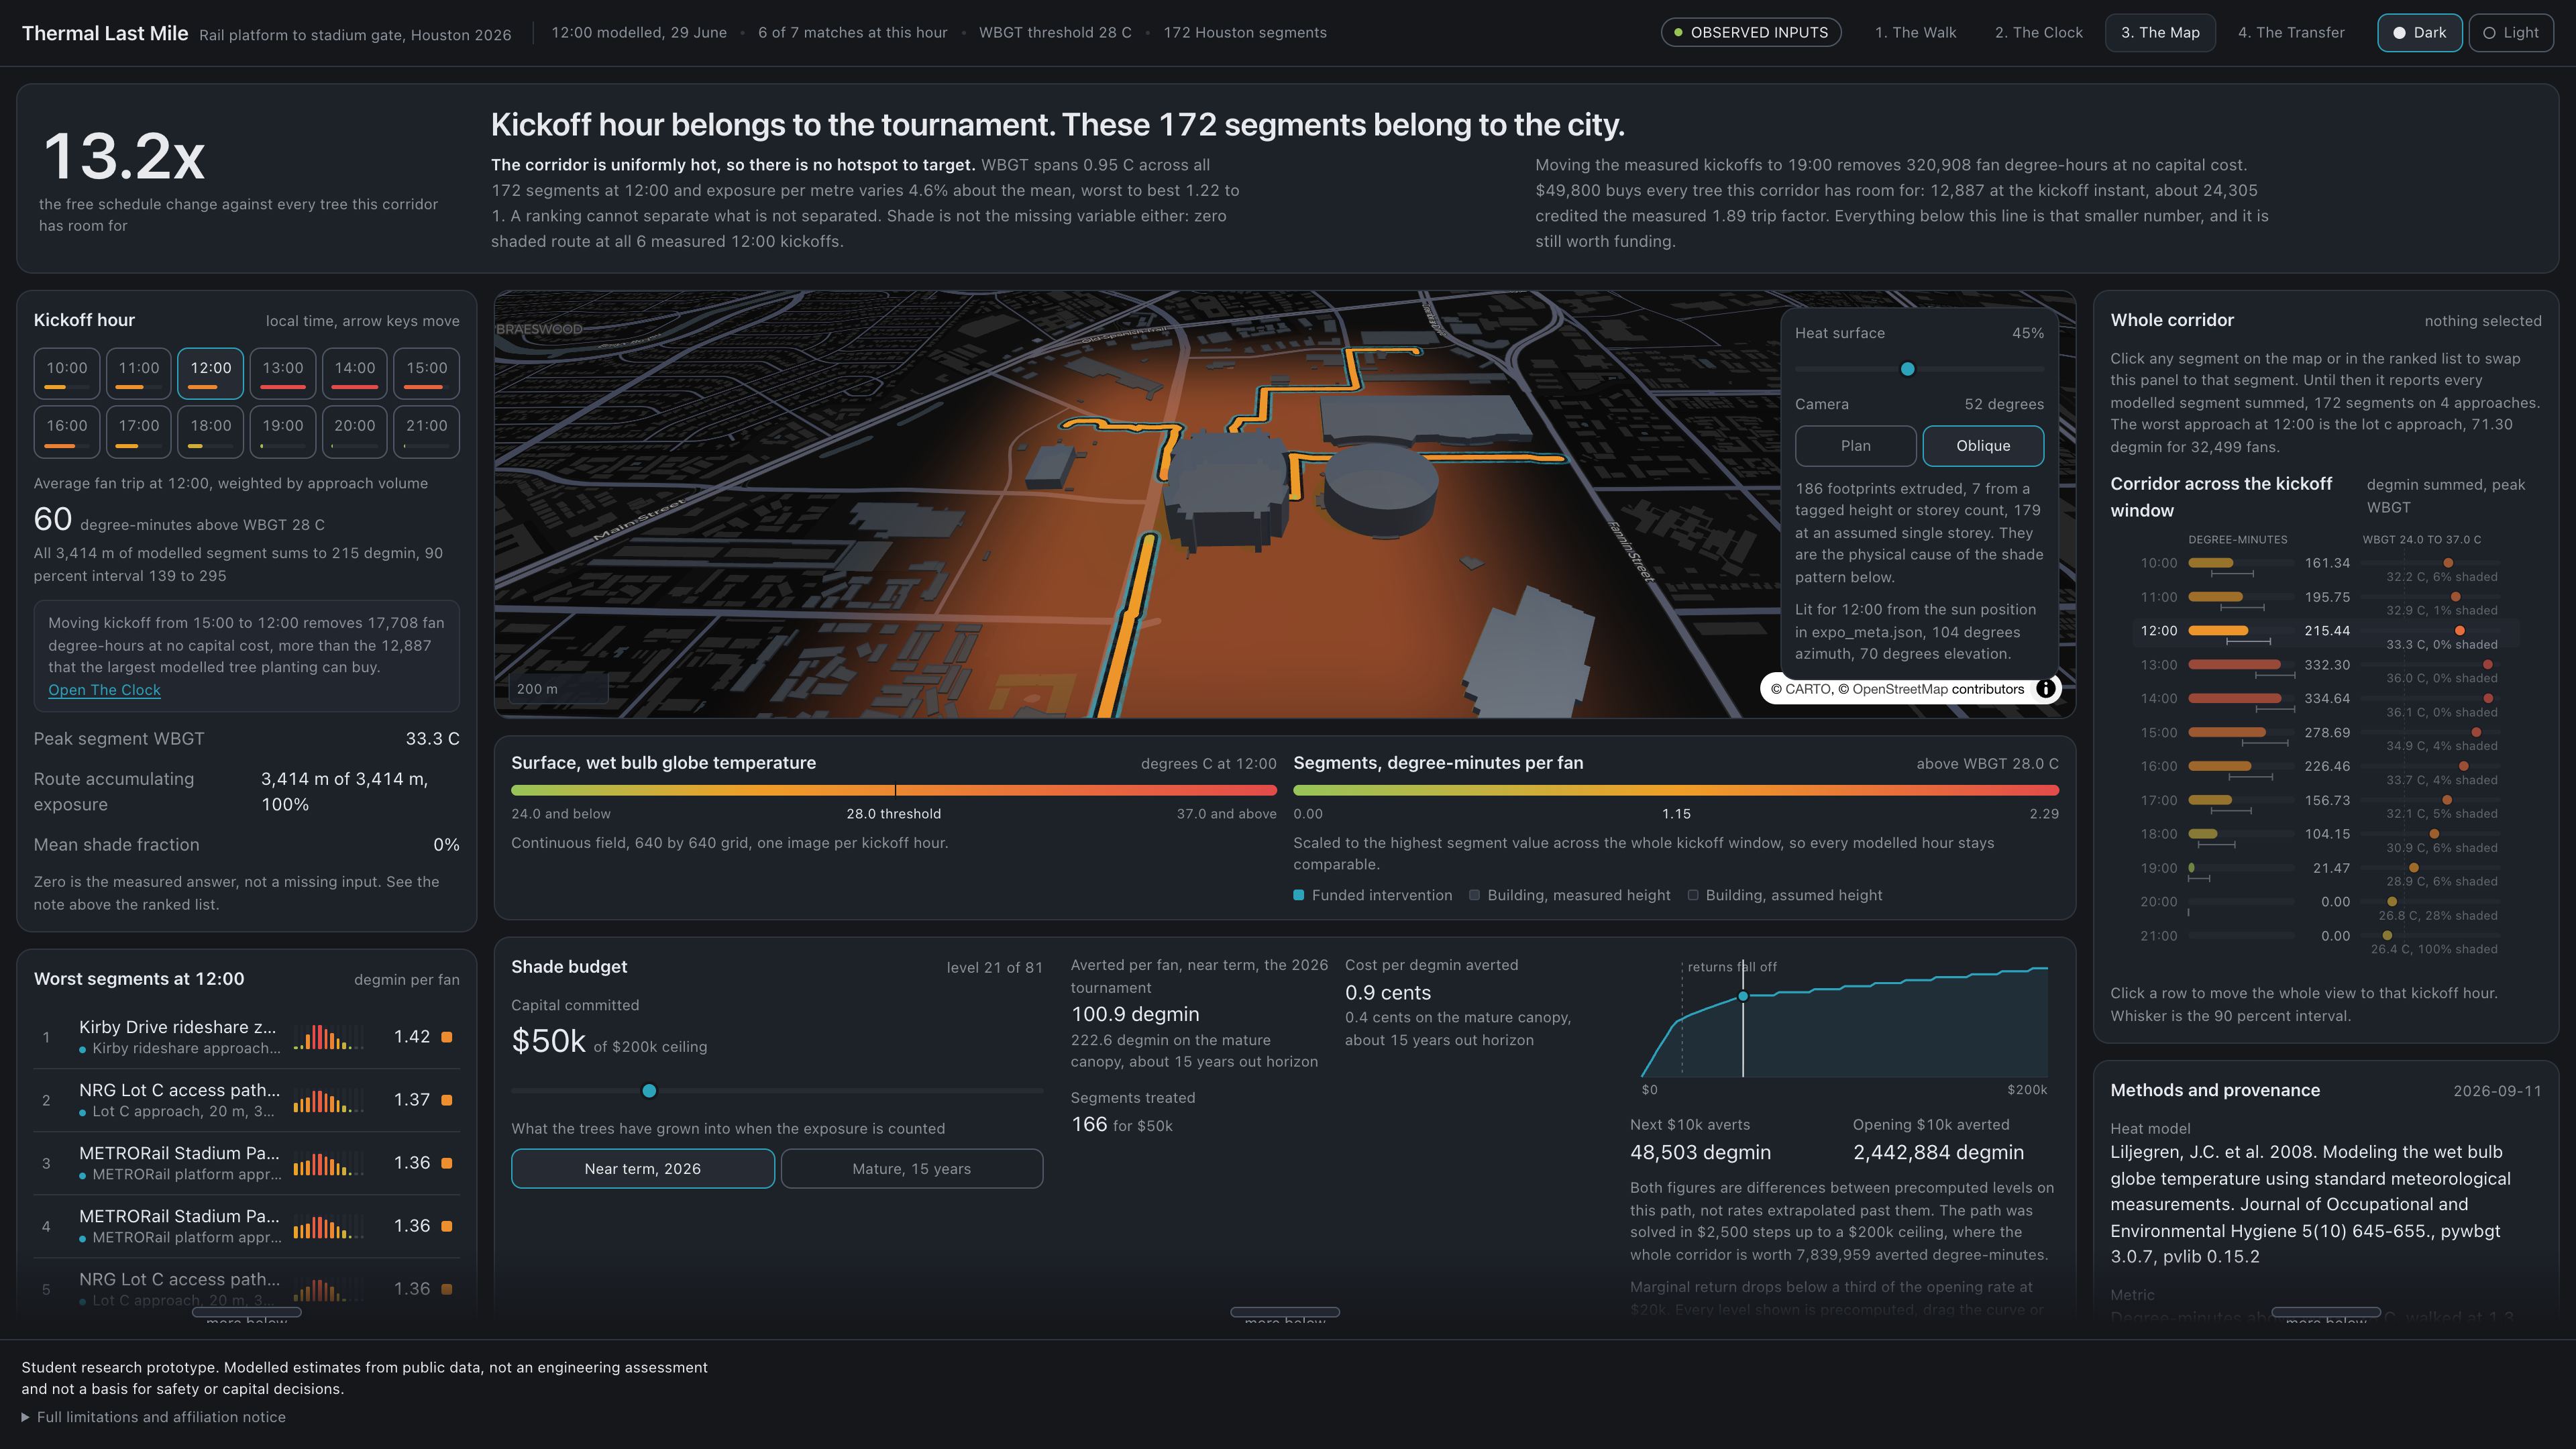
- The Map. Every segment colored by exposure, a ranked list of the worst blocks, an hour scrubber, a shade budget bar, and a methods panel that stays on screen.
- The Ledger. The same exposure metric across the US host cities, so Houston can be read against its peers instead of in isolation.
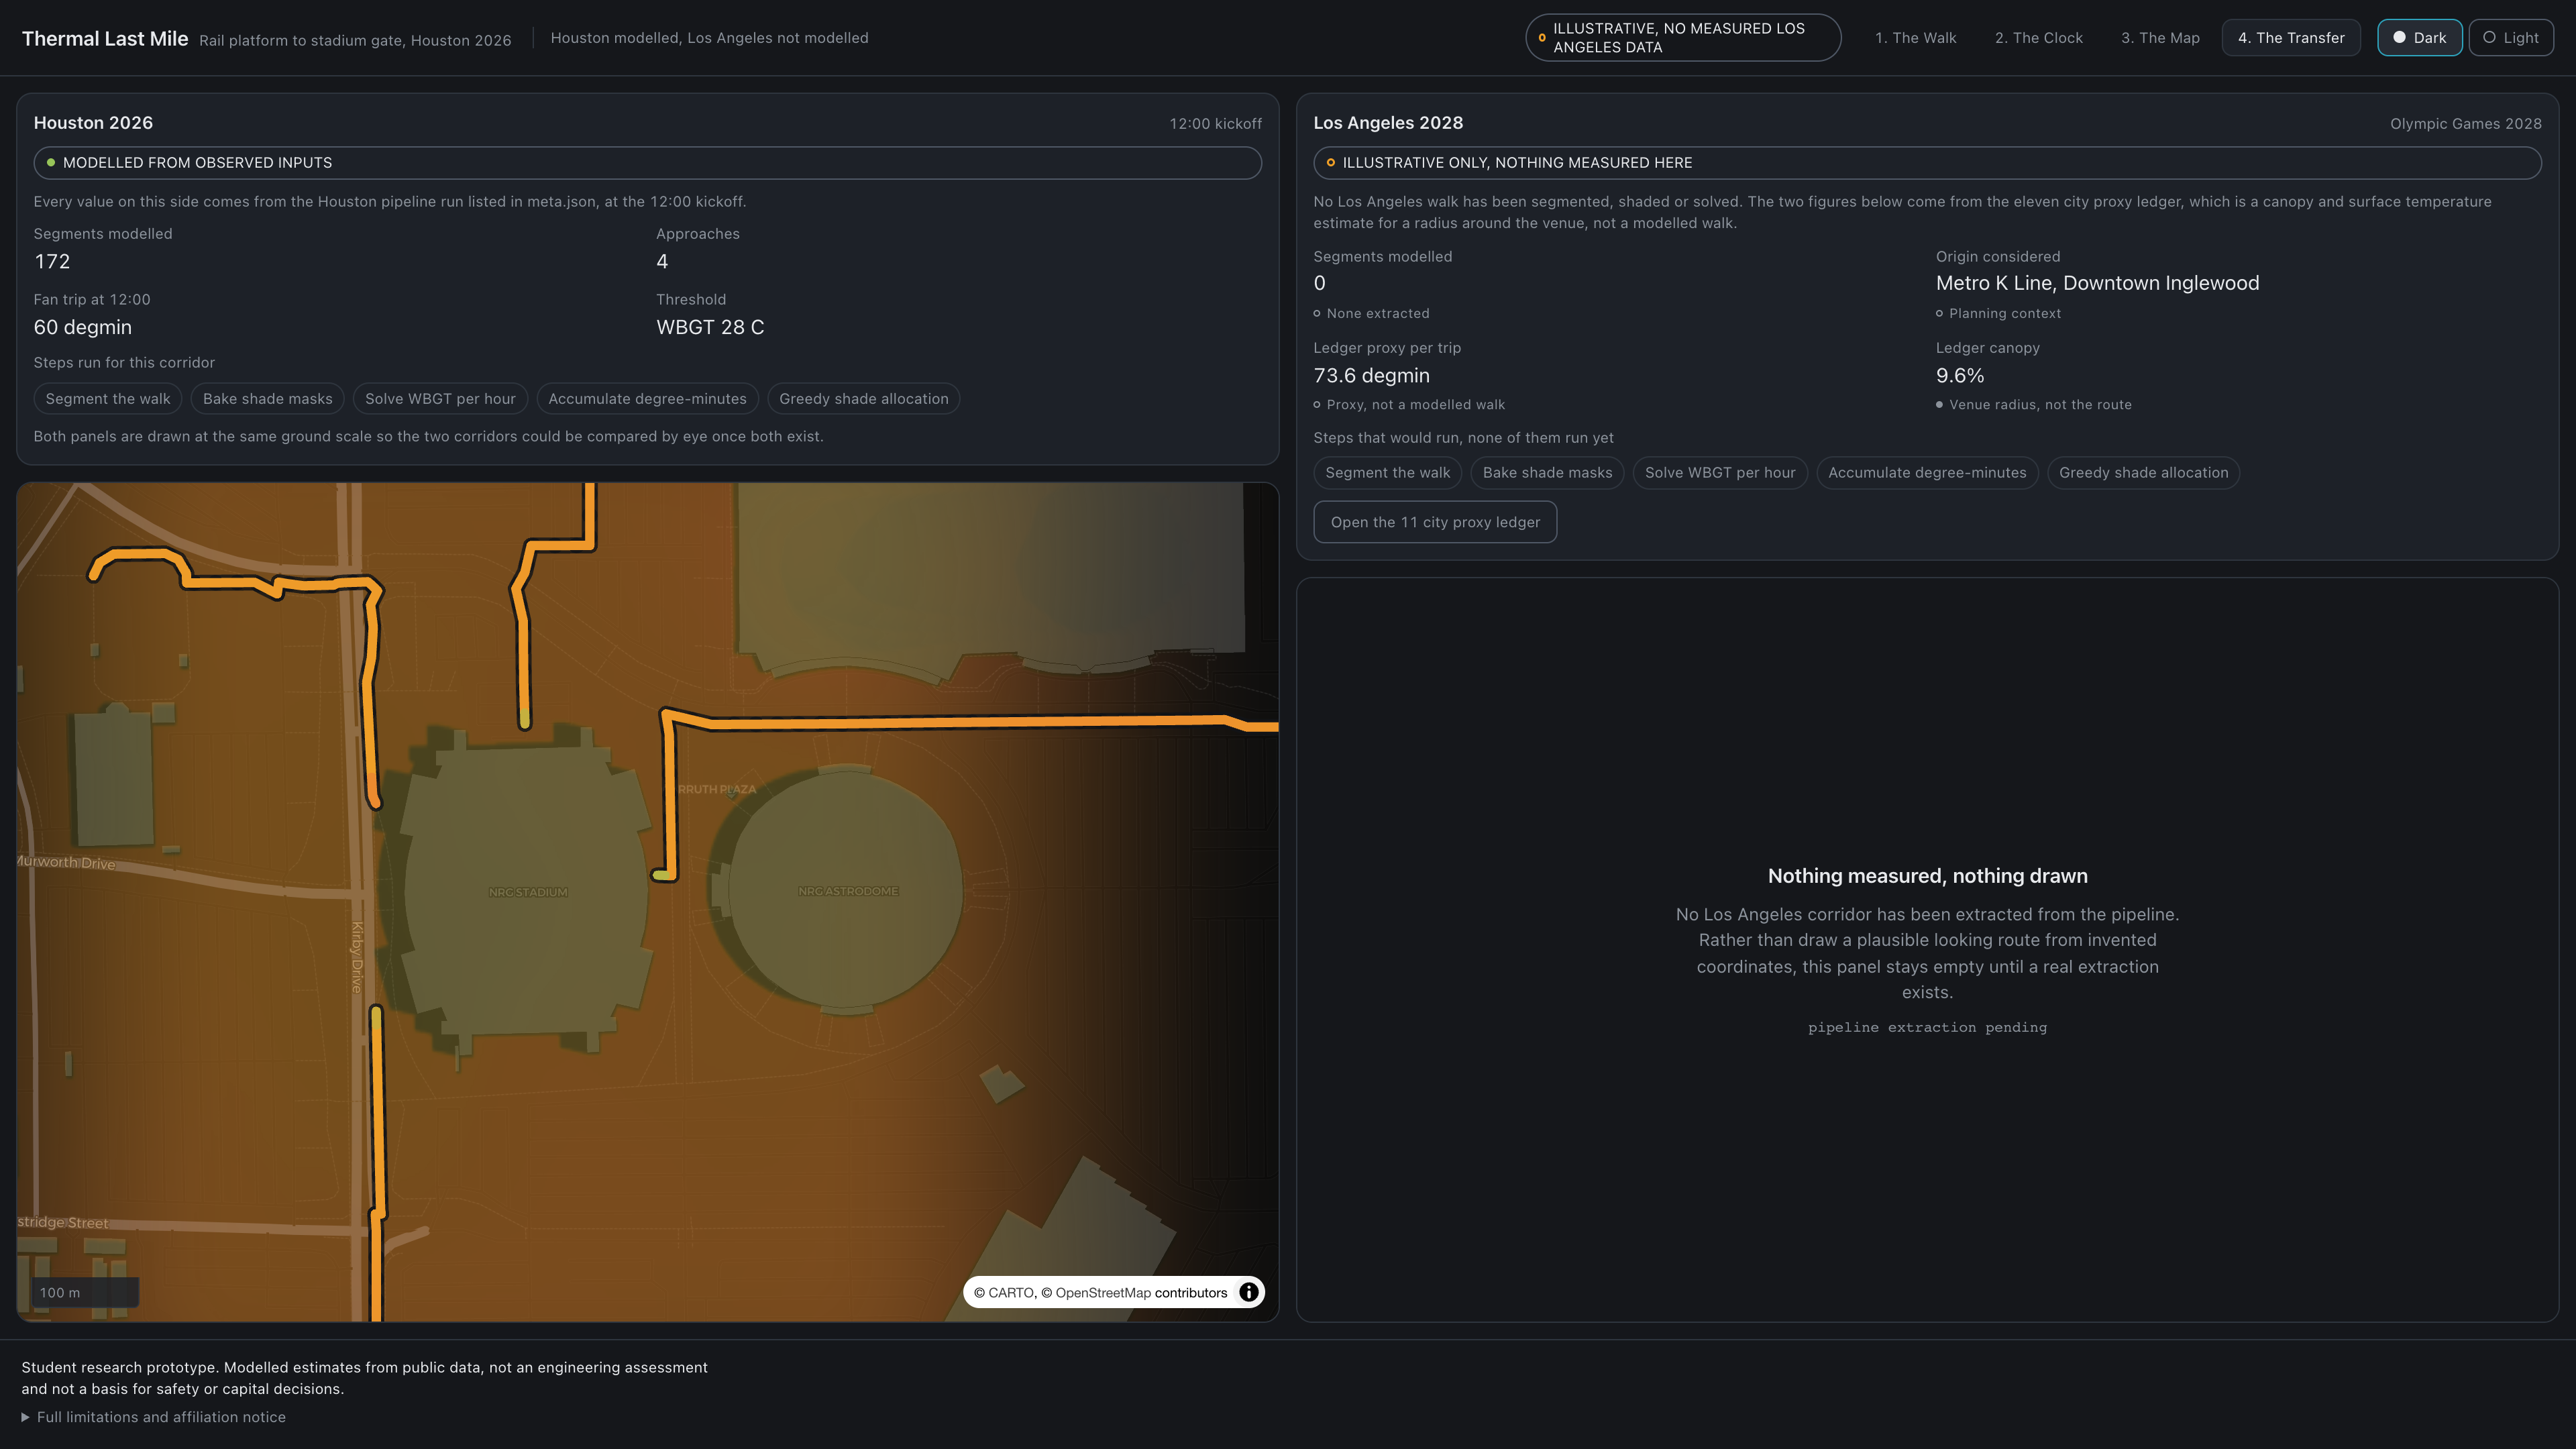
- The Transfer. The identical method applied to LA 2028 venue geography.
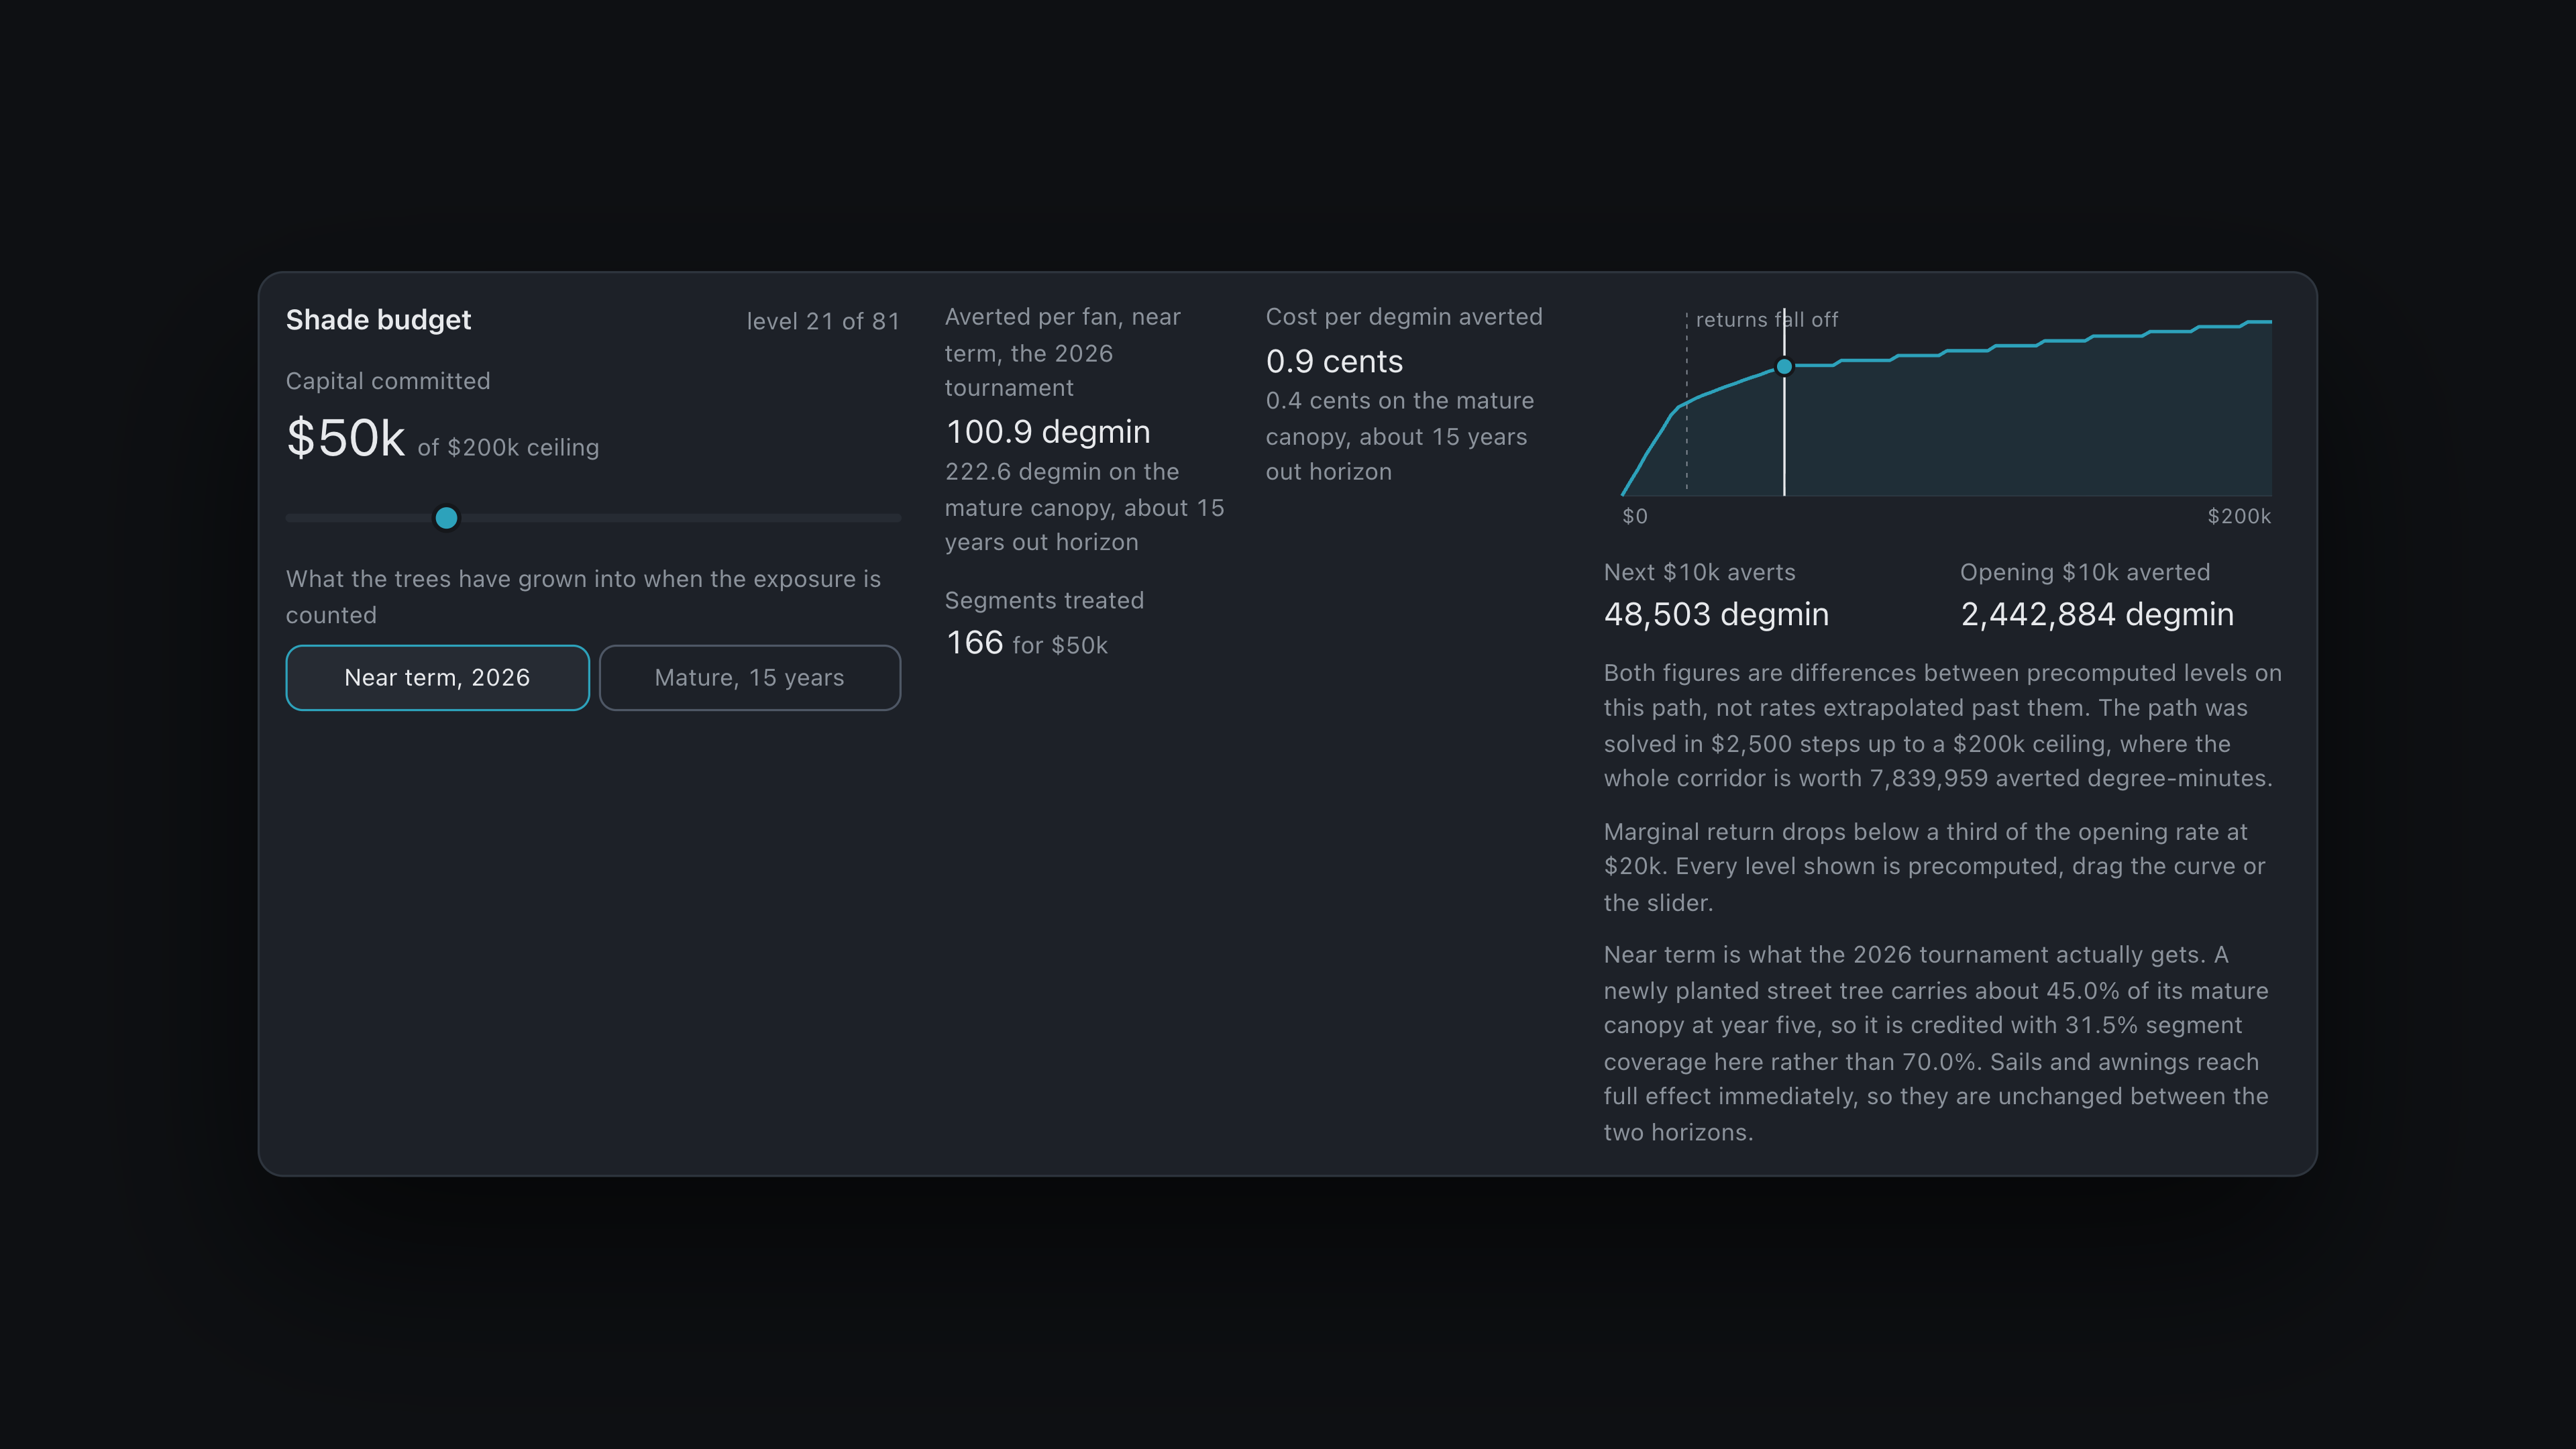
The budget bar is the part a city can act on. Move it and the system reports which segments get treated, how many degree-minutes that removes per fan, and the cost per degree-minute averted. Every recommendation is a shade sail, a street tree or an awning at a real unit cost, so the output is a purchase order rather than a warning.
How we built it
All of the physics runs offline. The browser only draws.
Offline pipeline (Python). Sidewalk network from OSM. Wet bulb globe temperature computed with the Liljegren model from observed station conditions on match dates. Solar position from pvlib at the actual kickoff times, then a vectorized ray march over a building and canopy surface model to bake a shade mask per hour. Exposure surface combines the two. Routes are split into roughly 20 m segments and exposure is integrated along each one, weighted by the fan volume using that approach.
Allocation. Shade placement under a budget is a constrained facility location problem with a submodular coverage objective, so greedy selection carries a proven approximation guarantee and runs in seconds. We precompute the entire solution path from $0 to $2M in $25,000 steps and write it to a lookup table.
Client. React, MapLibre GL JS and deck.gl, served as static files. No backend, no API key, no database, nothing computed at view time. The budget slider is an array index. The hour scrubber crossfades two baked images. Nothing in the interface can cold start, exceed a quota or go down.
Every number that reaches the screen already existed on disk before the page opened.
Challenges we ran into
Rendering a shadow is not measuring one. Our first instinct was to use WebGL lighting to cast building shadows in the browser. It looks impressive and it is useless, because a rendered shadow darkens pixels and cannot be integrated along a path. It produces no number. We moved the entire shade computation into the raster domain, where a shaded cell is a value you can multiply, sum and average, and treated the visual as a byproduct of the analysis rather than a substitute for it.
Choosing the boring optimizer. We seriously considered training a reinforcement learning agent to place interventions. We dropped it. Greedy on a submodular objective has a guarantee we can state and a result we can explain segment by segment. An RL policy has neither, and "the agent decided" is not an answer to a city engineer asking why a sail went on that corner.
Segment granularity versus decision granularity. Twenty meter segments are the right resolution for the physics and the wrong resolution for a budget conversation. Nobody funds "seg 33." We had to aggregate the ranking up to street blocks while keeping the underlying segments as the thing the optimizer actually spends on.
Making the basemap get out of the way. The default 3D building extrusions were the brightest objects on screen and carried none of our data. We had to fight our own map for attention.
Accomplishments that we're proud of
A metric a stranger can check. Degree-minutes above WBGT 32 is defined, cited, reproducible and falsifiable. It is not an index we invented and weighted to taste.
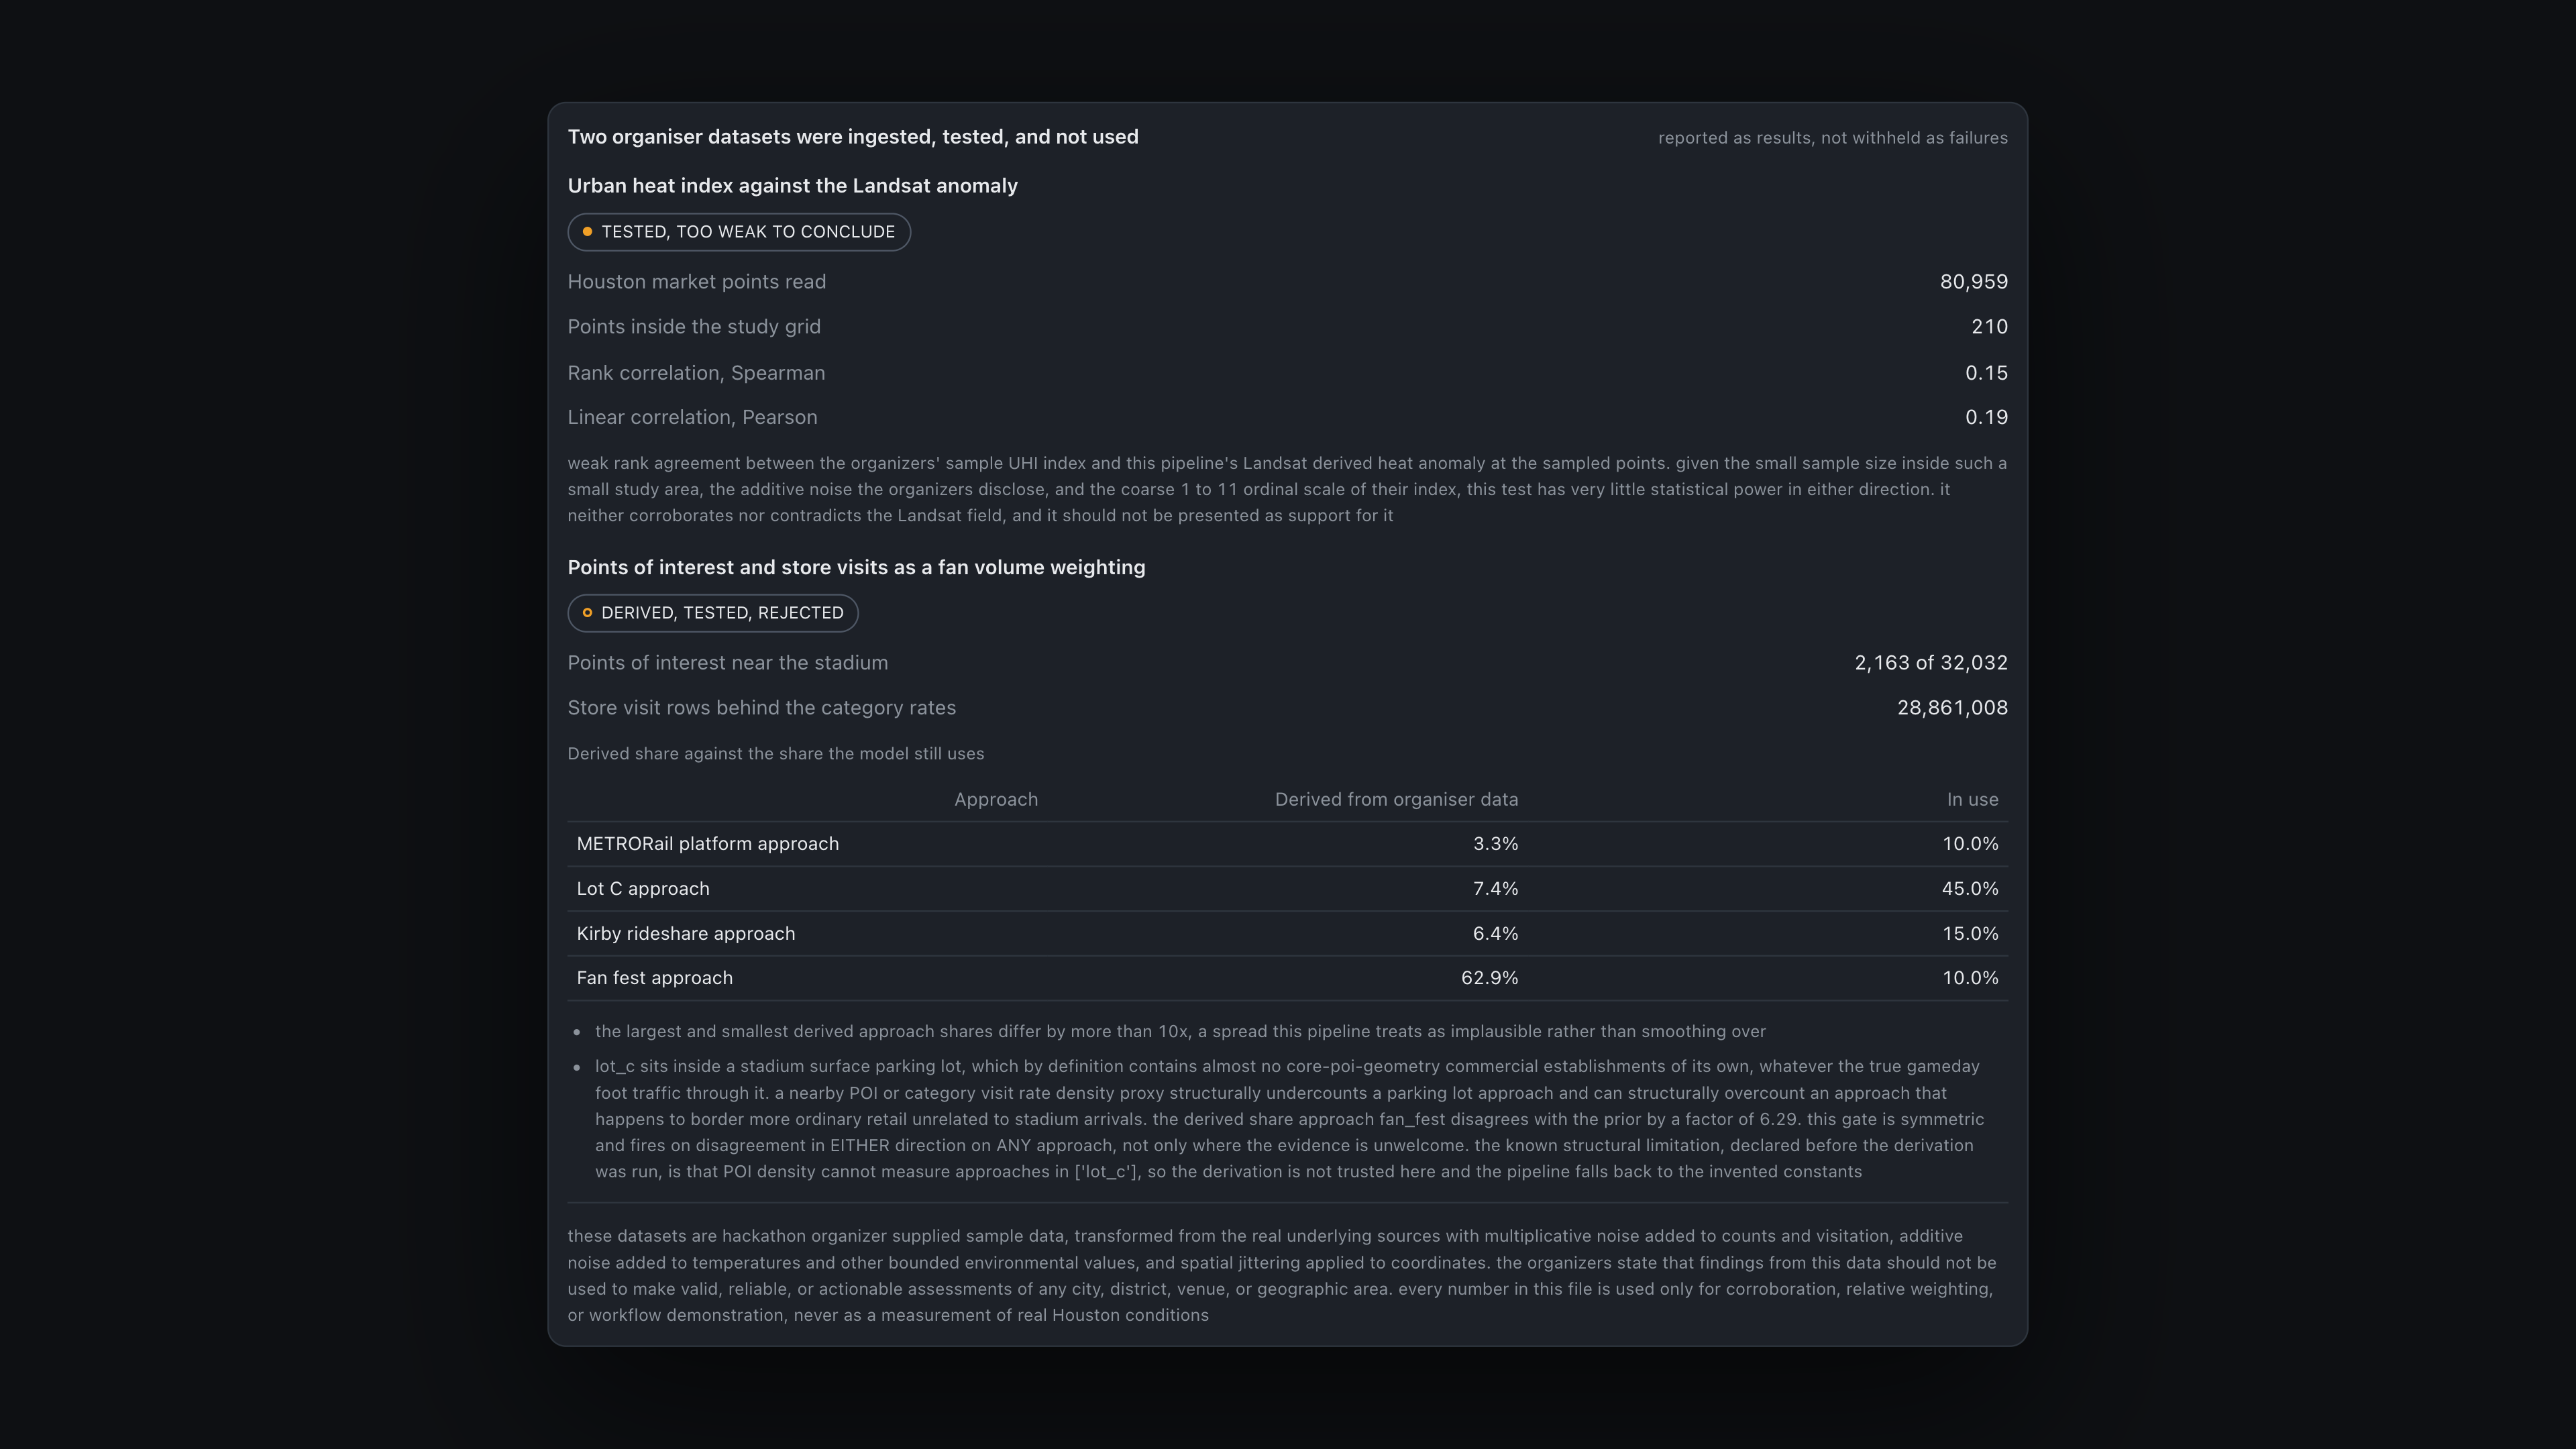
A methods panel that lives inside the interface rather than an appendix, naming the heat model, the data products, their resolution, acquisition dates, licences and the source of every unit cost. Scrutiny should be one glance away, not one email away.
Uncertainty carried through the pipeline into the schema, so the ranking never claims more precision than the model supports.
A downloadable CSV of ranked segments with costs, which means the deliverable is something a public works department can open on Monday and not only a demo we can drive.
What we learned
That the interesting failure in urban heat work is one of units. Cities measure temperature because temperature is easy to measure. People experience duration above a threshold, which is harder and far more decision relevant. Changing the unit changed every downstream answer, including which blocks ranked worst.
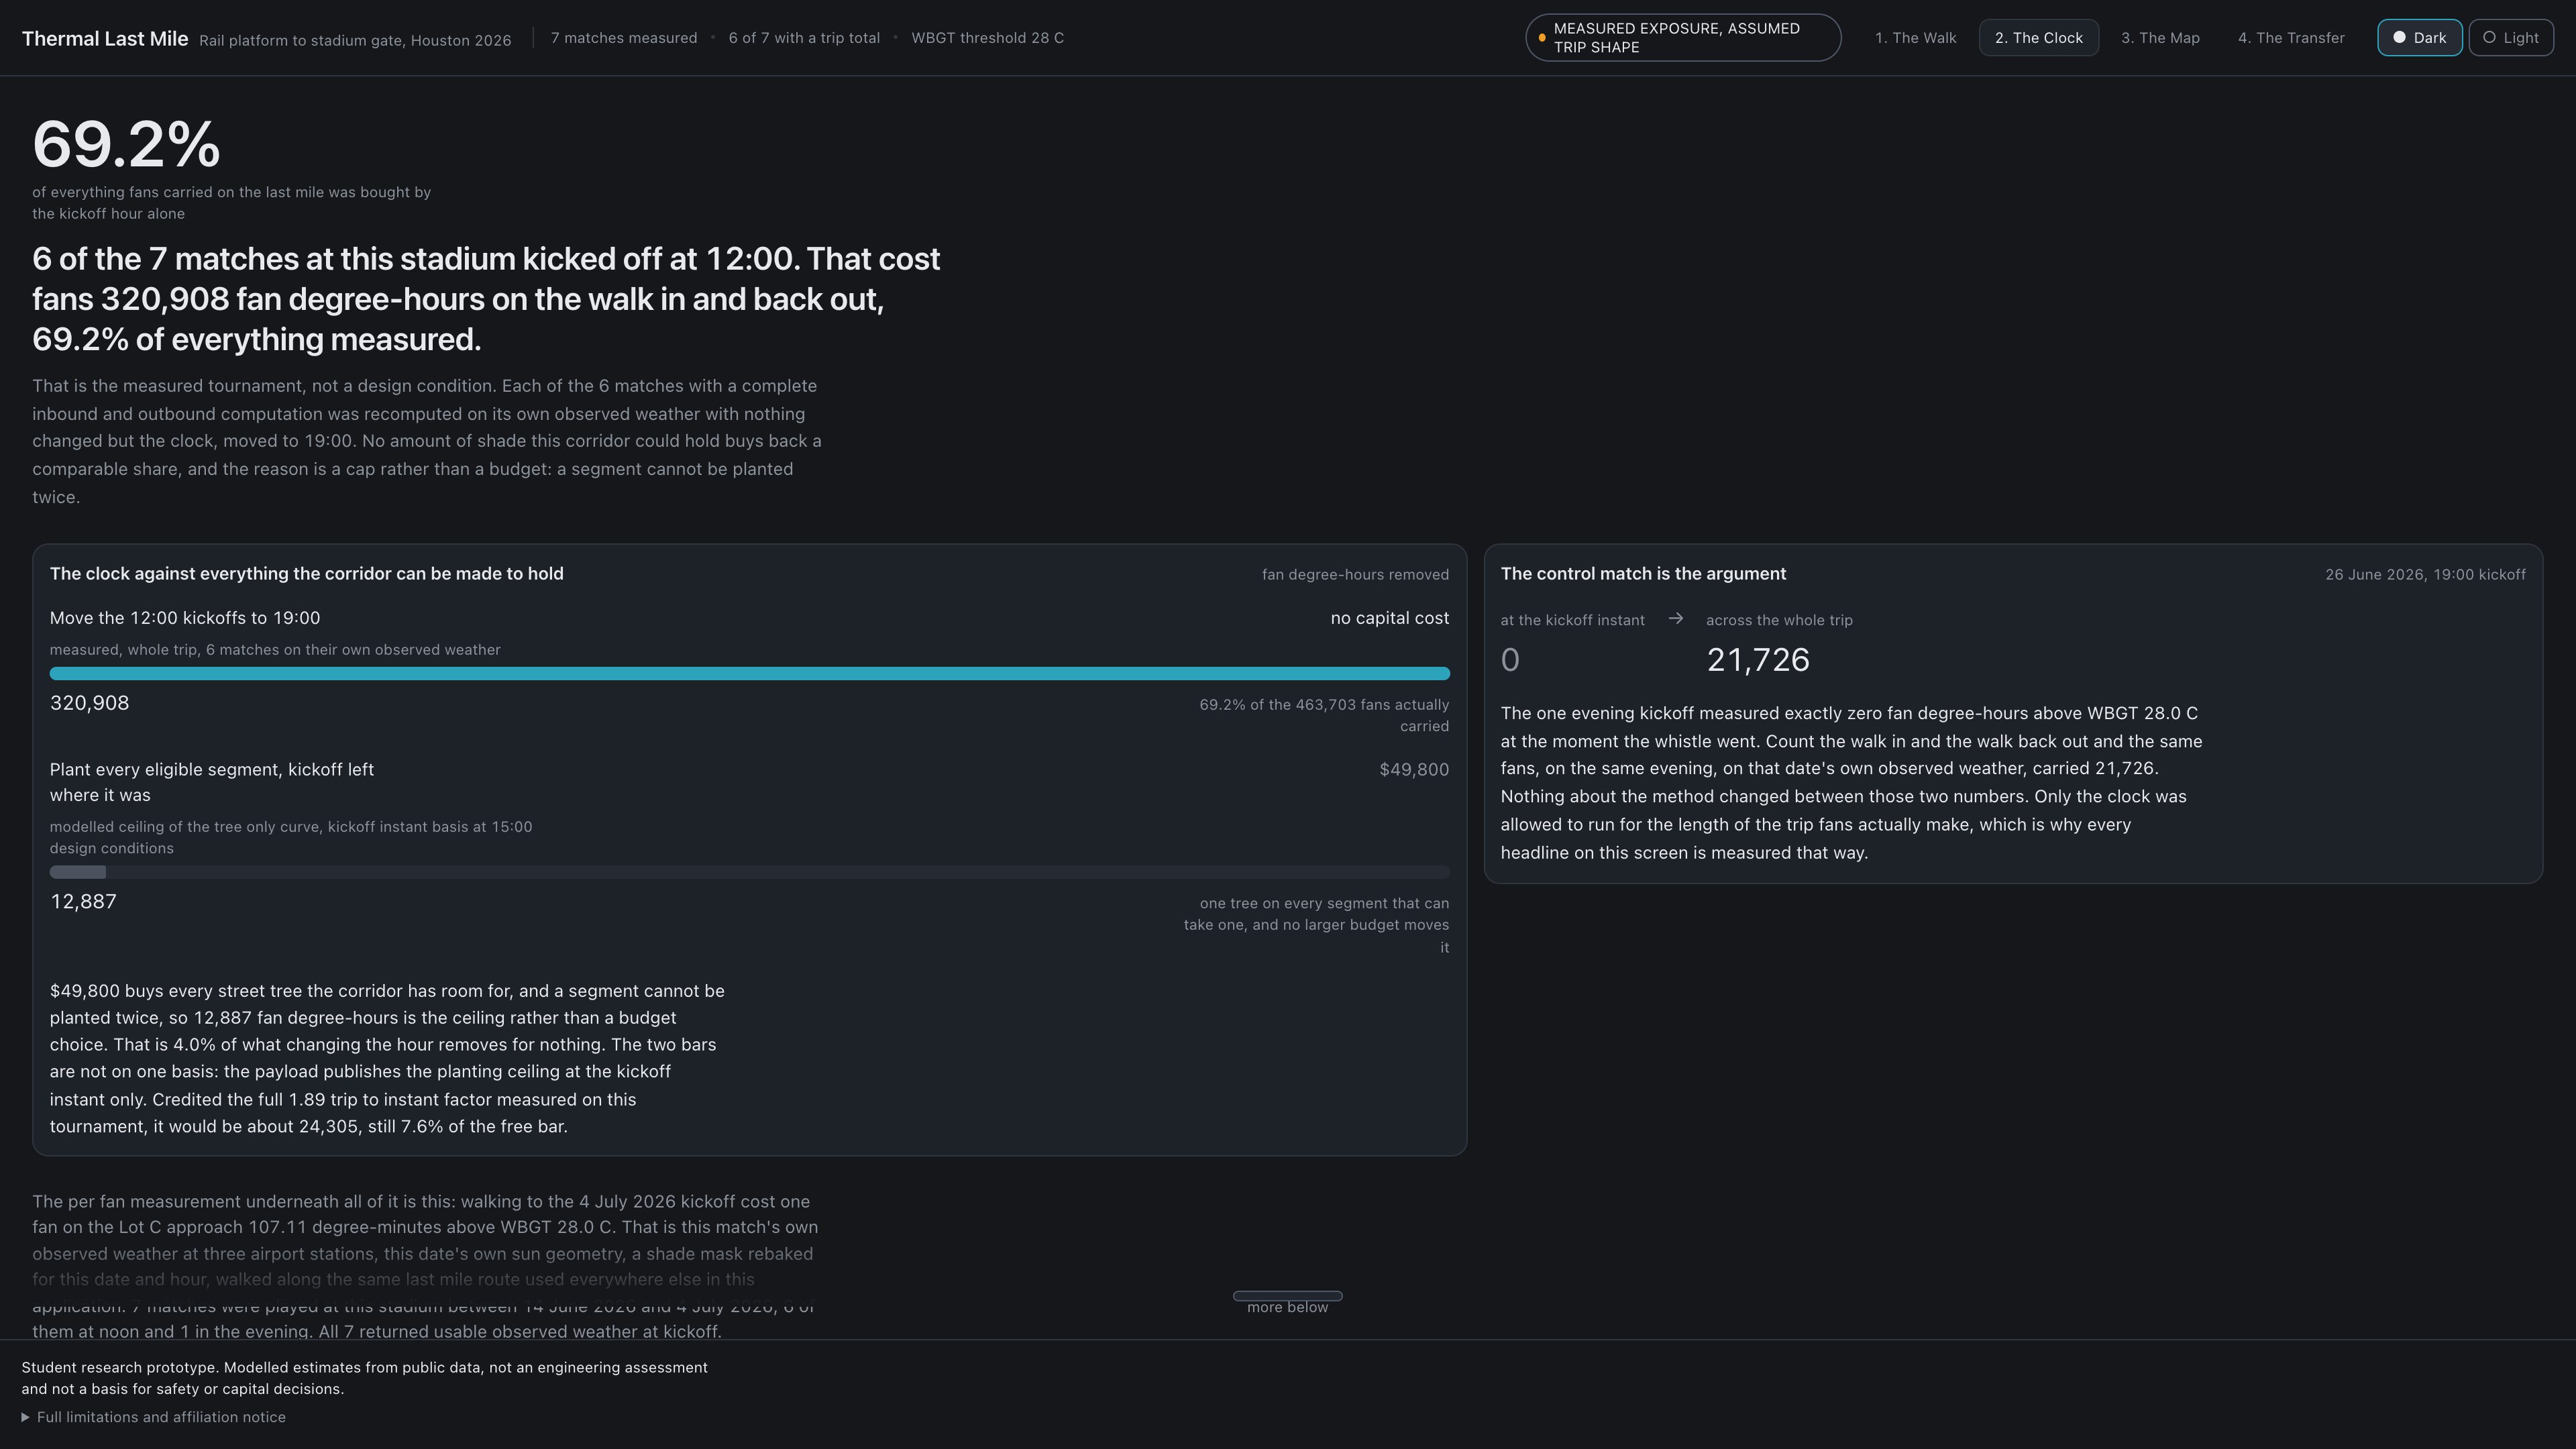
That shade is a geometry problem before it is a policy problem. Where a building casts at 15:00 and where it casts at 19:00 are different interventions on the same sidewalk, and a fix that is correct at one kickoff time can be irrelevant at another.
That constraints make a project honest. Committing to no backend forced everything to be precomputed, and precomputing everything forced us to decide in advance exactly what we were claiming.
What's next for Thermal Last Mile
The method is venue agnostic. It needs a pedestrian network, a surface model and observed weather, all of which exist for every US host city, which is why the Ledger and the LA 2028 view already run on the same code path.
The legacy case is the real one. A shade sail bought for a World Cup match protects the people waiting at that bus stop every summer for the next thirty years. The tournament is the occasion for the spending, not the justification for it. The next step is folding year round transit ridership into the weighting, so the same optimizer answers a question a city has every July whether or not anyone is hosting anything.
Beyond that: heat illness call data to validate exposure against outcomes, cooling center and hydration siting as additional intervention types, and a mode that ranks segments by exposure per dollar of existing capital plan, so shade gets scheduled alongside repaving instead of as a separate ask.
Built With
- deck.gl
- geopandas
- javascript
- landsat
- maplibre-gl
- networkx
- numpy
- osmnx
- pvlib
- python
- rasterio
- react
- shapely
- submodular-optimization
- vite
- wbgt
- zustand


Log in or sign up for Devpost to join the conversation.