-
-
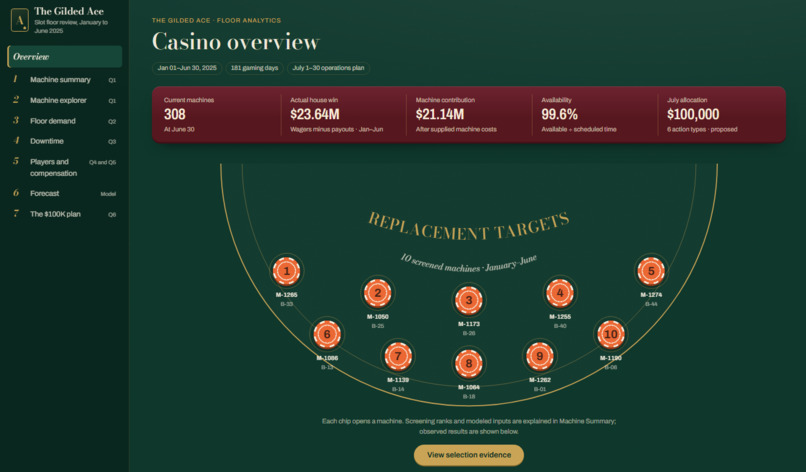
Front of Dashboard
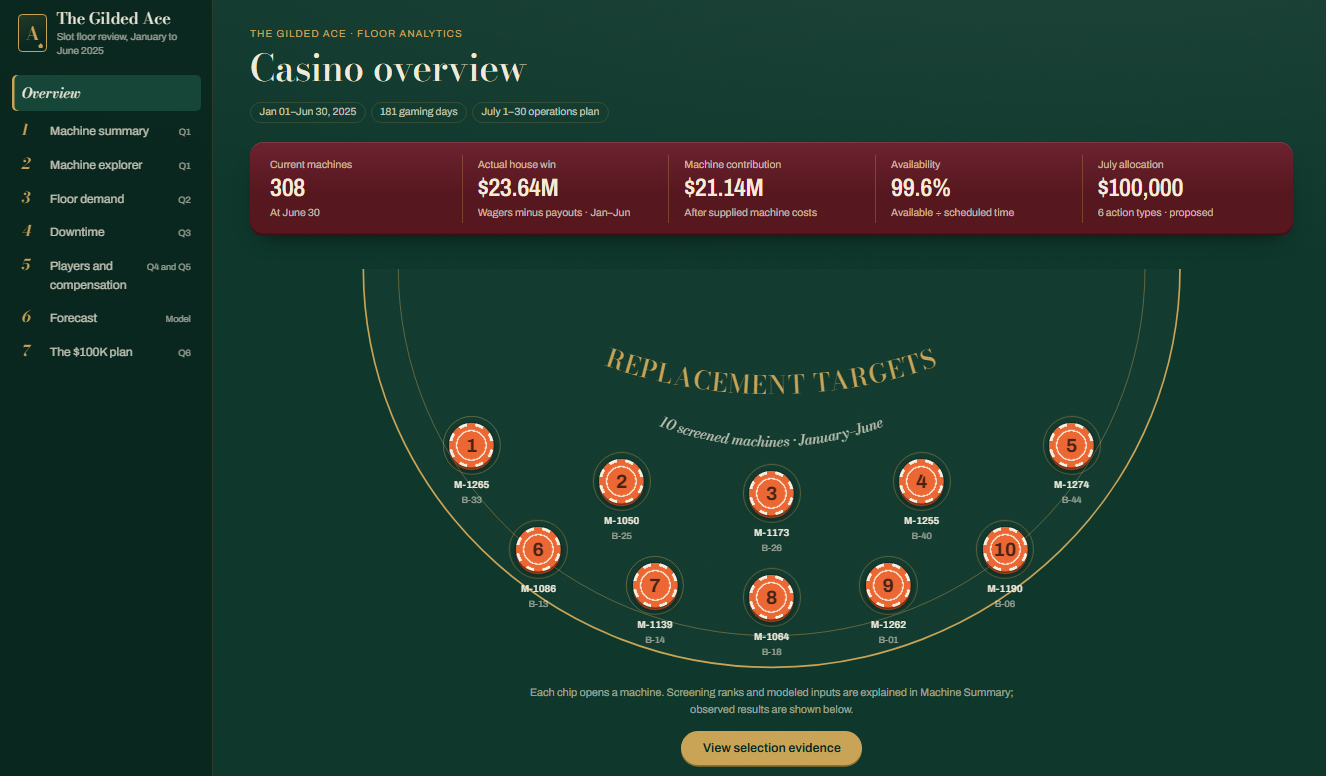
The Gilded Ace: Casino Floor Analytics
Turn casino operating data into machine-level evidence and a priced action plan.
Devpost write-up
Inspiration
Low earnings alone do not establish that a slot machine needs replacement. A machine may have limited operating time, a quiet location, weak demand, high costs or unusual payout results. We built The Gilded Ace to make those differences visible before committing an operations budget.
What it does
Our interactive dashboard analyzes January–June 2025 at a fictional casino. It identifies ten screened replacement targets and lets users inspect actual earnings, wagering demand, availability, peer comparisons and monthly persistence. A clickable floor map connects each machine to its operating history.
Additional pages examine floor demand, external market context, downtime, loyalty-player outcomes and the economic cost of player rewards. A forecast page shows historical wagering, saved predictions, the model calculation and July demand estimates. The action plan allocates the full $100,000 across replacements, inspections, maintenance, signage, a survey and a promotion, with explicit targets, costs, controls and measurement plans.
How we built it
Python and DuckDB transform 31 Parquet source tables into 14 analytical marts. Flask serves the dashboard, while pandas, NumPy and Plotly support calculations and interactive visualizations. The pipeline validates accounting, table keys, time coverage and joins before publishing the database.
We compare weekday-average and calendar-regression forecasts using April validation, freeze predictions for a May–June holdout, then refit the selected method on January–June for July. The current selected method is weekday averages.
Challenges and accomplishments
The hardest problems were comparing machines fairly, handling moves and downtime, separating carded play from all-floor activity, and presenting modeled quantities without treating them as observed facts. We built a reproducible path from source data to interactive evidence, forecast validation and target-specific proposed actions.
What comes next
Evaluate the proposed interventions against their controls, improve game-mix comparisons and extend follow-up beyond July before claiming sustained replacement returns.
Statistics appendix: exactly what the dashboard provides
The main write-up above is under 400 words. This appendix documents the measures, definitions and coverage separately.
1. Overview
- Current machine count: machines operating on the final historical gaming date; 308 on June 30, 2025.
- Historical scope: January 1–June 30, 2025, covering 181 gaming days and 310 distinct machines over the period.
- Actual house win: total wagers minus game payouts.
- Actual machine contribution: house win minus supplied lease, service, power and repair costs. This is not complete business profit.
- Availability: total available machine time divided by total scheduled on-floor time.
- Replacement cohort: ten screened targets, their screening ranks and links to individual evidence.
- July allocation: costs and quantities by funded action type, total allocation and unallocated balance.
- Page summaries: total wagering, estimated downtime loss, carded wagering share and predicted July wagering.
2. Machine Summary
| Statistic or evidence | Meaning |
|---|---|
| Screening rank | Ordering of eligible, screened candidates by modeled contribution per available hour; separate from observed earnings rank. |
| Actual house win per hour | Observed house win divided by available machine-hours. |
| Actual contribution per hour | Observed house win minus supplied machine costs, divided by available hours. |
| Actual earnings gap per hour | Machine earnings rate minus its observed zone-peer rate, on dates with peer coverage. |
| Wagering versus zone peers | Actual wagers relative to the same-date peer wagering benchmark, weighted by target available hours. |
| Peer coverage | Available-hour coverage for observed earnings comparisons; the fixed audit separately reports covered-date fractions. |
| Exposure | Active dates, positive-wager dates and available operating hours. |
| Monthly persistence | Counts of months meeting the audit's demand gate, including whether weakness persists in June. Separate charts show monthly observed earnings gaps. |
| Competing explanations | Location, downtime, repair recovery, payout-anomaly and statistical-warning flags, with unavailable evidence identified. |
| Comparable-game demand | Wagering relative to same-zone, same-date peers with matching configured RTP and volatility class. |
| Machine costs | Supplied machine expenses and their per-hour equivalent. |
| Modeled reference measures | Theoretical earnings relative to peers and modeled contribution per hour, explicitly identified as estimates. |
| Replacement economics | Catalogue cash cost, break-even modeled hourly improvement and low/central/high July scenarios. These are assumptions, not measured replacement effects. |
Current screening rule: active on June 30; at least 60 active dates and 30 positive-wager dates; at least 80% peer-date coverage; actual wagering and modeled expected earnings each more than 20% below zone peers; weakness in at least four eligible months, including June. An eligible month needs 21 peer-covered dates and 14 positive-wager dates. Positive competing-explanation or statistical-warning flags exclude a machine from this screen; unavailable repair comparisons remain disclosed.
The dashboard shows the resulting cohort and sensitivity of the rule. A screening rank does not establish that purchasing or leasing a new title will produce a particular return.
3. Machine Explorer and individual machine details
- Total actual house win, total actual contribution and both measures per available hour.
- Wagered dollars, active dates, availability, manufacturer, game, zone and bank.
- Observed same-date zone-peer earnings and the machine's earnings gap.
- Low actual earnings: below-peer house win/hour, with at least 14 peer-covered dates and 80% available-hour coverage.
- Low wagering demand: among qualifying below-peer earners, wagering/hour more than 20% below peers.
- Persistent shortfall: among qualifying below-peer earners, lower observed earnings in at least three measured months and at least two-thirds of measured months. A measured month requires seven peer-covered dates.
- Low availability: among qualifying below-peer earners, more than 5% of scheduled time unavailable.
- Repair-related change: among qualifying below-peer earners, actual earnings/hour changed at least 20% around a comparable repair, using seven complete active dates on each side.
- Short-history and limited-coverage notices, separate from performance indicators.
- A floor map colored by actual house win/hour, showing machines present at the selected period's end and their recorded positions.
- Individual daily actual earnings, contribution and availability; placement history; service-ticket dates; response and repair durations; actual earnings before and after comparable repairs.
- An optional theoretical-house-win reference, excluded from Explorer indicator calculations and table ordering.
The Explorer table sorts by total actual house win, lowest first. Its observed indicators are distinct from the fixed-window Machine Summary screening rule.
4. Floor Demand
- Daily wagering per active machine-day, a rolling seven-day ratio and monthly averages.
- First-to-last selected-month change in wagering per machine-day.
- Wagering per machine-day by weekday and the busiest observed weekday.
- Event dates, event-day counts and holiday context.
- Indexed comparisons with Missouri slot wagering and Las Vegas visitor counts; first selected month equals 100.
- Recorded loyalty-card visits by visit-start month and average wagering per recorded visit, shown as indexed trends with underlying counts and dollars.
- Weekly actual house win per available hour by zone.
- Observed zone entries, entries per observed counter-hour, observed/expected counter-hours and counter coverage.
- Carded share of wagering across the property.
Traffic counts represent crossings, not unique people. Offline or missing counter observations are not treated as zero traffic. External market data describes other populations, not this casino's guests.
5. Downtime
- Recorded machine-hours unavailable.
- Lost Expected Value: modeled gross earnings foregone during recorded downtime, using matched peer activity and the machine's reference relationship to those peers.
- Low/high loss scenarios and the share of recorded downtime with usable loss estimates.
- Estimated losses by month, manufacturer, weekday and local hour.
- Fault-ticket counts and weekly counts, including zero-fault weeks in the displayed calendar range.
- Median wait from ticket opening to work start, and median repair duration from work start to machine availability.
- Shift comparisons: day 6 a.m.–2 p.m., swing 2–10 p.m., grave 10 p.m.–6 a.m., in casino local time.
- Operation-type ticket counts, percentage of tickets, direct recorded costs and median durations for repairs, maintenance, moves, installs and retirements.
- Machine-level downtime and estimated-loss rankings.
Lost Expected Value is not observed lost revenue. Its scenario ranges are not calibrated confidence intervals for total property loss, and they do not establish net loss after players switch machines.
6. Players and Compensation
- Loyalty-player wagering, payouts, signed net losses and modeled expected losses.
- Average actual net loss per recorded player-month by opening loyalty tier, age band and home region.
- Cumulative shares of signed house net win from players ordered by their period net losses, including the top-10% share.
- Whole-period and monthly shares of loyalty players ending ahead.
- Carded share of floor play: dollars wagered with a loyalty card divided by all floor wagering dollars; not the share of visitors carrying cards.
- Economic cost of redeemed complimentary player rewards, separate from their menu or face value.
- Compensation cents per $1 of actual net player loss and per $1 wagered, using ratios of rolling-window sums rather than averages of daily ratios.
- Tables showing each window's dates, number of gaming days, compensation cost, denominator, rate and availability status.
- Monthly compensation rates and active-player counts by fixed opening-tier cohort.
- Loyalty points earned, redeemed and outstanding at month end, in points rather than dollars.
- Candidate policy-change markers only where evaluated; unavailable detection is identified as such.
Coverage: player outcomes follow the selected guest filters. Daily compensation rates cover all loyalty-card players and do not follow tier, age or home-region filters. Monthly compensation and points follow the opening-tier filter, but not age or home region. Monthly measures use whole months overlapping the selected dates.
Concentration interpretation: the displayed curve uses signed net results. It can exceed 100% because players who win reduce the overall house net win. It is not a conventional concentration curve of gross positive losses.
7. Forecast
- Observed daily floor wagering alongside saved historical predictions and July predictions.
- Optional constant-training-mean baseline on the time-series chart.
- Historical daily wagering grouped by weekday, with arithmetic means.
- Weekday training totals, counts of matching gaming days and saved fitted means.
- Daily predicted wagering for July 1–30, total predicted July wagering and average predicted daily wagering.
- A visible fitting/selection/evaluation/refitting timeline.
- Expandable validation tables: model and baseline mean absolute error, scored dates and day counts, fit windows, prediction-freeze timestamps and underlying daily actual/predicted values.
Current calculation: each July date receives its weekday's January–June average wagering, rounded to cents. The current weekday-average model does not apply holiday or event adjustments. July values are predictions of wagering volume, not house win, profit or observed July activity.
8. July Action Plan
| Proposed action | Units | Cash allocation |
|---|---|---|
| Leased replacements for screened machines | 10 | $33,800 |
| Inspections: ten replacement prechecks plus one payout lead | 11 | $13,200 |
| Preventive manufacturer sweeps | 3 | $27,000 |
| Back Forty signage | 1 | $7,500 |
| Expanded guest survey | 1 | $3,500 |
| July 18–20 promotion weekend | 1 | $15,000 |
| Total | $100,000 |
The page supplies 27 target-specific proposal lines across six action types, including quantities, targets, activation dates, lead times, benefit days, catalogue shutdowns and cash costs. Financial actions show explicit low/central/high and half-effect net scenarios after proposal costs. Each proposal includes supporting evidence, assumptions, controls, measurement criteria and limitations.
Inspection and survey benefits are unpriced information outcomes, not zero benefits. Overlapping interventions prevent treating all scenario effects as independent or claiming a measured total portfolio return. The proposed actions have not been executed.
Core statistical definitions
| Measure | Calculation |
|---|---|
| Actual house win | Wagered dollars − game payouts. |
| Actual machine contribution | Actual house win − supplied machine costs. |
| Observed hold | Total actual house win ÷ total wagers. |
| Availability | Total available seconds ÷ total scheduled on-floor seconds. |
| Actual earnings per available hour | Total actual house win ÷ (total available seconds / 3,600). |
| Player net result | Payouts − wagers; positive means the player finished ahead. |
| Actual player net loss | Wagers − payouts; can be negative. |
| Theoretical house win | Sum of wagers × (1 − effective configured RTP); an expected-value calculation, not actual income. |
| Compensation cents per $1 lost | 100 × economic reward cost ÷ signed actual player net loss; unavailable for nonpositive loss totals. |
| Compensation cents per $1 wagered | 100 × economic reward cost ÷ recorded loyalty wagering; unavailable when the denominator is nonpositive. |
| Mean absolute error | Average absolute difference between predicted and observed daily wagering. |
| Net action scenario | Assumed incremental benefit, less action downtime opportunity cost and proposal cash costs, following the configured cost conventions. |
Rates are calculated from sums of their underlying components. Gaming dates follow the casino's 6 a.m.–6 a.m. boundary, with scheduled durations used for daylight-saving and partial-installation exposure.
Statistical methods behind the evidence
- Approximate normal-reference payout-residual tests using game-specific outcome variance and squared-bet totals.
- Benjamini–Hochberg adjustment within declared eligible-machine testing families.
- Seeded 10,000-replicate, seven-day block-bootstrap sensitivity intervals for payout residual divided by wagering, within placement/configuration episodes.
- Exposure, peer-coverage, residual-dependence, concentrated-exposure and method-disagreement diagnostics.
- Pseudo-outage validation of the peer-based downtime estimator.
- Time-based forecast selection and evaluation, followed by a final historical refit.
- Explicit action sensitivity scenarios, including half-effect scenarios; these are not statistical confidence intervals.
These methods support investigation and uncertainty assessment. Statistical flags, theoretical earnings and descriptive peer gaps do not establish causation, wrongdoing or guaranteed replacement returns.
Data and implementation scope
- The casino, guests and operating records are fictional and synthetic.
- Las Vegas visitation and Missouri gaming data provide separate real-world context.
- The published database contains 14 marts, including 55,092 active machine-days and 1,321,908 machine-hour records.
- Filtering, drill-down, accessible data tables and machine links connect overview figures to underlying records.
AI-use disclosure
AI assistance contributed to dashboard revisions, analytical and proposal-generation code, debugging, testing workflows and documentation. Calculations use the supplied datasets; intervention effects are explicitly identified as assumptions rather than measured outcomes.
