-
-
Hero
-

Disparity Charts
-
US Map
-
Budget Allocator
-
Navigator

Inspiration
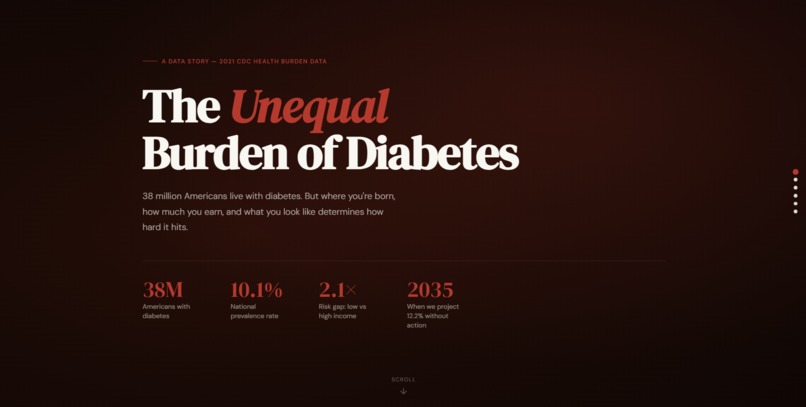
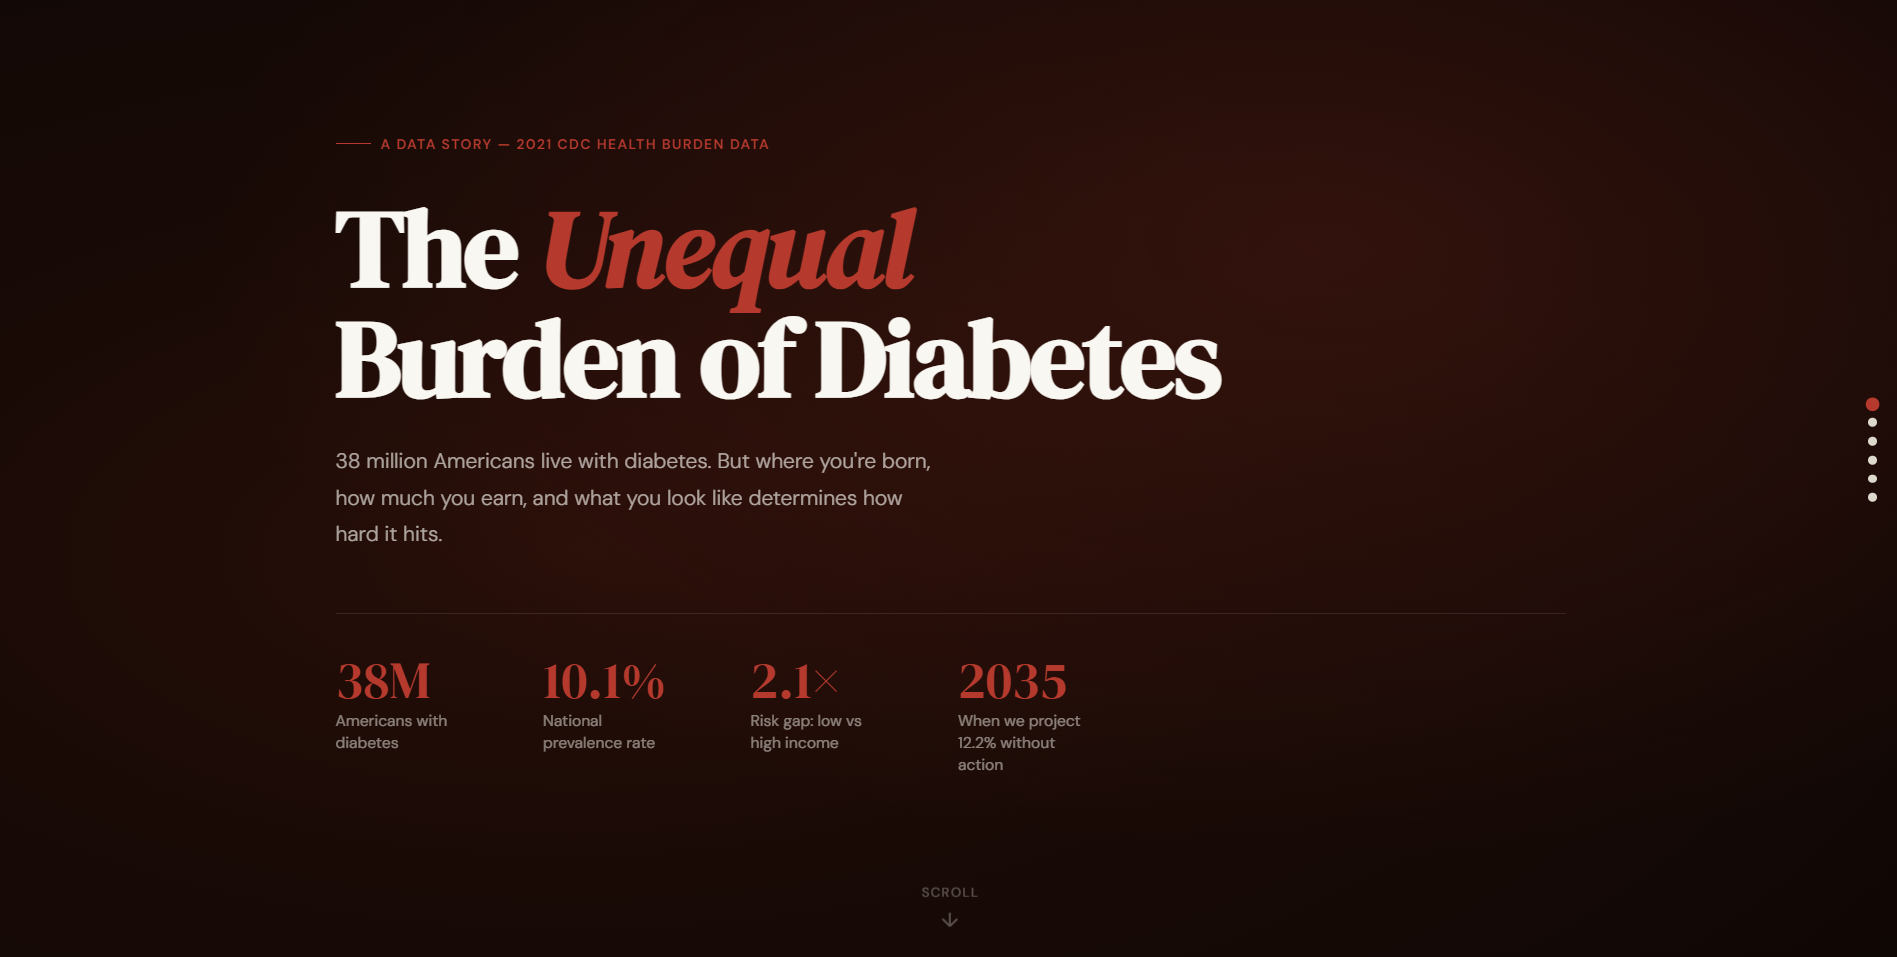
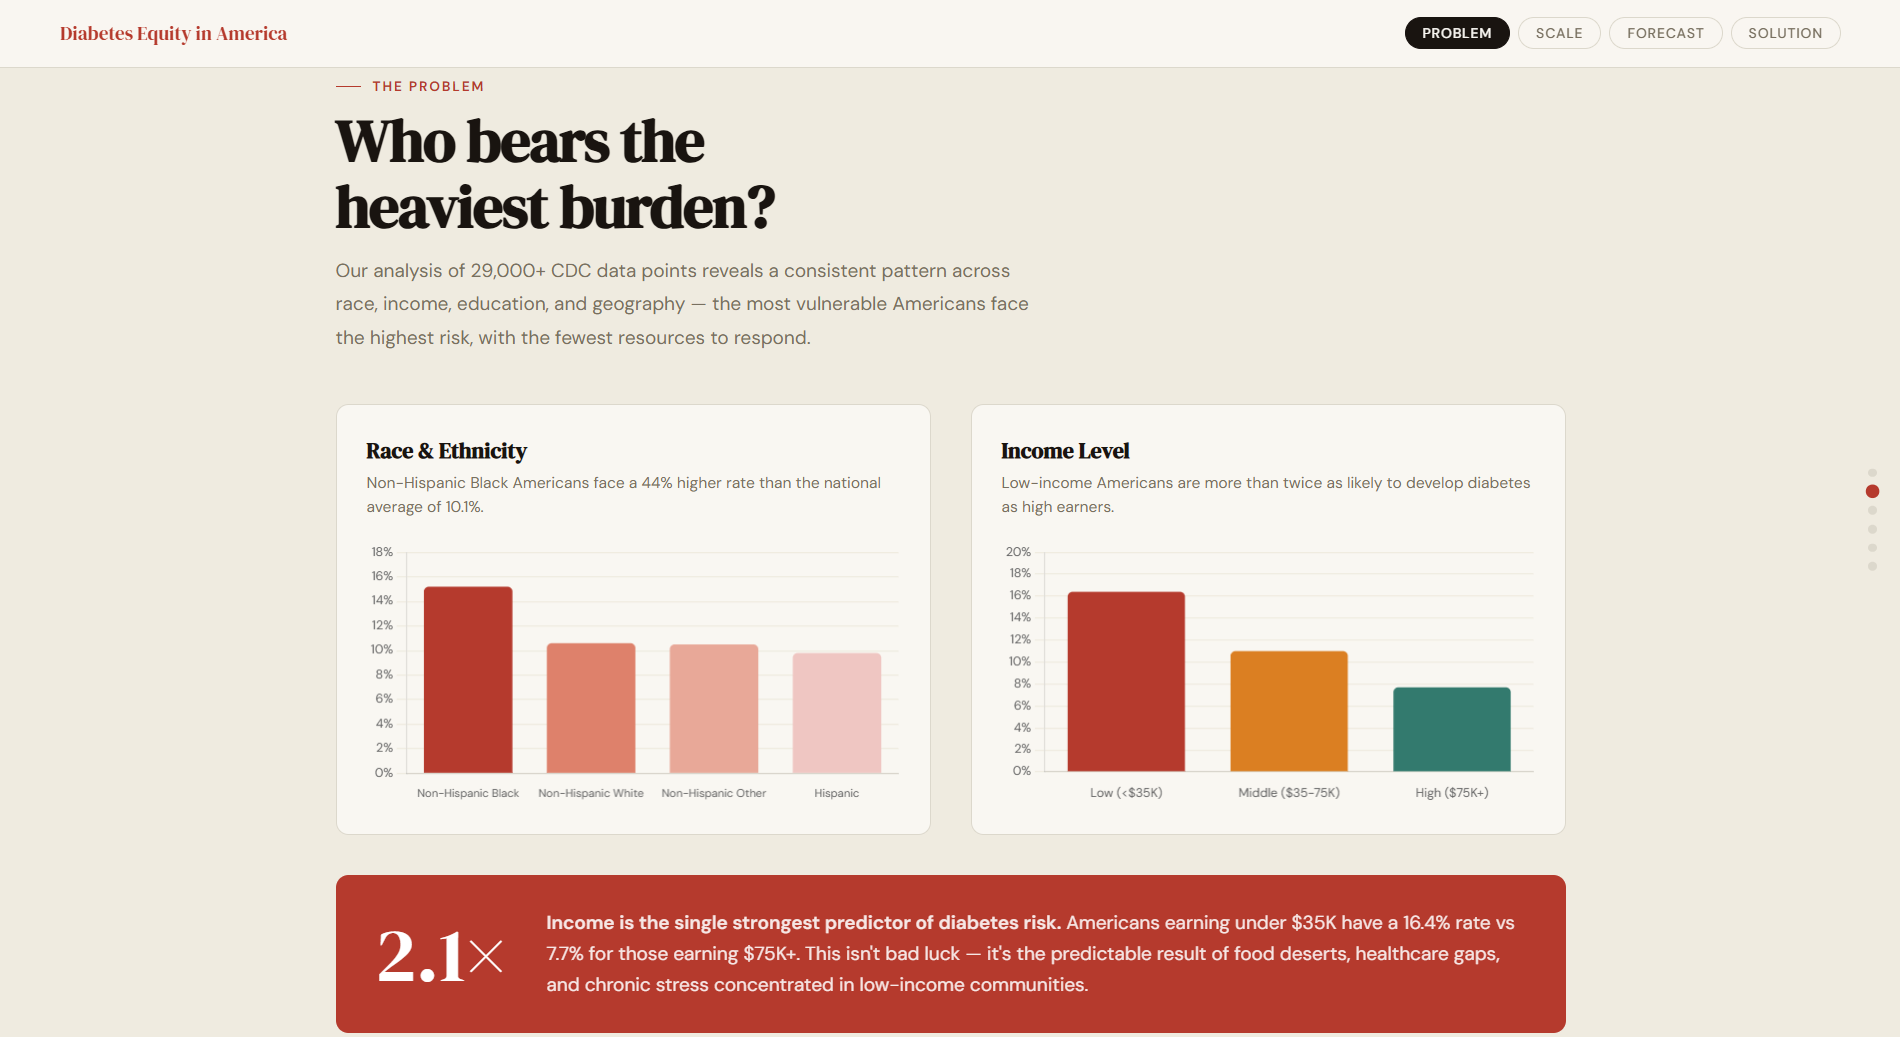
One in ten Americans has diabetes — but the data tells a more troubling story. Low-income Americans are 2.1× more likely to develop diabetes than high earners. Non-Hispanic Black Americans face a 44% higher rate than the national average. Rural communities are 28% more at risk than urban ones. The disease doesn't distribute randomly. It follows the fault lines of inequality. We wanted to turn that pattern into action.
What We Built
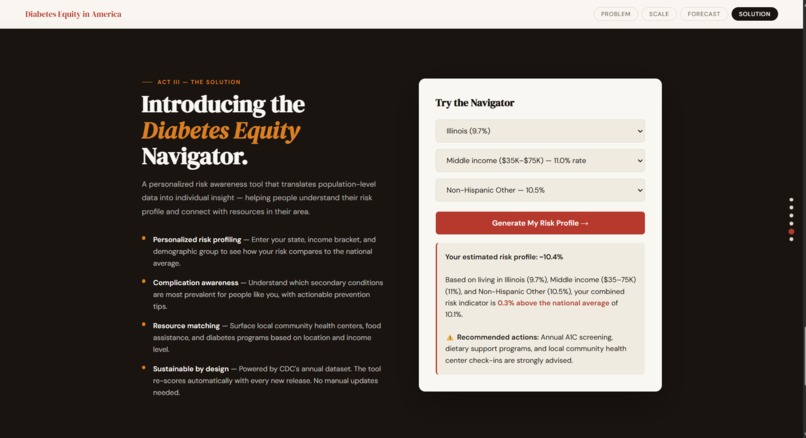
The Diabetes Equity Navigator — a fully interactive web dashboard that:
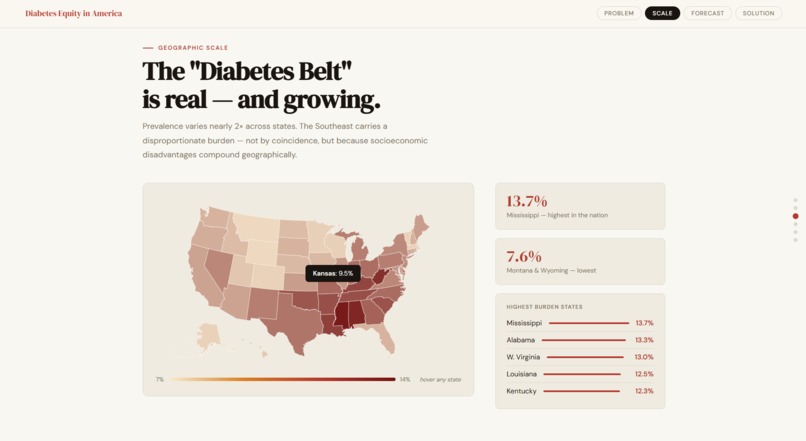
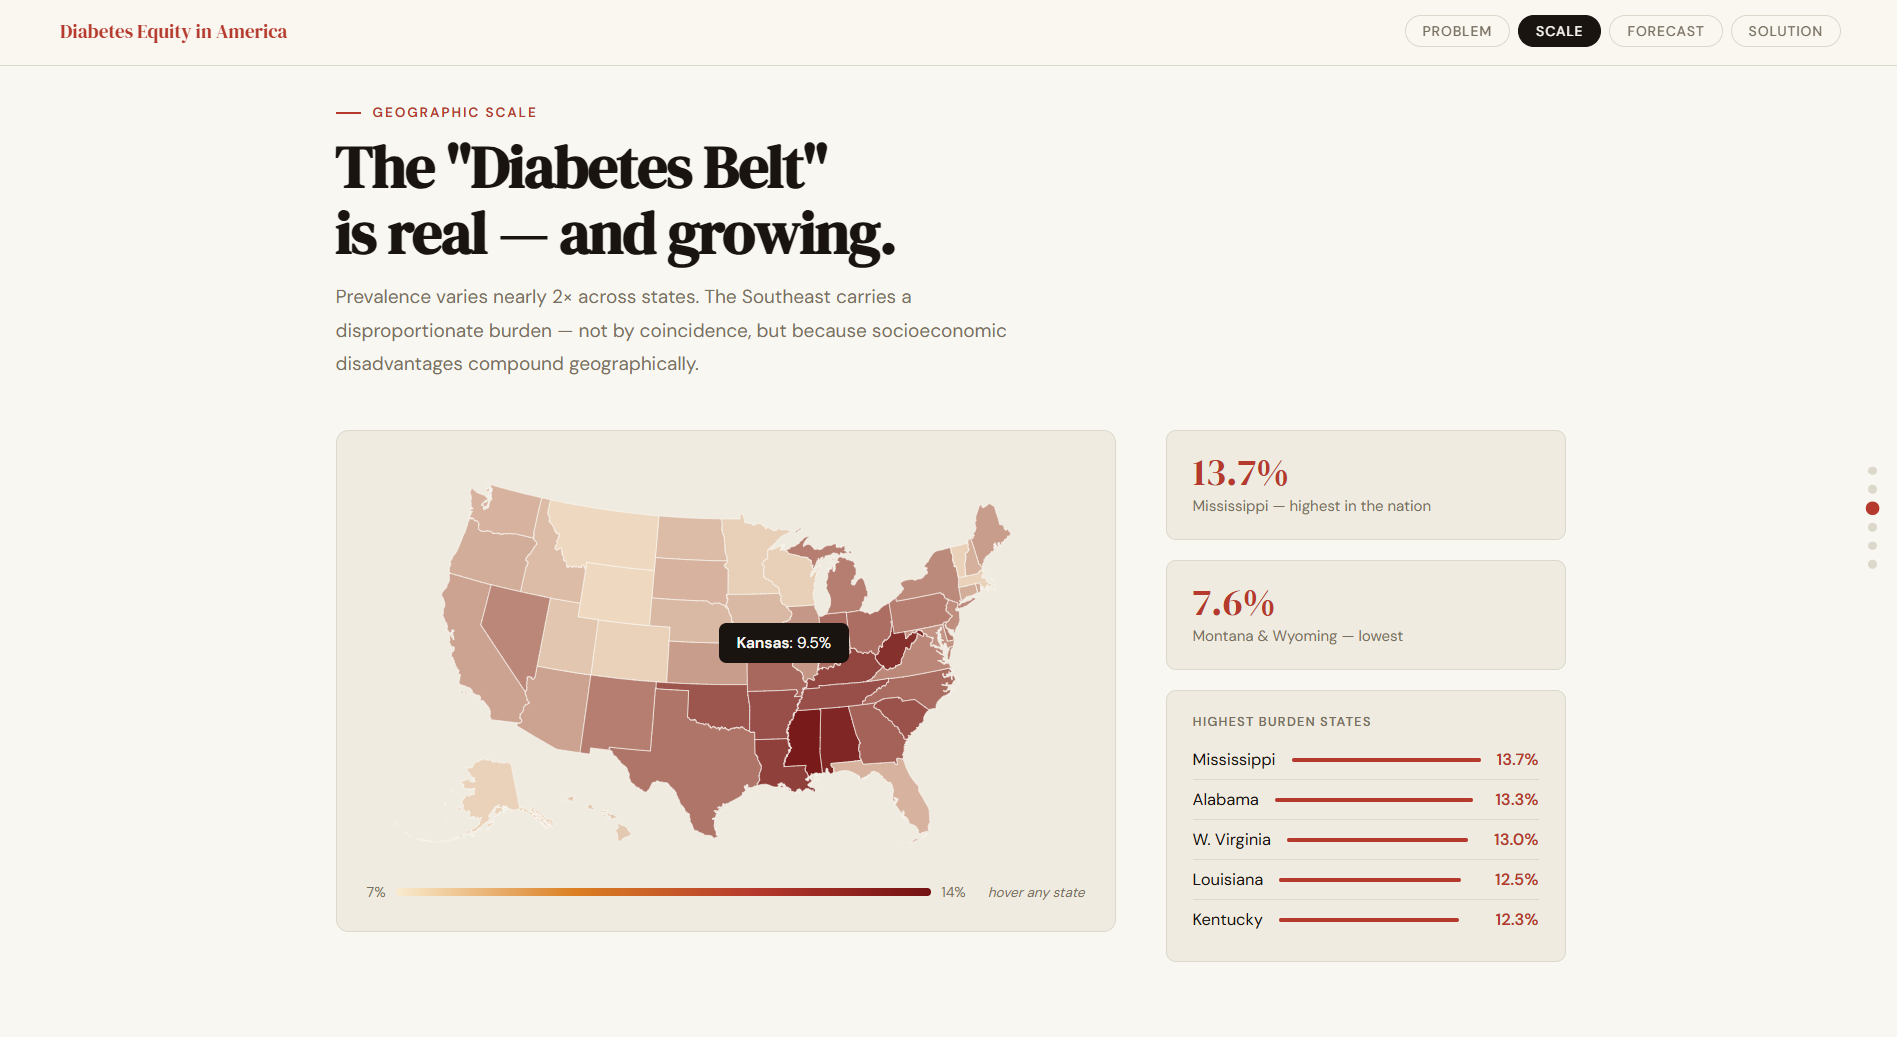
- Maps diabetes prevalence across all 50 states with a live choropleth
- Reveals disparities by race, income, education, and geography
- Models national prevalence trends to 2035 using OLS regression (R²=0.97)
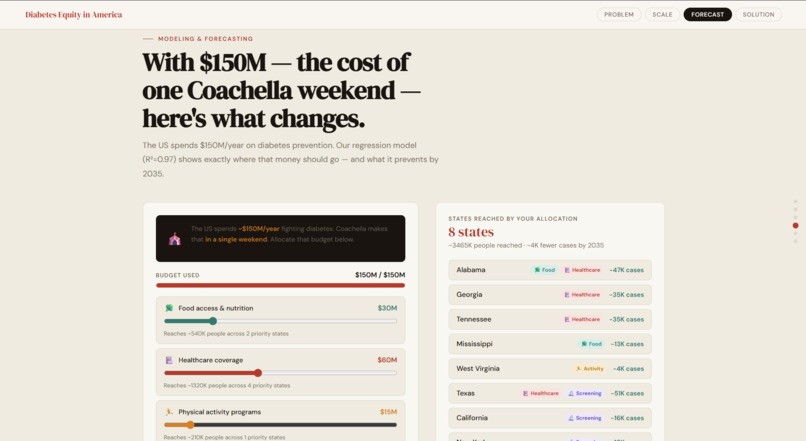
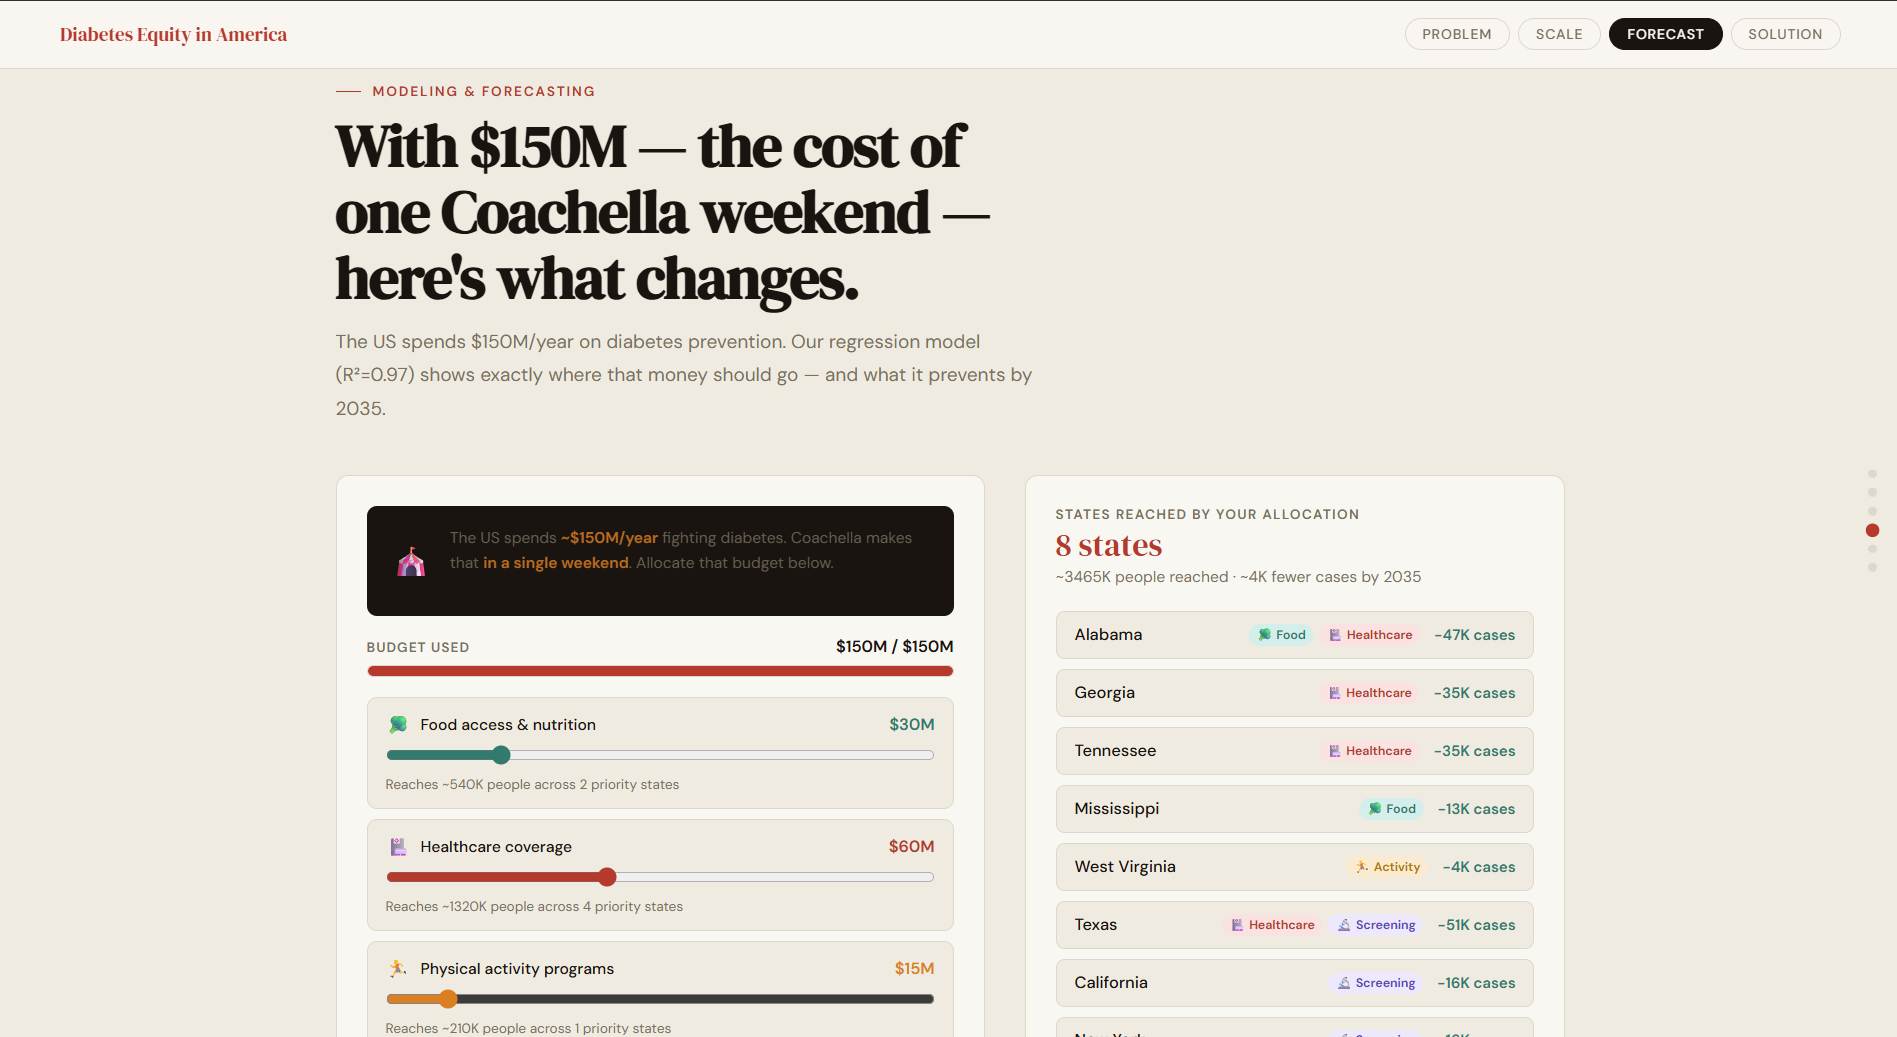
- Simulates how a $150M federal budget — the same cost as one Coachella weekend — could be allocated to bend that curve
- Scores every state on an equity-weighted priority index to guide funding decisions
How We Built It
Data layer: CDC Diabetes State Burden Toolkit (29,000+ rows, 17 health indicators, 51 states). Uploaded to Google BigQuery and validated with 16 SQL queries — confirming 97.8% data completeness and zero nulls in critical fields.
Modeling: OLS linear regression on CDC BRFSS historical data (2000–2021) projects national prevalence to 2035. Each state receives an equity priority score weighted across prevalence (40%), kidney disease (25%), hypertension (20%), and amputation rates (15%).
Visualization: D3.js for the interactive US map, Chart.js for disparity charts, and vanilla JavaScript for the budget allocator and risk navigator — all in a single HTML file hosted on GitHub Pages.
Challenges
The dataset only contains 2021 data at the national level for some indicators, which limited our regression to external CDC BRFSS historical data. We also had to handle capitalization inconsistencies in the income stratification fields (e.g., "Low Income" vs "Low income") — a real-world data quality issue we addressed directly in SQL.
What We Learned
Good data storytelling isn't just about charts — it's about making the "so what" undeniable. The Coachella comparison ($150M = one festival weekend = the entire US diabetes prevention budget) was more powerful than any statistic alone.

Log in or sign up for Devpost to join the conversation.