Inspiration
I have never waited on a tribunal. No hearing, no appeal, nothing that put me on the other side of one of these numbers. I want to say that first, because the honest version of how this started is that I was reading a table.
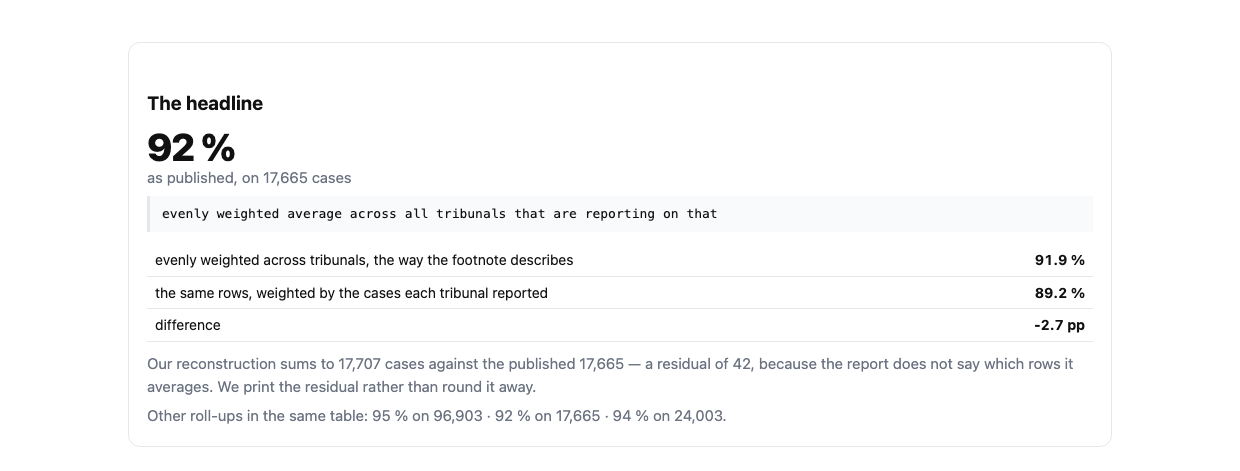
Tribunals Ontario publishes an annual report, and in it there is a figure: 92 % of the time, it met its scheduling standard. That reads like a system working. I had no reason to doubt it and I still do not. It is correctly computed.
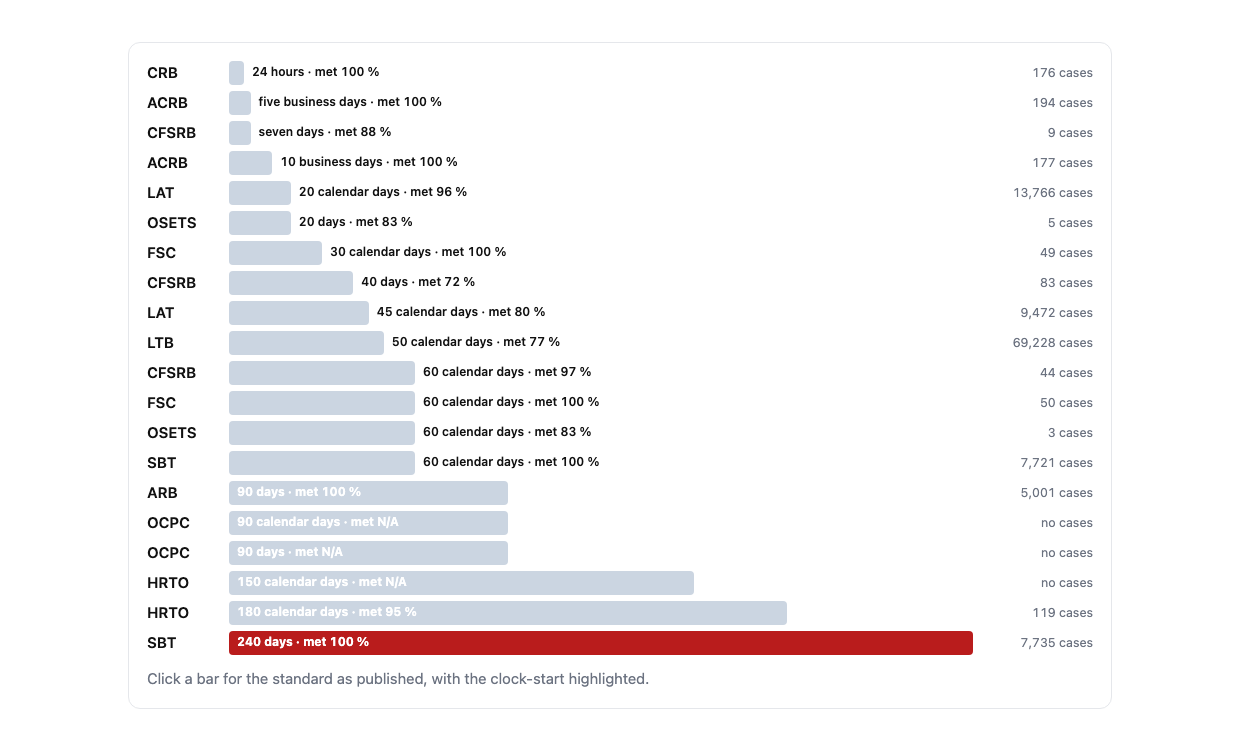
What made me keep going was sorting. The report lists each tribunal's standard in the order the tribunals happen to appear. I sorted them by how long they permit instead, which took about a minute, and the top and the bottom of that list ended up next to each other on my screen. The Custody Review Board promises a first telephone review within 24 hours. The Social Benefits Tribunal promises a first hearing within 240 days. Both reported meeting their standard 100 % of the time.
Nothing was hidden. Both rows were already in the report, a few pages apart, and the arithmetic between them is 240. Putting them side by side is the whole trick, and it took a sort.
Then it got worse in a way I did not expect. I went looking for what the 92 % averages, found the footnote saying it is weighted evenly across tribunals rather than across cases, and recomputed it that way. The Landlord and Tenant Board reports 77 % on 69,228 cases in the same document, which is nearly four times the roll-up's entire denominator, and it does not report that KPI at all. So the headline average is an average with the busiest place left out, by a rule the report states plainly and I had simply never read.
The thing I keep coming back to is that none of this required getting anything out of anyone. It required reading the footnote and doing the sort.
What it does
It takes a number Tribunals Ontario publishes about itself and shows what the number leaves out.
The tribunal system reports that it met its scheduling standard 92 % of the time. The page puts that figure next to the standards it is measuring compliance against, sorted by how long each one permits. Two tribunals both report 100 %: one promises a first review within 24 hours on 176 cases, the other a first hearing within 240 days on 7,735 cases. Same percentage, 240× the permitted time.
It then does three things to the published roll-up:
- Recomputes it the way the report's own footnote describes — evenly across tribunals, not across cases. Evenly: 91.9 %. Weighted by the cases each tribunal reported: 89.2 %. A 2.7 point gap, entirely from method.
- Prints the reconstruction residual. Our component rows sum to 17,707 cases against the published 17,665. A +42 residual, because the report does not name which rows it averages. We print it rather than round it away.
- Separates "0 % of 0 cases" from "N/A". 1 row reports a percentage on no cases; 8 more carry a target with the result printed as N/A or TBD. Those are different failures and the page lists them apart.
And it puts the 2012 and 2013 versions of the same standards beside today's.
We uncovered nothing
Every number is published by Tribunals Ontario in its own annual report. The averaging method is their own footnote in the same table. No number here is ours. The arrangement is.
That sentence is load-bearing enough that a check enforces it: src/check.py fails if the
README stops saying it, and src/sabotage.py deletes it on purpose to prove the check works.
Why the arrangement is the finding
A compliance percentage answers "was the target met." It cannot answer "how long did anyone wait," and it cannot be compared across tribunals whose targets differ by two orders of magnitude. Across 20 first-event standards the report uses 15 different phrasings for when the clock starts — so two identical percentages may be counting from different days.
The Landlord and Tenant Board reports 77 % on 69,228 cases in the same report, nearly four times the roll-up's entire denominator, and does not report the roll-up's KPI at all.
What used to be permitted
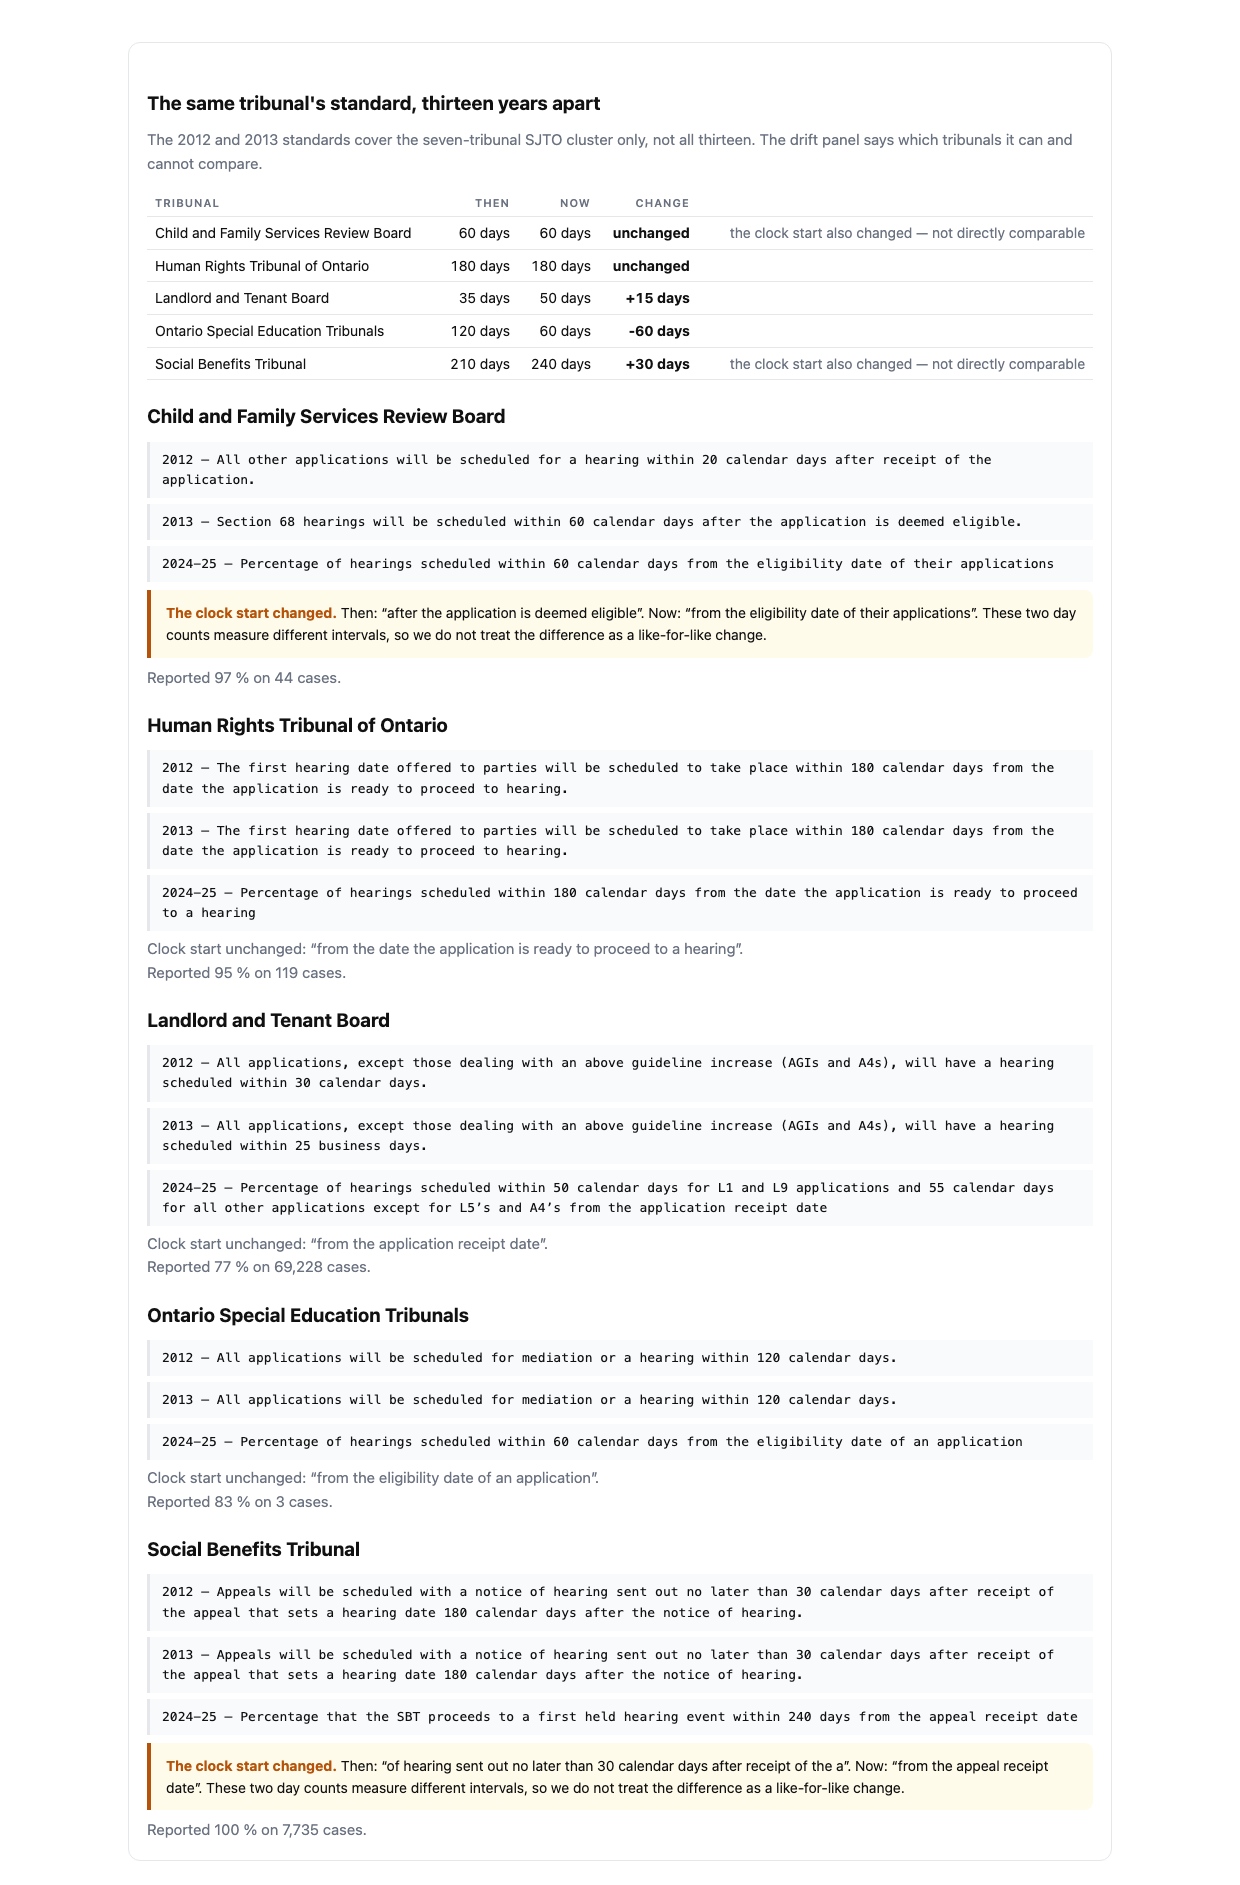
The 2012 and 2013 service standards are still online. Comparing the longest first-hearing standard for each tribunal:
| tribunal | 2012 | 2013 | 2024-25 | change |
|---|---|---|---|---|
| CFSRB | 20 | 60 | 60 | unchanged (clock start also changed) |
| HRTO | 180 | 180 | 180 | unchanged |
| LTB | 30 | 35 | 50 | +15 days |
| OSETS | 120 | 120 | 60 | -60 days |
| SBT | 210 | 210 | 240 | +30 days (clock start also changed) |
They did not all move the same way. The Ontario Special Education Tribunals halved theirs. If every target had grown, that would be one policy change; moving separately and in both directions is a set of separate decisions. Where the clock-start wording also changed, the page refuses to treat the day counts as like-for-like and says so.
How I built it
Pure Python, no third-party packages. The reports are accessible HTML tables, so rows are bound
by <th id> / <td headers> rather than by column position — position-based parsing breaks
silently when a column is inserted, and header binding fails loudly instead.
src/sources.py          where every file came from, with retrieval dates
src/parse_reports.py    annual report tables -> kpi.json
src/parse_standards.py  2012/2013/current service standards -> standards.json
src/analyze.py          the ladder, the roll-up recomputation, the drift table
src/export_web.py       injects data into web/page.html -> web/index.html
src/check.py            34 checks, at a denominator that cannot shrink
src/sabotage.py         breaks 29 things on purpose; do the checks notice?
The page opens from the filesystem. No server, no build step, no account.
What I learned
A passing check count is not a quality signal. Three times in this project a check verified only that the output agreed with itself. The worst: the page's roll-up gap was computed by subtracting two already-rounded numbers, and the check compared that to the report's own rounded difference. Both wrong the same way, both green. The fix was to make the check recompute one side from the source data and to ban rounded-value arithmetic in the template.
An inclusion filter deletes counterexamples silently. A regex that required the words
hearings scheduled to be adjacent dropped the Ontario Special Education Tribunals entirely —
their standard says "scheduled for mediation or a hearing." OSETS is the only tribunal whose
target got shorter. The filter was quietly deleting the one row that contradicted the easy
story. Now every filter is paired with a coverage guard whose baseline comes from an
independent exclusion rule, and nan in a comparison table is a hard failure.
The same filter deleted the same counterexample three times. A regex that required the
words hearings scheduled to be adjacent dropped the Ontario Special Education Tribunals, whose
standard says "scheduled for mediation or a hearing." OSETS is the only tribunal whose target
got shorter, so the filter was quietly deleting the one row that contradicted the easy story.
I fixed it, and it happened again: the page generator kept its own copy of the rule and only the
analysis got the fix, so OSETS vanished from the chart while staying in the terminal. I fixed
that by moving the rule into one module, and then a coverage guard found a third omission —
the Licence Appeal Tribunal's 20-day standard on 13,766 cases and the Assessment Review
Board's entirely. Both had phrasings the allow-list never anticipated.
So the rule is now written backwards. Instead of listing the phrasings that qualify, it admits
everything with a deadline to a hearing-like event and names the two things that disqualify:
a clock that starts after a hearing concludes, and a whole-case lifecycle. New phrasings
default to included. Two borderline rows are listed in src/rules.py with the reason they
are kept rather than dropped quietly.
N/A is not zero. (None or 0) == 0 in Python, so eight tribunals that declined to report
were being counted as reporting zero. The page said "9 rows on zero cases" when exactly 1
was a true zero. That is the same conflation this project exists to point out.
What this does not claim
- Not that anyone is misreporting. The 92 % is correctly computed by the method its own footnote describes. The claim is about what a percentage can carry, not about honesty.
- Not that longer targets are wrong. A 240-day standard for a benefits appeal may be entirely appropriate. The point is that 100 % against it and 100 % against 24 hours are not the same achievement, and the roll-up treats them as one.
- Not a wait-time measurement. We have compliance rates, not case durations. Nothing here says how long anyone actually waited.
- The reconstruction is incomplete by +42 cases. We do not know which rows the published roll-up averages. We print the residual instead of hiding it.
AI and tool disclosure
LexHack requires this, and the full account is in submission/ai-disclosure.md in the
repository. The short version: most of the code and most of the prose here were drafted by a
model working under direction, including the parsers, the analysis, the check suite, the
sabotage suite, and the Inspiration section above. The author supplied the direction, the
decisions, and the one fact the Inspiration rests on.
No figure was produced by a model. Every number comes from Tribunals Ontario's published
documents through the parsers, and a check re-derives it from analyze.py's output. The
disclosure file also records where that binding was incomplete and what a pre-submission review
caught because of it.
Built with
Python 3 (standard library only). No frameworks, no packages, no API keys, no accounts.
Data: Tribunals Ontario annual reports and service standards, retrieved on the dates recorded
in src/sources.py.

Log in or sign up for Devpost to join the conversation.