-

CrowdFlow predictions
Inspiration
We initially got the idea from standing outside after a popular event, watching surge be really high but having to wait 20 minutes to get a ride home. It seemed like this was a predictable event, and the presence of the surge pricing made it seem like a sweet profit opportunity for drivers. We then realized we could both help drivers make money and also help riders get the rides they want.
What it does
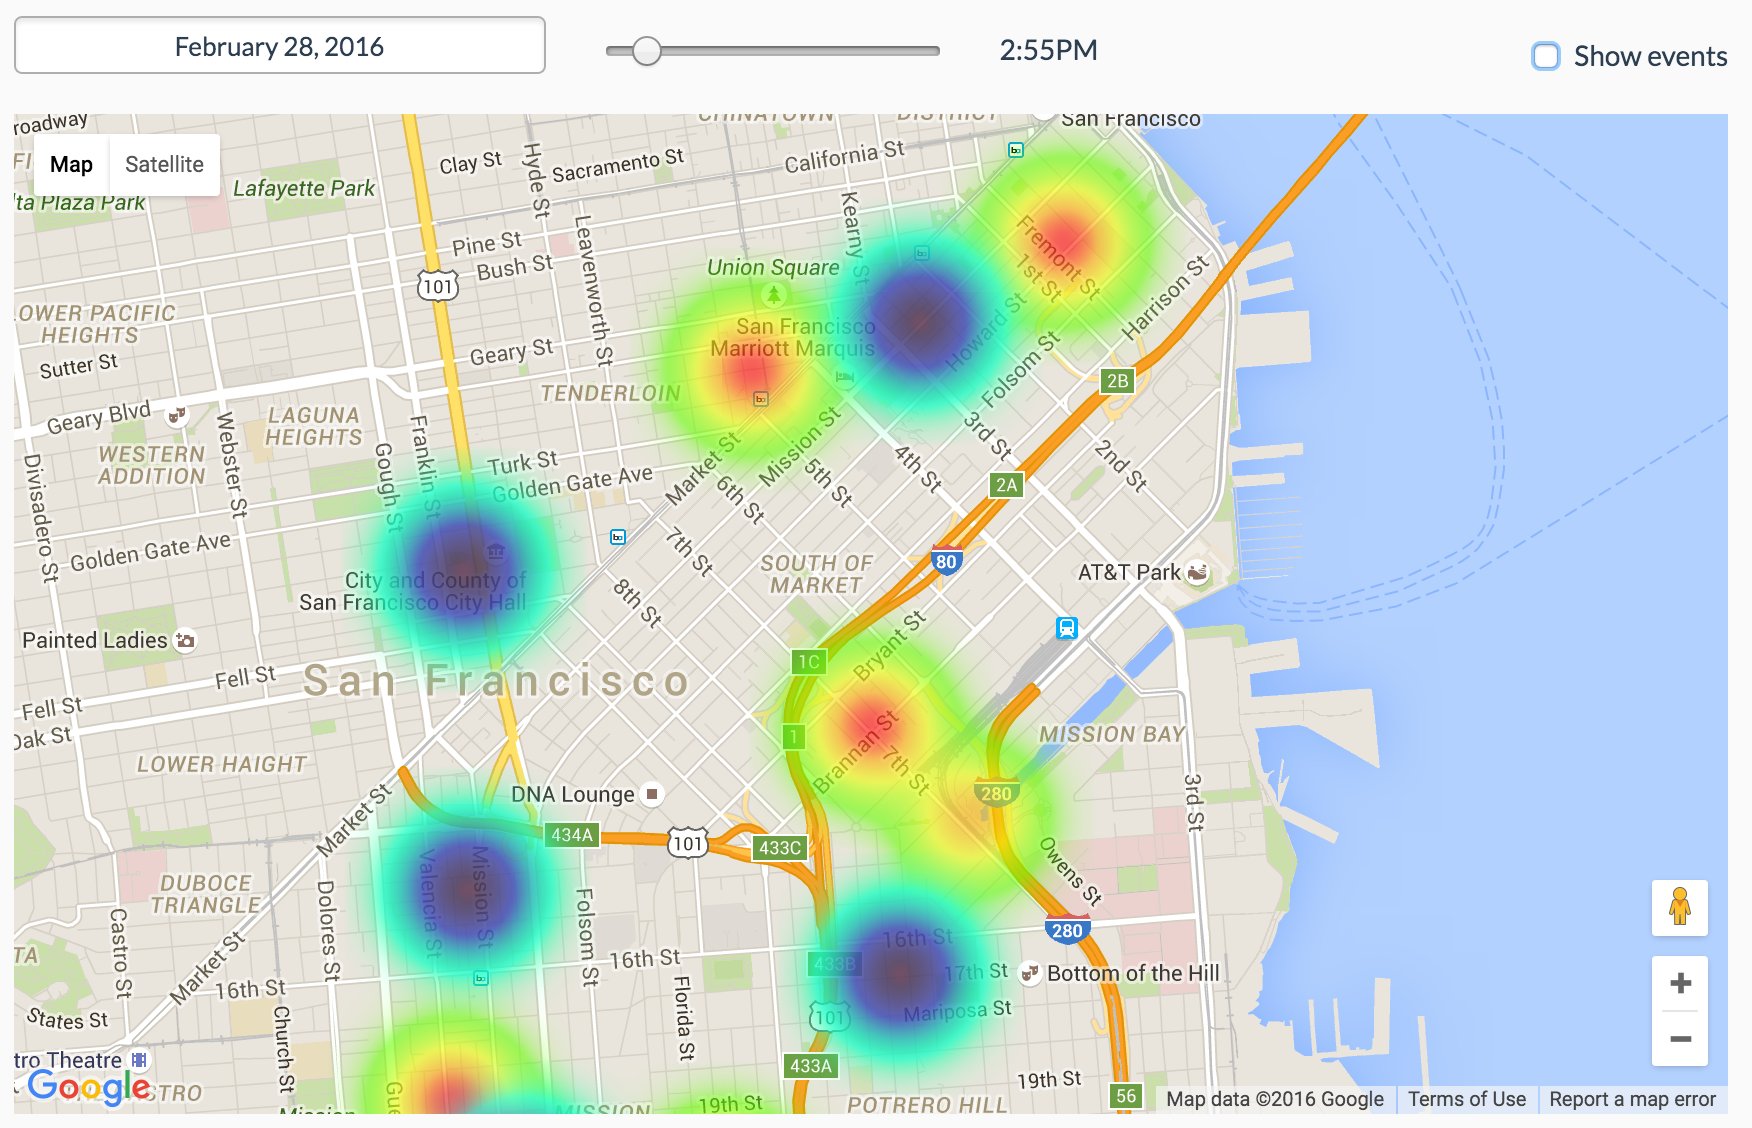
The Surge Club pulls event data from various sources, combining it with other apis (currently only weather prediction data), and uses that to predict likely surge spots at relatively exact points in time.
How we built it
We built a data science backend in Python that aggregates and transforms API data in order to form our basis for data modeling. All of that data goes into MySQL for the time-being to make merging of data from disparate data sets a little easier to start modeling. We then built an algorithm that attempts to properly weight the influence of various factors (data source "popularity" ratings, event capacity, weather, etc) to generate a surge rating. This surge prediction is then fed into Firebase for propagation to clients. The website and app are built in react/react-native and display a time-based "heat map" showing our prediction for surge hot-spots as well as places to avoid based on predicted high driver-to-rider ratios. We also began trying to test our hypotheses by monitoring Uber surge and Lyft primetime numbers before and after targeted events. We also used Sinch sms-notification to enable timely messaging for drivers, to get updates on the predicted surge spots an hour in advance.
Challenges we ran into
Wrangling data is always hard, as well as merging disparate data sources. We didn't realize we'd set out to build a big data platform in a weekend. We wanted to get a data model that automatically learned from testing predictions against real-world outcomes, but building the data foundation took too long to get to that part. It turned out that getting reliable end times for events was very hard, and we were able to do some guessing, but that's room for improvement in that area. Also, after we came up with the hot-and-cold map concept, we realized that not charting libraries did what we were looking for, meaning we had to take some shortcuts with the display logic.
Accomplishments that we're proud of
We iterated pretty well and had some good insights (like the idea of anti-surge in an area at the start of an event based on drop-offs). Through our limited testing ability so far, we've seen some promising correlations, which is great. Additionally, we've pitched our idea to several Uber drivers this weekend and they've given us their emails for notification when the app launches, with all of them interested in different ways about the product.
What we learned
We got to further hone our data harvesting skills, as well as try out react-native.
What's next for The Surge Club
We have a lot of other great ideas for influences/data sources, such as monitoring Twitter at target lat/longs to learn event-relevant hashtags and then monitor the location of those hashtags as triggers. We could also watch the scores of sports games to detect early-endings, as well as Caltrain/transit breakdowns for sudden spikes that Uber/Lyft miss. The other big thing would be setting up the ML infrastructure to begin testing predictions and refining our input weights in the prediction algorithm. It could help us start doing a better job of estimating end times, which would then feed very well into our prediction engine.


Log in or sign up for Devpost to join the conversation.