-
-
-
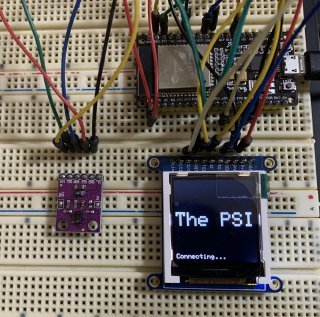
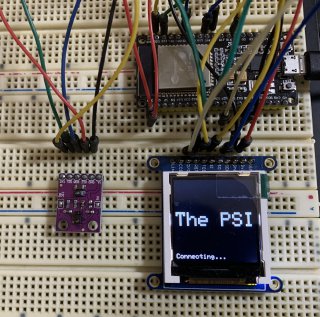
Initialisation
-
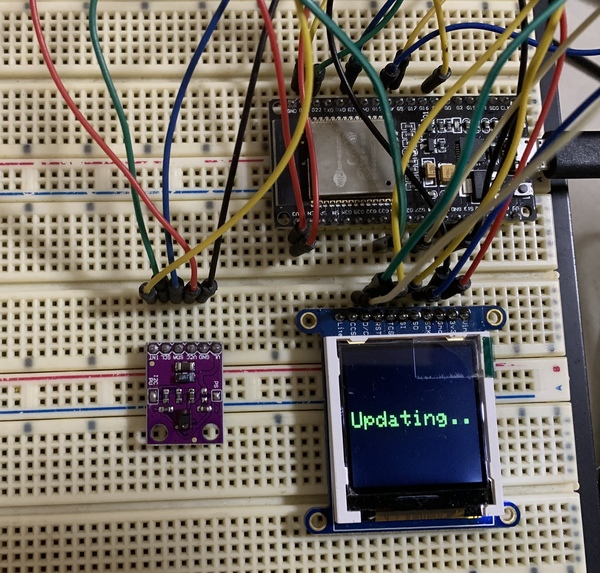
Getting & parsing the JSON data
-
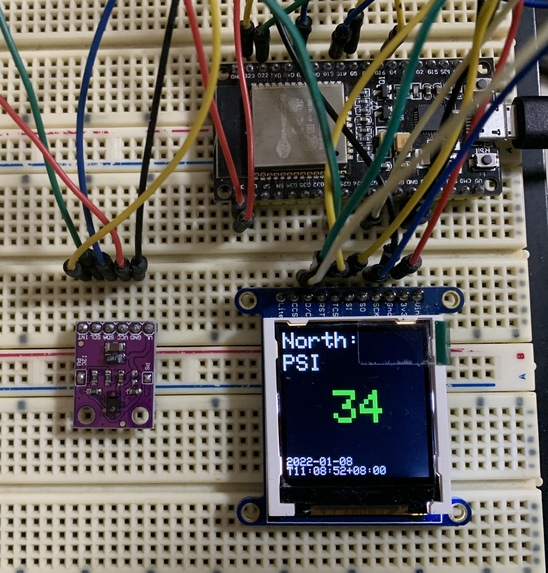
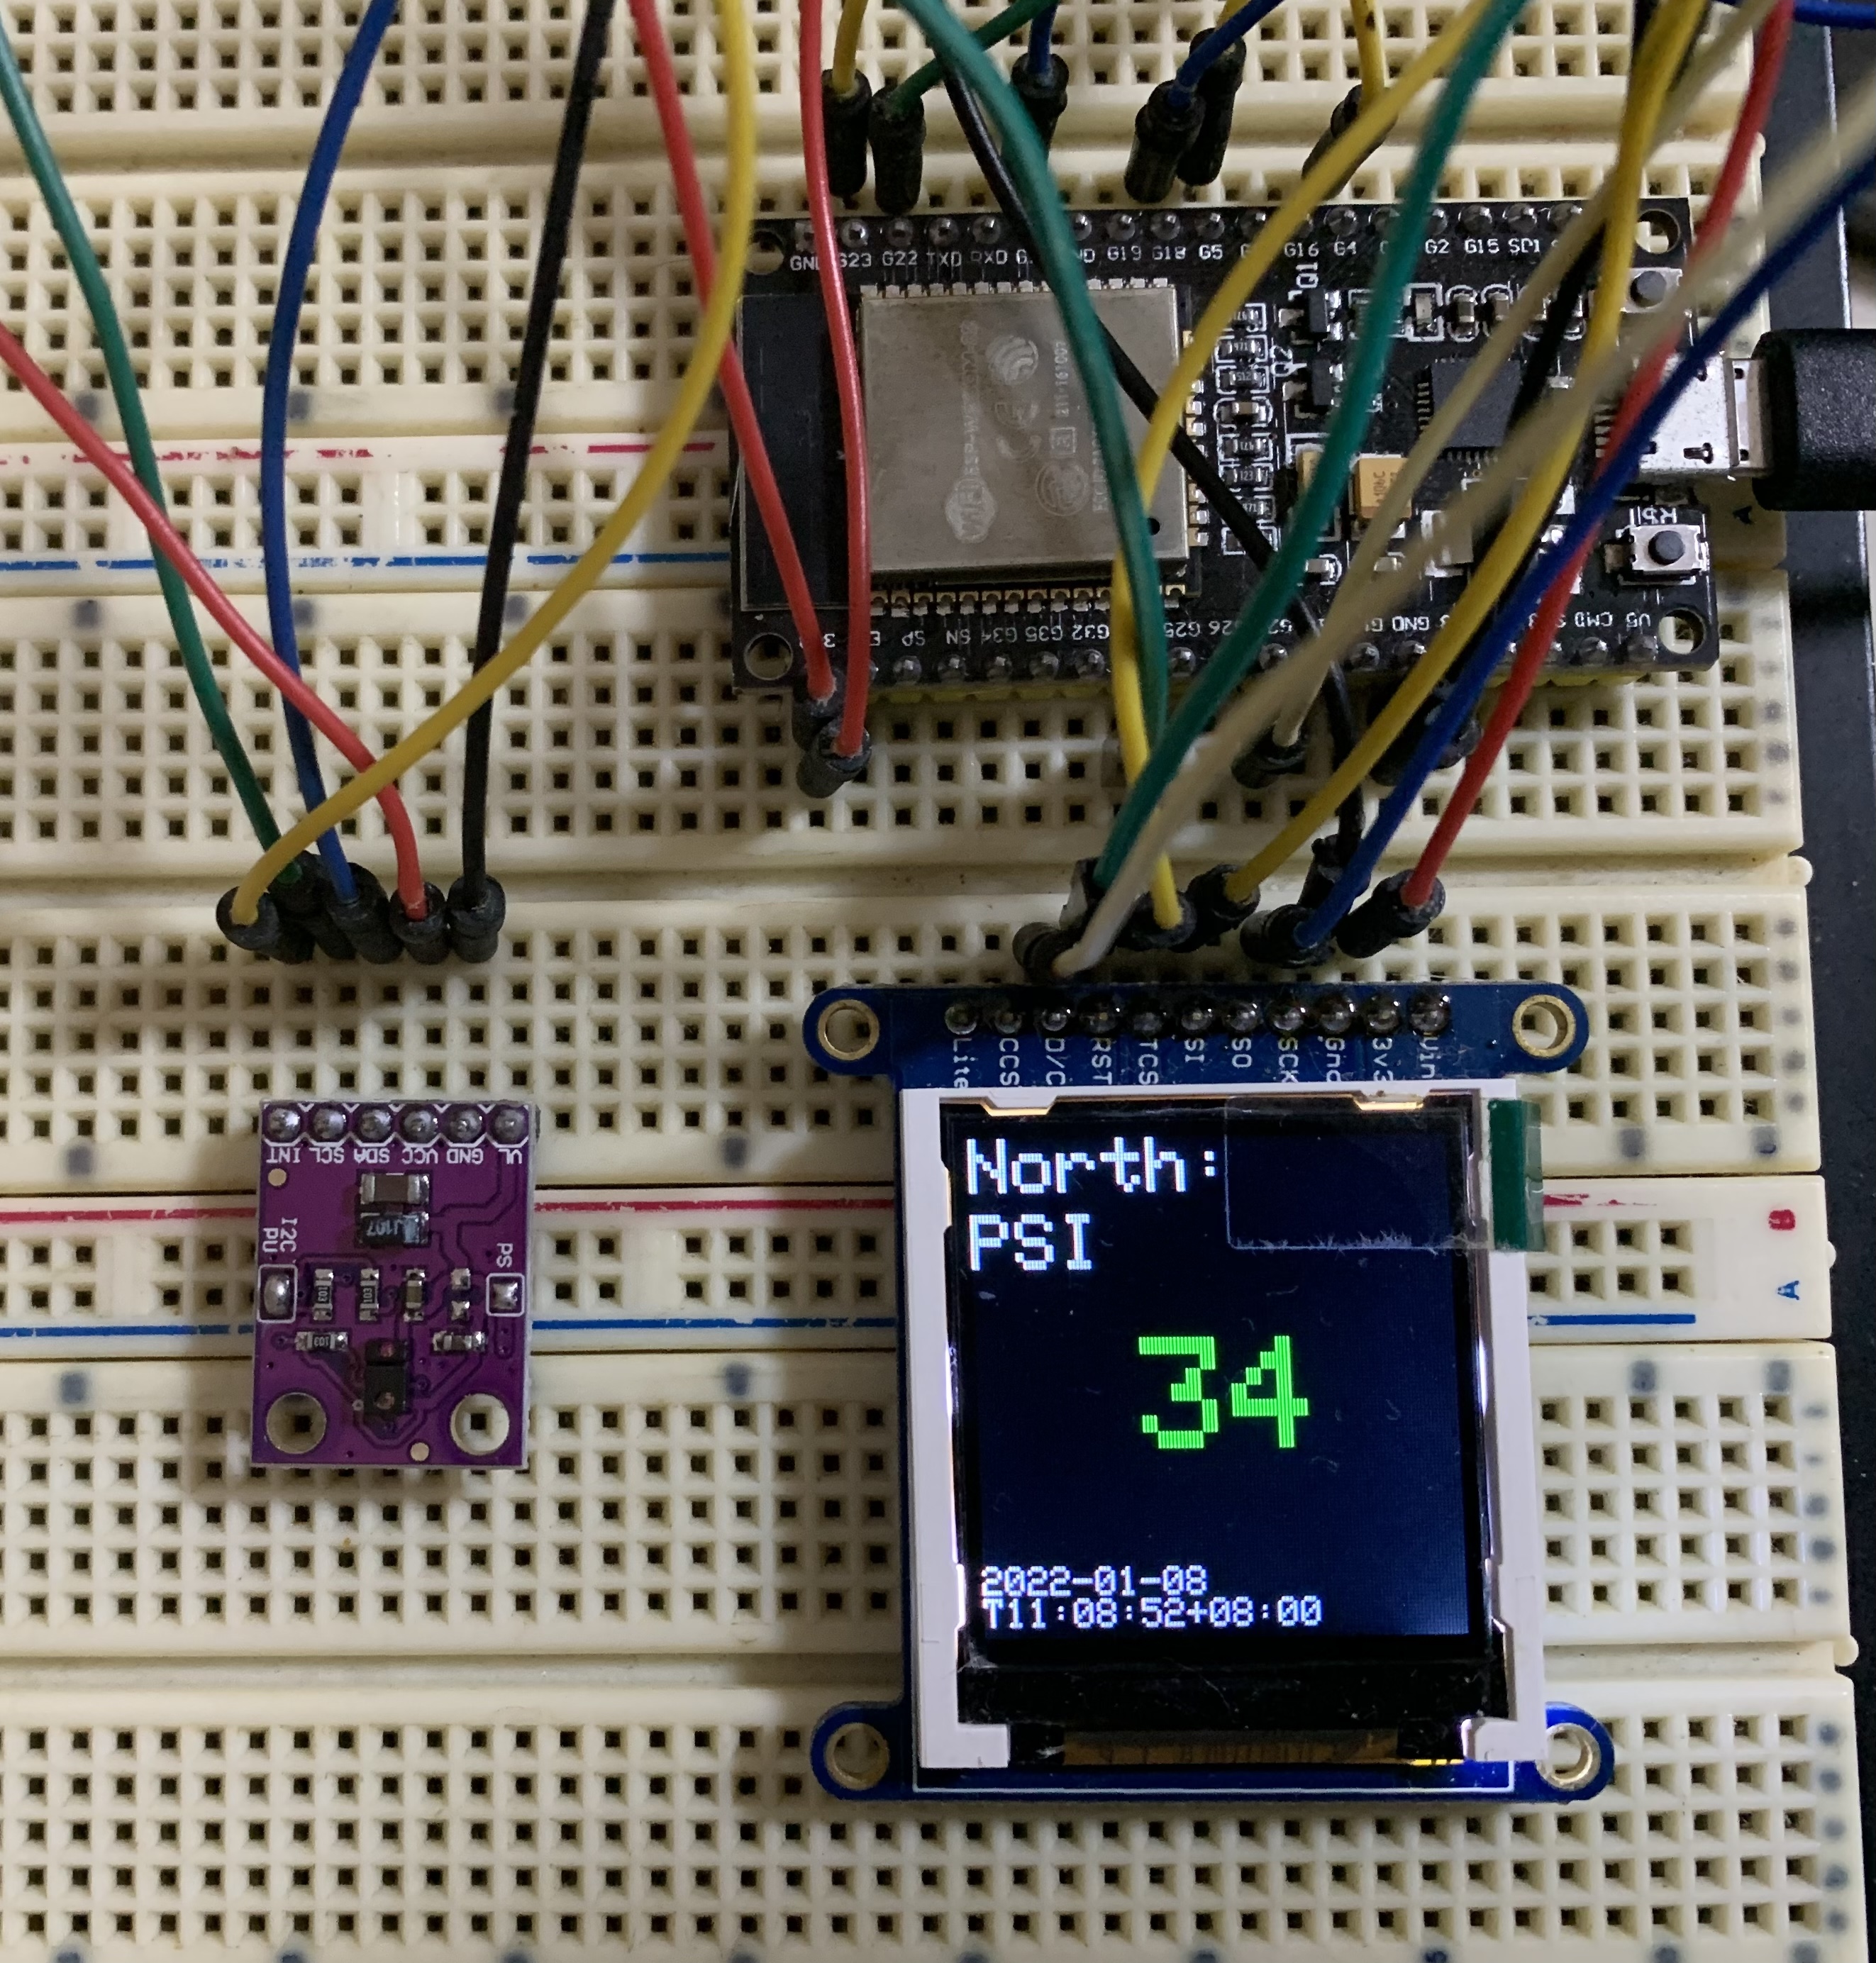
Main Interface


Inspiration
The inspiration is that we wanted to redefine the way how one looks at data through gesture. In this project, we selected the Pollutant standard Index, which is commonly viewed through a website, smartphone app or smart watch.
What it does
The device allows user to explore the PSI of various parts of Singapore through the use of gestures:
- Swiping down to select the 6 different locations.
- Swiping up to update the data.
- Swiping left to select the 4 various index type.
How we built it
The PSI is built using an ESP32, a TFT 1.44" LCD screen and a APDS9960 sensor. The data is obtained by calling the REST API through https://data.gov.sg.
Challenges we ran into
We had certain issues initially such as connectivity issue of the ESP32 with the access point, and the parsing of the JSON data, which was eventually solved through changing the access point and using a dedicated library for parsing the JSON data and rewriting the entire code to simplify the data handling.
Accomplishments that we're proud of
The main functionality of the idea is implemented in the prototype, and most of the basic features are working as intended.
What we learned
Always check those jumper wires before using them, and the best solution may be the simplest ones.
What's next for The PSI
- Refactor and code cleanup
- Automatic refresh of the data (e.g. hourly updates)
- Buzzer to notify user when it hits unhealthy level (e.g. > 200)
- More accurate gesture detection
- Transition animation
- A bigger TFT display to accommodate more information (e.g. weather data)
Built With
- api
- breadboard
- cpp
- esp32
- hardware
- iot
- rest


Log in or sign up for Devpost to join the conversation.