-
-

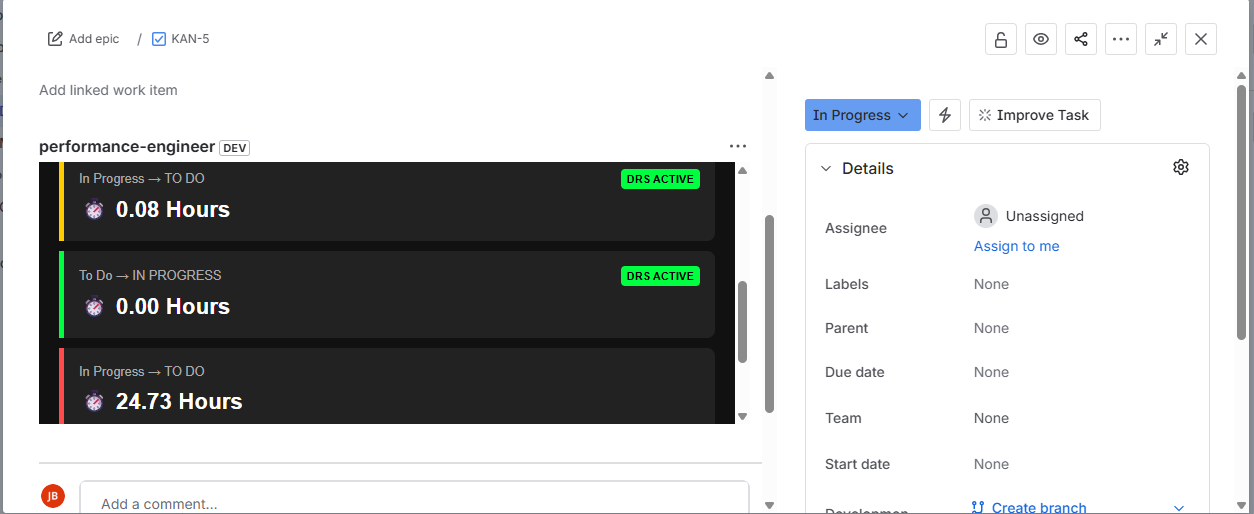
Task Telemetry: Detailed breakdown of time-in-status with automated DRS rewards for fast delivery.
-
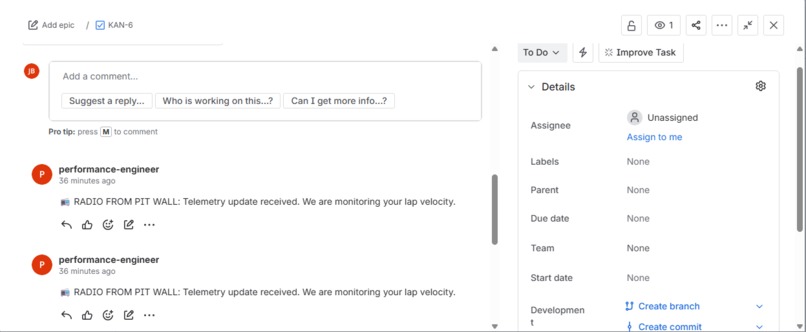
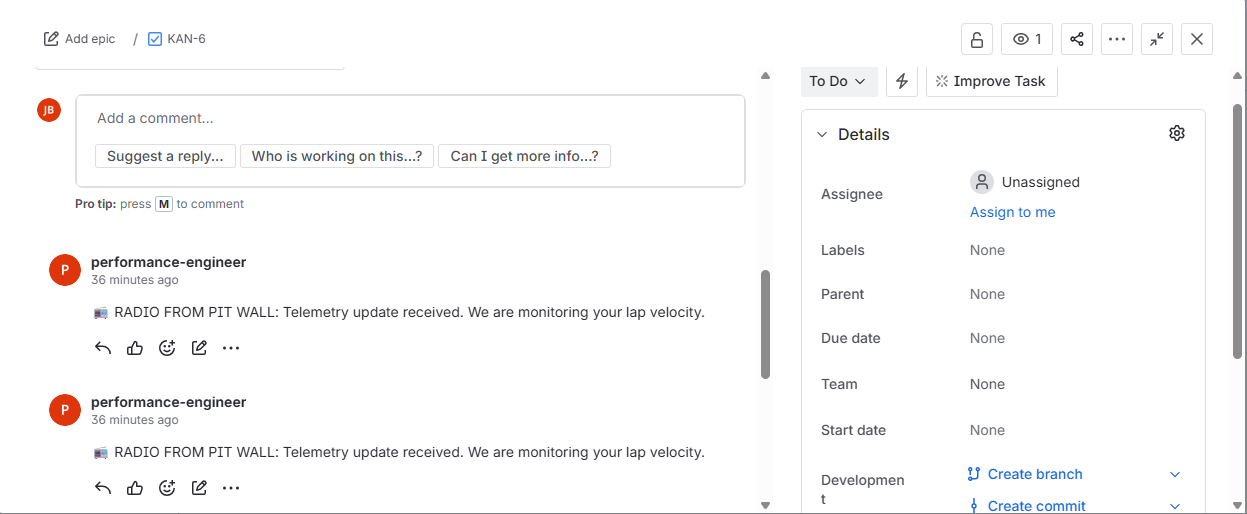
Automated Pit Wall Radio: AI-driven triggers that post real-time updates directly to the Jira activity feed.
-
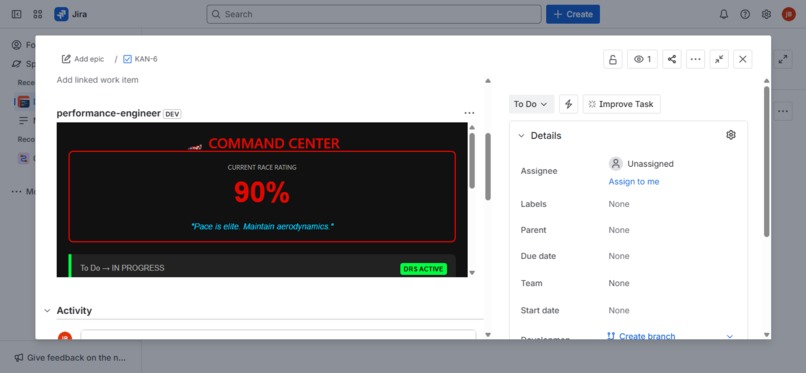
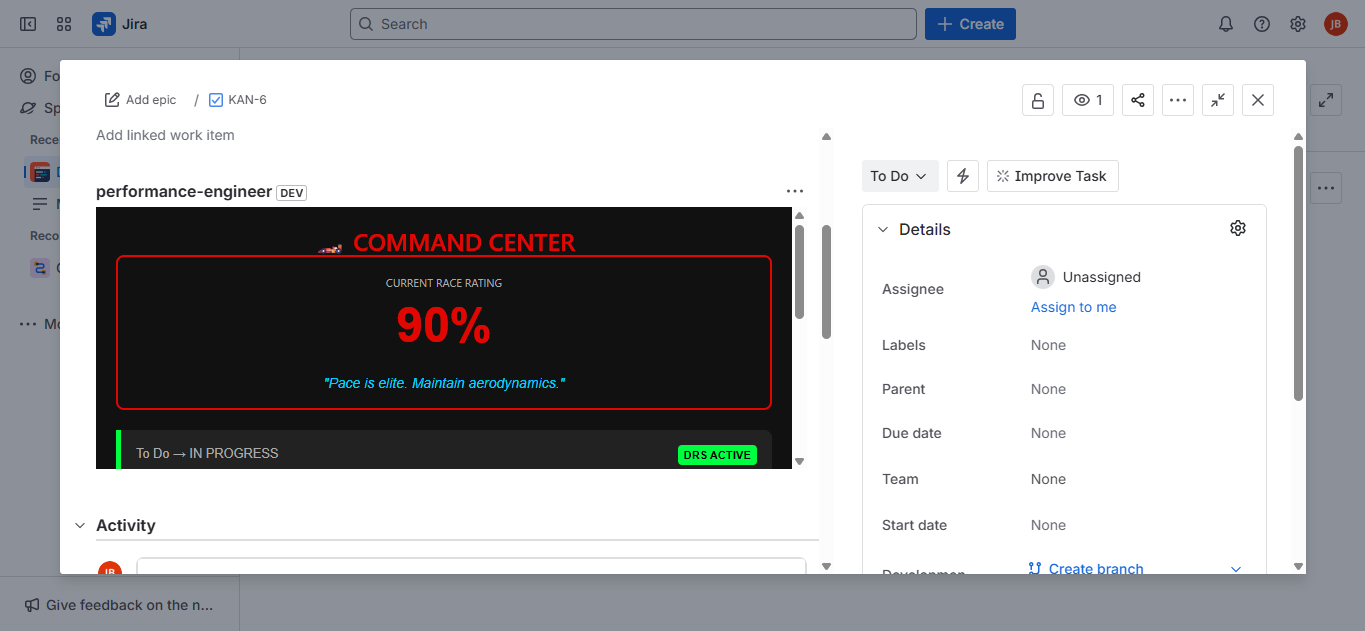
Main Dashboard: Real-time Race Rating and performance strategy briefing.
🏎️ Inspiration
In the high-stakes world of Formula 1, engineers at Williams Racing don't just look at where a car is on the track; they analyze real-time telemetry—speed, tire wear, and lap velocity. Most software teams, however, treat Jira issues like "black boxes" where we only see the current status, not the performance data behind it.
I was inspired to bridge this gap by treating every Jira task like an F1 car. By visualizing the "telemetry" of a task—how it accelerates through the pipeline or where it hits "Brake Zones"—teams can optimize their workflow with the same precision as an elite pit wall.
🏁 What it does
Lap Velocity transforms static Jira tickets into a high-performance command center.
Real-time Telemetry: A custom dashboard that visualizes every status change in an issue's history.
Race Rating: A dynamic 0–100% score that calculates task health by penalizing "stagnation" and "regressions".
DRS (Drag Reduction System): Automatically detects high-speed task completion (under 1 hour) and rewards it with an active DRS badge.
Automated Pit Wall Radio: A backend trigger that acts as a proactive coach, posting automated comments to the team as tasks move through the pipeline.
🛠️ How I built it
I built this project as a solo developer, handling everything from architecture to UI design using the Atlassian Forge platform.
Analytics Engine: Built with Node.js, the backend fetches the issue changelog via the Jira REST API to reconstruct the "Lap History".
Performance Math: I implemented custom logic to calculate the Race Rating. If $T$ is the time in a status, a "Brake Zone" is triggered if $T > 24\text{ hours}$.
Command Center UI: A React-based Custom UI dashboard designed with a high-contrast Williams Racing aesthetic.
Forge Triggers: I utilized
avi:jira:updated:issueto create the automated "Engineer" that posts real-time coaching comments.
🚧 Challenges I ran into
Solo Architecture: Balancing the development of a complex data sorting algorithm with a polished frontend required careful time management.
Data Synthesis: Jira stores status changes as individual events; I had to build an algorithm to calculate the delta between these events to find the true "Time-in-Status".
Trigger Loops: Ensuring the automated radio didn't trigger itself into an infinite loop of comments required precise permission scoping in the
manifest.yml.
🏆 Accomplishments that I'm proud of
I am incredibly proud of successfully taking a complex idea from concept to a fully functional Forge app as a solo participant. Seeing the "Pit Wall Radio" automatically provide feedback to a developer based on their work velocity was a major "podium moment" for me.
📚 What I learned
During this hackathon, I mastered the Atlassian Forge development lifecycle, specifically regarding Custom UI and Event-Driven Triggers. I learned how to transform raw event logs into meaningful performance metrics and how to manage a full-stack project independently under a tight deadline.
🚀 What's next for Lap Velocity: Performance Telemetry for Jira
The next step is to move from the "Driver" view to the "Constructor" view. I plan to add a Constructor’s Championship leaderboard that compares the "Lap Velocity" of different teams across an entire Atlassian site, allowing Williams Racing to identify their fastest engineering squads.

Log in or sign up for Devpost to join the conversation.