-
Strait Closure Impact
-

Strait Closure Impact
-
Strait Closure Impact
Inspiration
When something big happens in the world: a geo-political conflict, a sanctions regime, a war, the analysis of what it actually means now and in the future is either locked behind platforms that only governments and hedge funds can access, or buried in 3,000-word think-tank PDFs published three weeks after the fact.
There's a massive gap between "this happened" and "here's what it means for fuel prices, credit markets in New York, and oil tankers - simultaneously." Filling that gap has historically required either a roomful of analysts or an institution with a nine-figure data budget. We thought: why does that have to be true anymore?
What it does
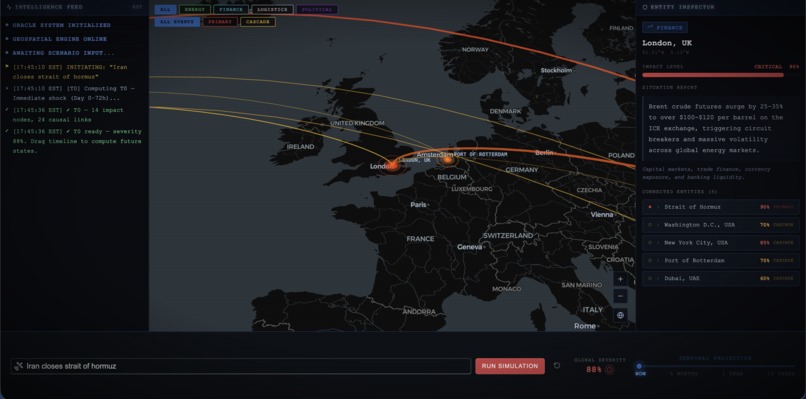
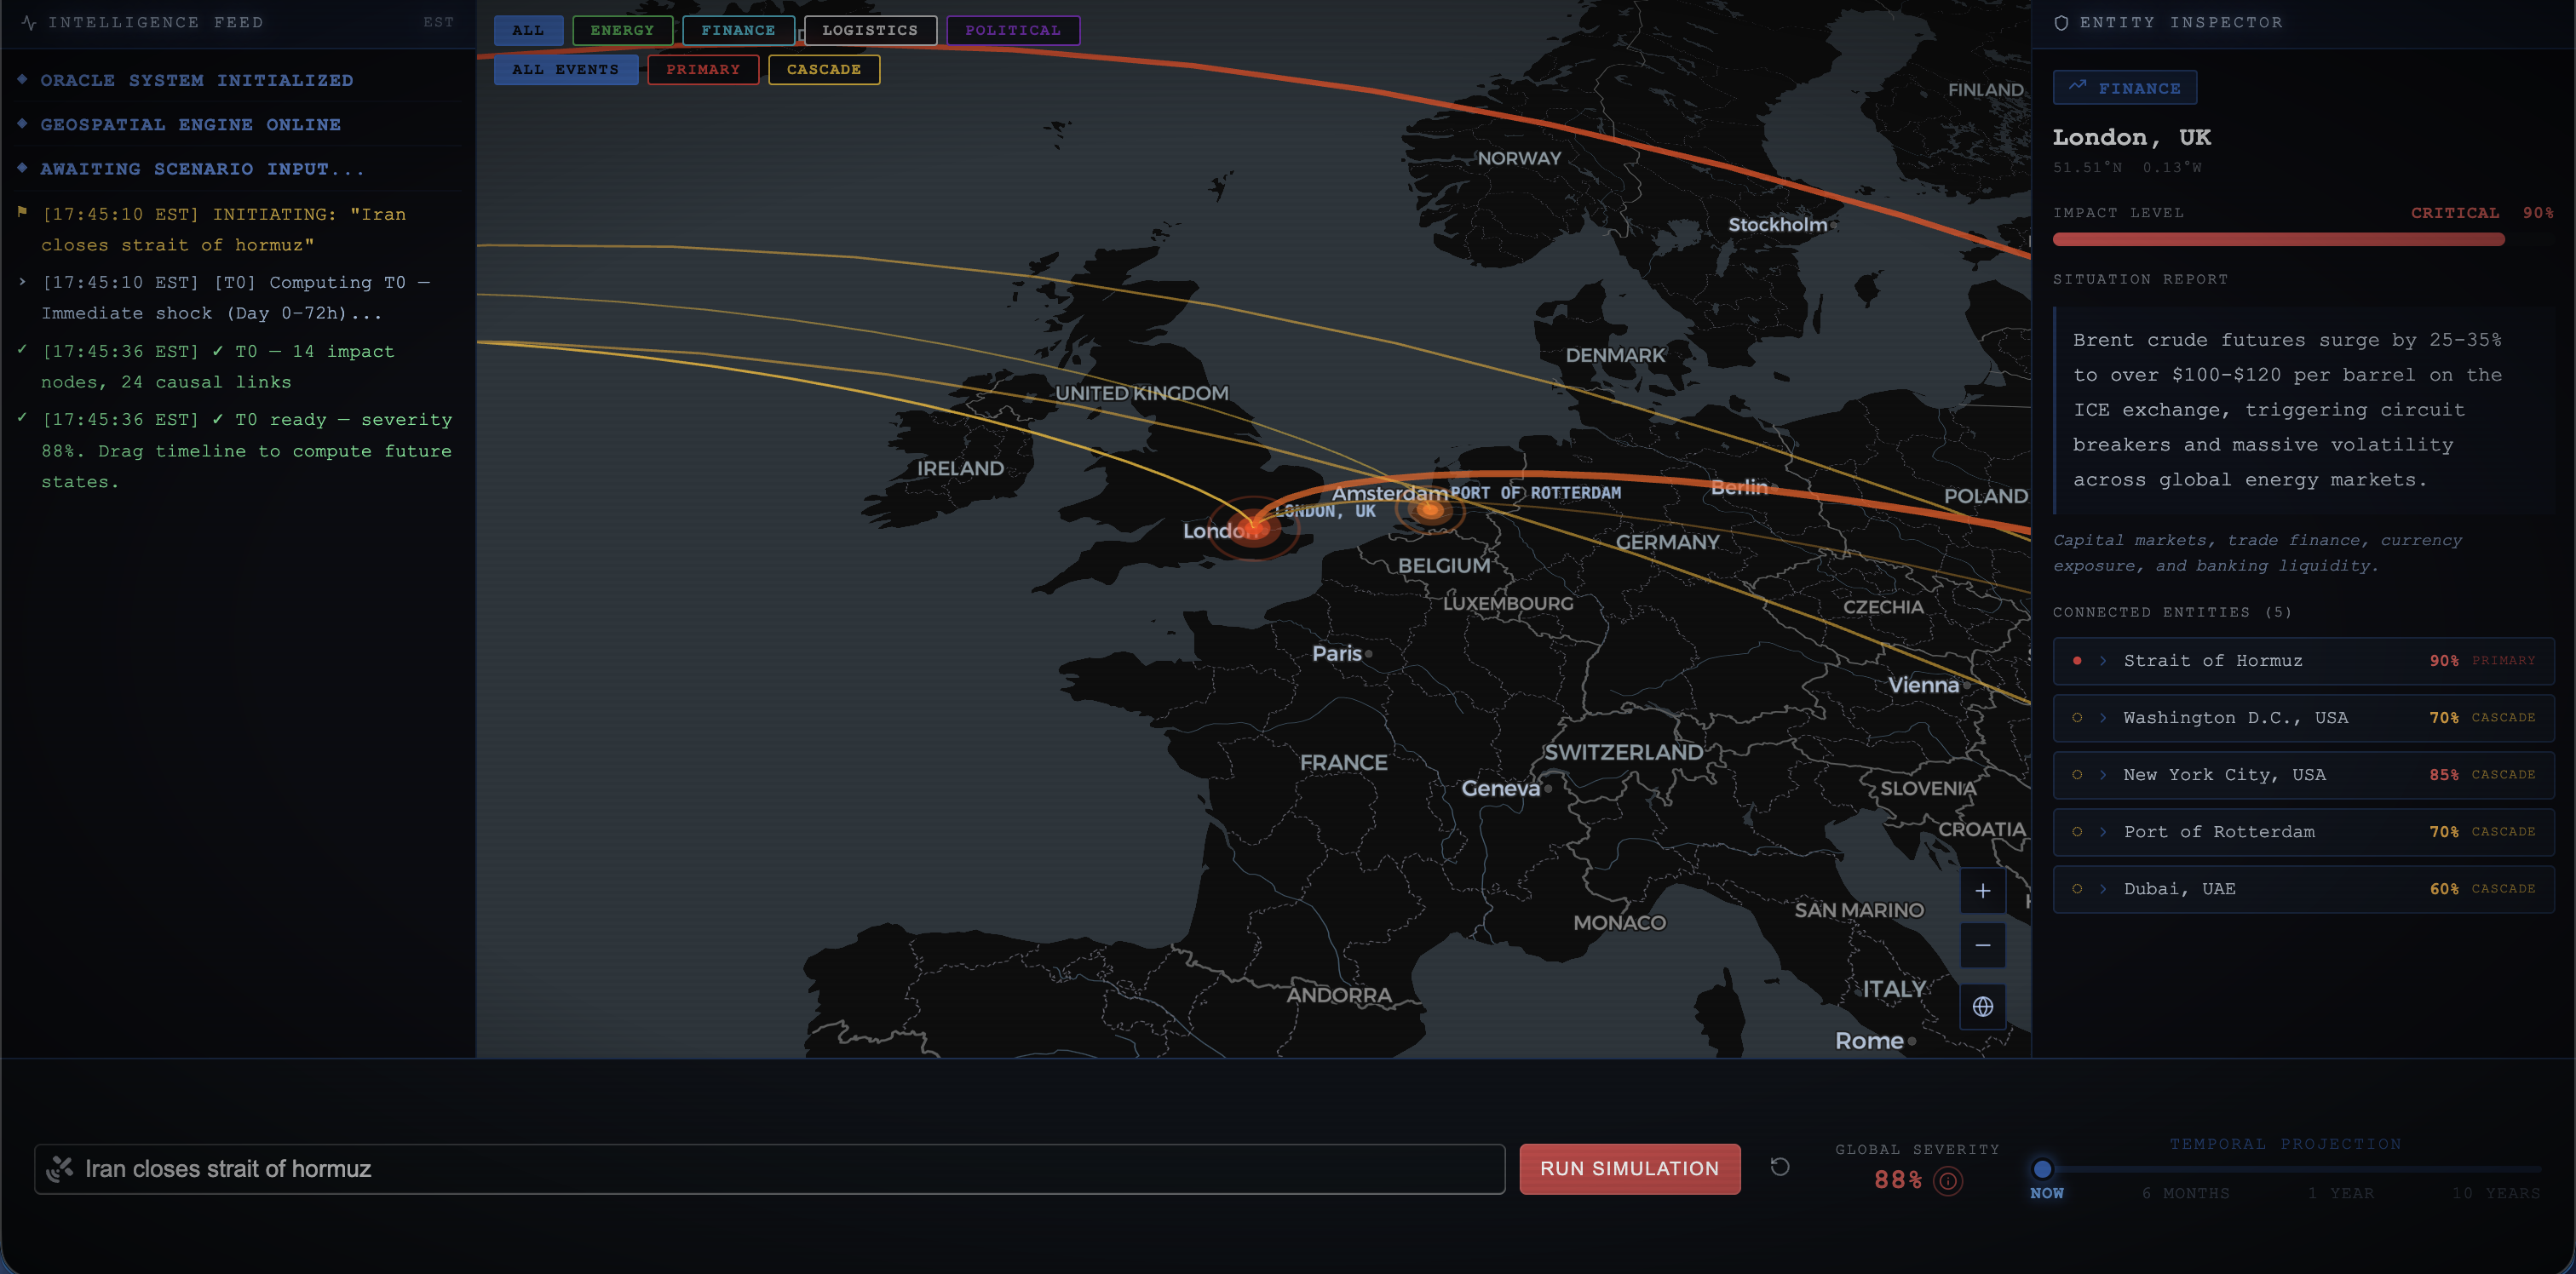
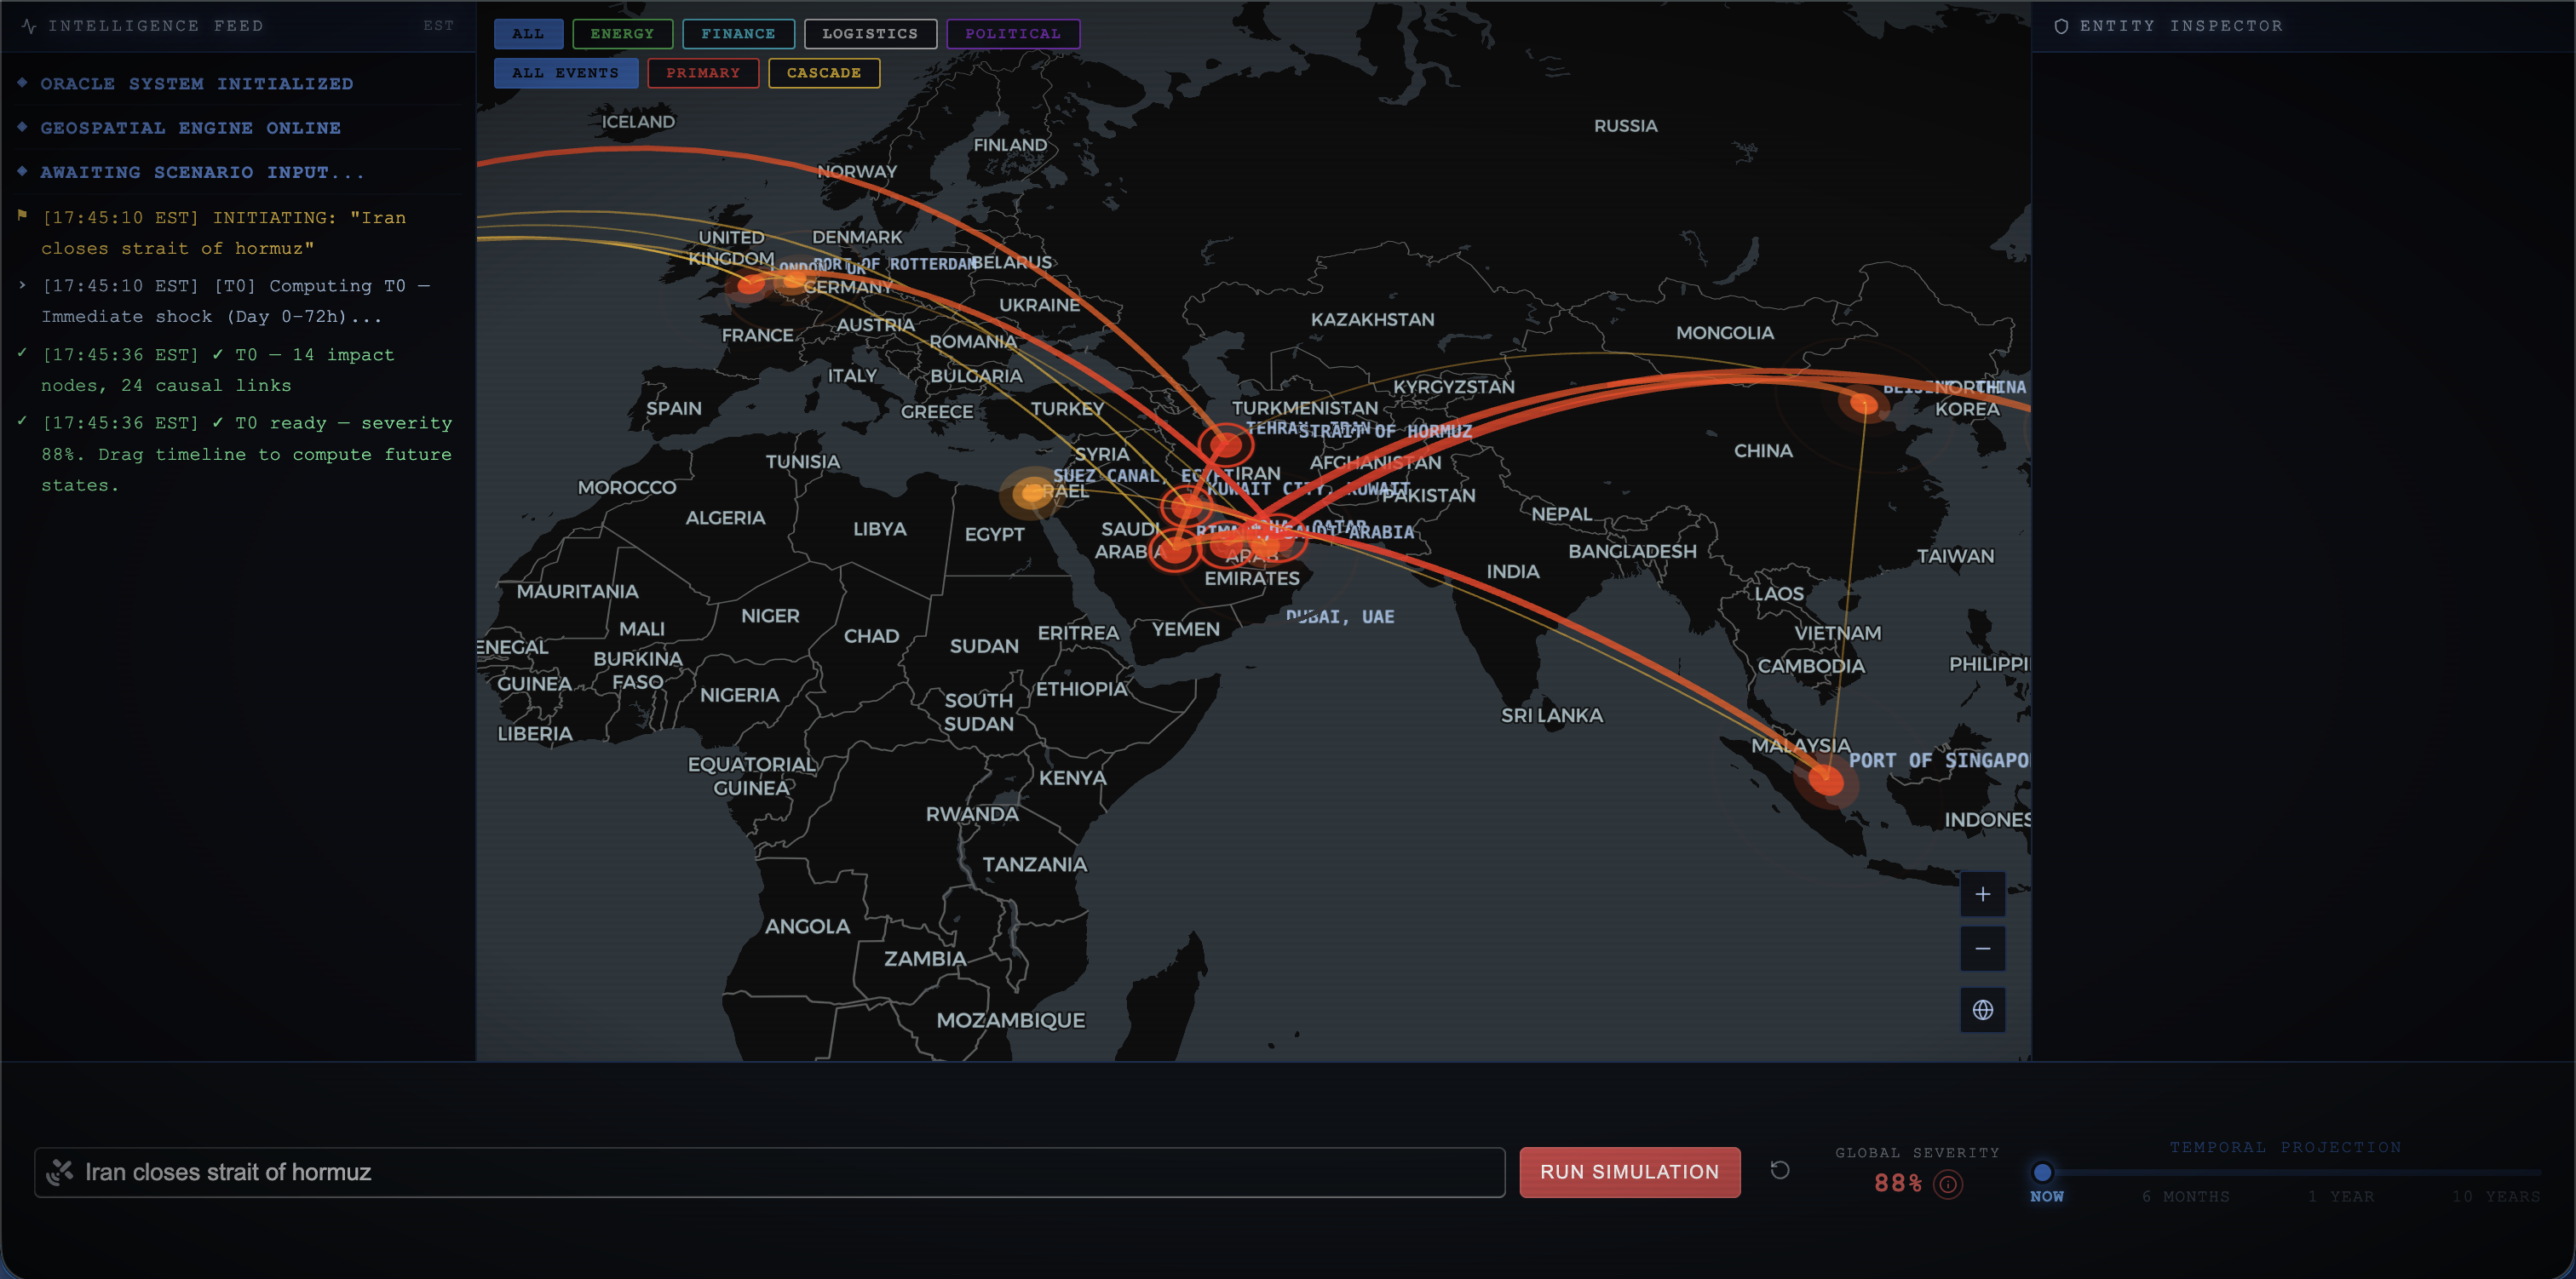
The Oracle is a real-time geopolitical simulation engine. You type any crisis scenario in plain English: a strait closure, a natural disaster, an embargo, a regime collapse — and within 20 seconds you're looking at a live 3D globe showing exactly which cities, ports, banks, and governments will feel it, how hard, and how those shockwaves cascade outward across four time horizons: Now, 6 Months, 1 Year, and 10 Years.
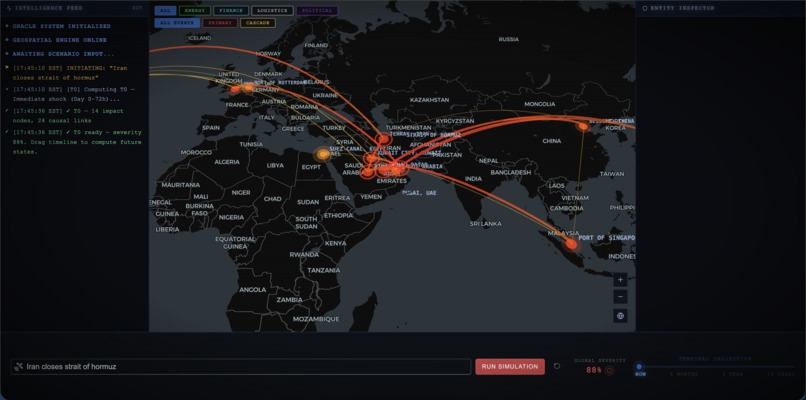
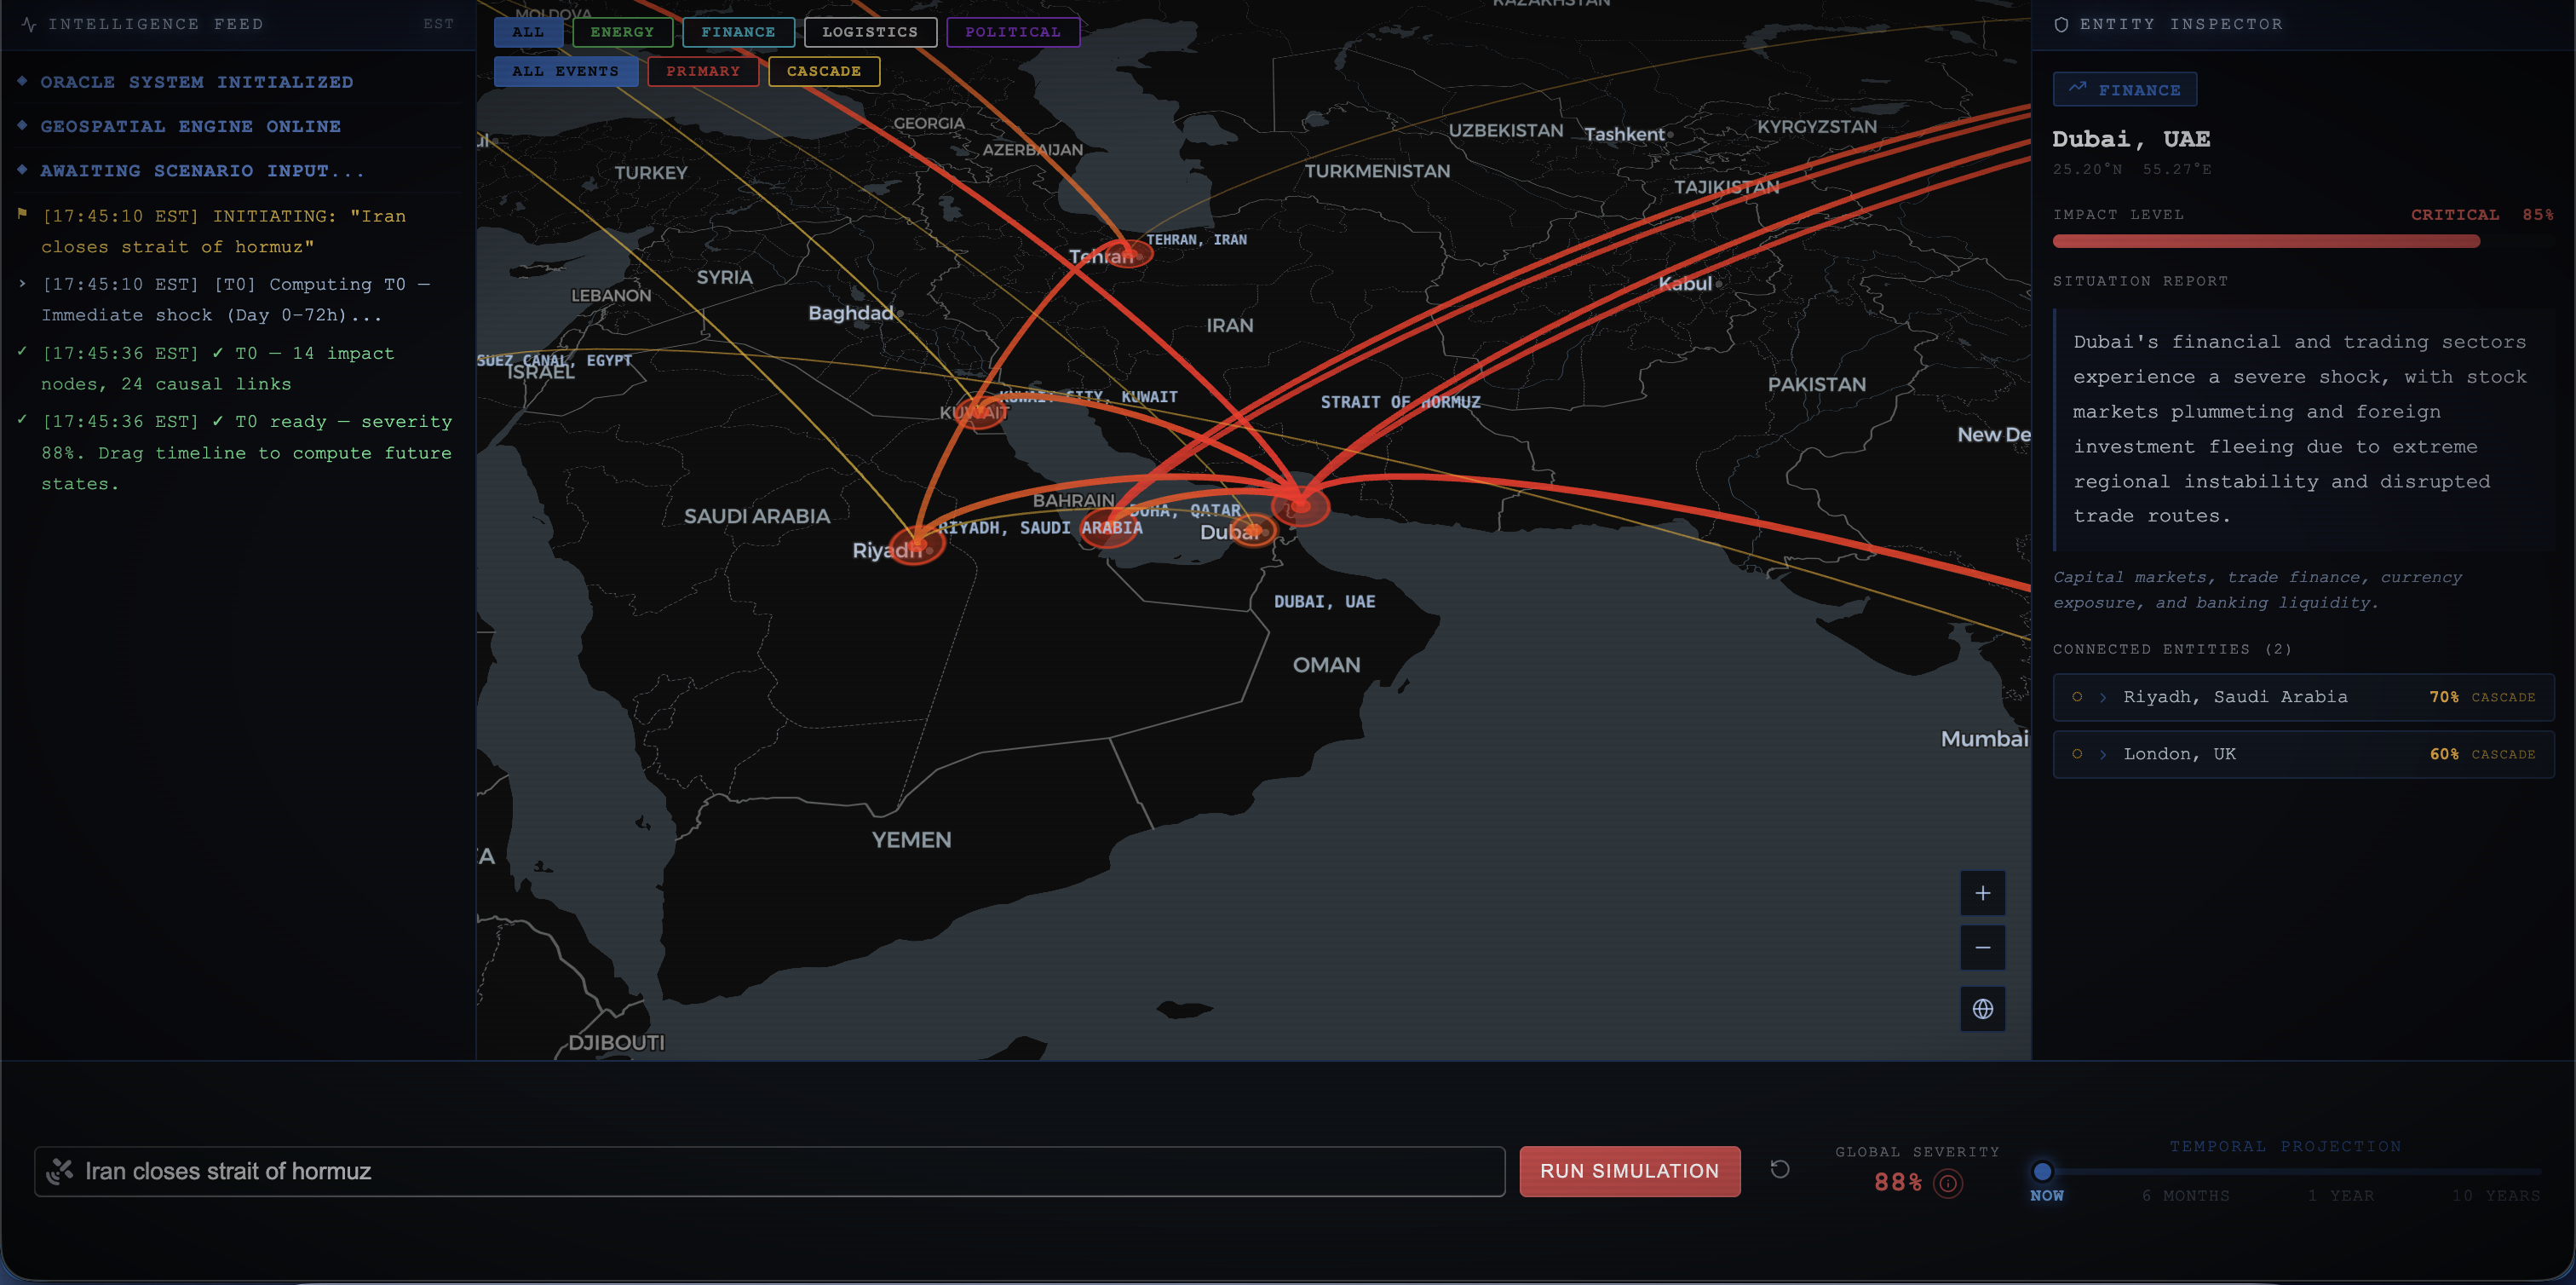
Every impact on the map is a typed node: Energy, Finance, Logistics, or Political. Nodes are connected by arcs that distinguish direct first-order causes from cascading secondary effects. Click any node and the Entity Inspector shows you a specific, data-rich narrative of what's happening there and why. Drag the timeline slider and watch the geopolitical landscape evolve — some crises stabilize, some escalate, new actors emerge at the 10-year horizon that weren't relevant on day one.
You can filter the globe by sector or by effect type (primary vs. cascade), and if your scenario is geographically scoped — say, "scoped to Southeast Asia" — the app automatically applies a 4-layer graph traversal that shows only the incident location, the in-scope impact nodes, their direct neighbors, and those neighbors' connections. No global noise, just the slice of the world that matters for your question.
How we built it
The architectural decision that shaped everything: model the world as a typed causal graph, not a report. We defined the Unified Shock Object (USO) — a strict JSON schema where every impact has a geocoordinate, sector, intensity score $\in [0, 1]$, narrative, and typed edges with weights. Once that schema was locked, the entire system was engineered around enforcing it.
We use Gemini 2.5 Flash for four sequential API calls per simulation. The first call activates Google Search grounding so the model has live information to work from — actual oil prices, current alliance statuses, real shipping lane data — before generating the T0 shock frame. The next three calls (T6M, T1Y, T10Y) receive compressed summaries of prior frames as context, so each projection is a genuine evolution of what came before rather than three independent guesses. The cascade intensity across the graph follows an exponential decay from the origin shock:
$$I_d = I_0 \cdot e^{-\lambda d}$$
where $I_0$ is the direct impact intensity and $d$ is graph distance from the incident node. Edge weights in the USO schema enforce that no cascade node can exceed the intensity of its source.
The visualization runs on Deck.GL over MapLibre, fully GPU-accelerated via WebGL2. Each node renders through three stacked ScatterplotLayers — a wide halo, a mid glow, and a solid core — each with sinusoidal alpha phasing offset by node intensity so no two nodes pulse in sync. Critical nodes (intensity $> 0.72$) get a fourth expanding blast ring that grows outward and fades using modulo-based phase offset. Arc heights are computed dynamically by geographic distance to prevent global arcs from clipping off the screen:
$$h = h_{\max} \cdot e^{-\delta / 70}$$
where $\delta$ is the angular separation in degrees between endpoints. Trans-Pacific arcs stay flat; regional arcs curve naturally.
State runs through Zustand with a lazy temporal loading strategy: T0 renders immediately, and future frames are fetched on-demand the first time the user reaches that time period. The entire frontend is React 19 + TypeScript, and the app ships as a native desktop binary via Tauri 2.0 with a Rust backend capable of running Gemini calls natively using async Tokio and reqwest.
Challenges we ran into
The hardest problem was JSON truncation. Gemini supports up to 65,536 output tokens and we use all of them, but occasionally a response would truncate mid-object — cutting off inside a narrative string or leaving brackets unclosed. A failed parse meant a failed simulation.
We wrote a custom repair function from scratch. It walks the raw response character-by-character, tracking bracket depth and string context, finds the last fully-closed node or edge object at depth 2, trims there, counts unclosed openers, and closes them in reverse order. It salvages the majority of truncated responses that would otherwise fail completely. That one function probably saved more demo sessions than anything else in the codebase.
The geographic scope filtering was conceptually clean but took real iteration. The problem is distinguishing four semantically distinct node types — the incident location, in-scope region, their direct neighbors, their neighbors' connections — when they all live in a flat array from the API. We went through multiple approaches before landing on the isIncident field alongside focal as the right tagging strategy in the prompt, and even then the graph traversal required careful reserved-set logic to prevent neighbor expansion from pulling in nodes that shouldn't be visible.
Accomplishments that we're proud of
Getting Google Search grounding to work correctly inside the simulation pipeline is the thing we're most proud of technically. The T0 call uses the googleSearch tool to anchor the model in live data before generating the impact graph — which means the simulation reflects the actual state of the world at query time, not just training data. No RAG pipeline, no custom retrieval system, no data engineering. One API call, grounded in reality. That's a genuinely powerful thing and we don't think it's been used this way before.
The visual result also exceeded what we expected going in. The animated globe with 16 nodes, four animation layers per node, and 22 live arc connections runs at 60fps without compromise. The terminal-style intelligence feed, the panel proportions, the pulse animations — it looks and feels like a real analytical command center, not a hackathon prototype. We set a high bar for the aesthetic from day one and we hit it.
We're also proud of the resilience engineering underneath the surface: the JSON repair parser, the exponential backoff retry system, the post-parse edge sanitizer that strips self-loops and dangling references, the arc height decay formula, the label clustering algorithm that spreads overlapping node names into a radial starburst. None of this is visible to the user. All of it is what makes the app actually work under real conditions.
What we learned
Gemini's Google Search grounding is genuinely underused. The ability to anchor model output to live web data — inside a single API call, without any retrieval infrastructure — changes what's possible for applications that depend on current facts. For geopolitics specifically, this is not a nice-to-have. It's the whole point.
We also learned that structured output from LLMs is an architectural commitment, not a feature toggle. Committing to the USO schema upfront — and then engineering the prompt contract, the repair parser, the type system, and the sanitizer all around enforcing it — produced a system far more reliable than anything we've built by trying to parse free-form model text. When the model is a structured data source, the rest of the system can be deterministic. That's a different way of building with AI than most teams default to.
And WebGL is fast enough that the tradeoffs we assumed we'd have to make didn't exist. We came in expecting to compromise on animation quality to hit real-time performance. We didn't. The right abstraction layer — Deck.GL over WebGL2 — removes the ceiling entirely.
What's next for The Oracle
The version we want to build is live, collaborative, and streaming. Real-time event data feeds — wire services, satellite imagery, market data — piping directly into the simulation engine so the globe updates as the world updates. Multiple analysts working on the same scenario simultaneously, with a conflict-resolution layer for competing interpretations of the same event. A saved scenario library with version history so you can track how a simulation's predictions compared to what actually happened.
The market for this is real: corporate risk teams, government policy shops, academic researchers, investigative journalists, financial institutions doing geopolitical scenario planning. What all of them have in common is that they currently do this work slowly, expensively, and with tools that weren't designed for it. The Oracle was designed for exactly this. That's the version we're building toward.


Log in or sign up for Devpost to join the conversation.