-

will new drivers start driving?
-

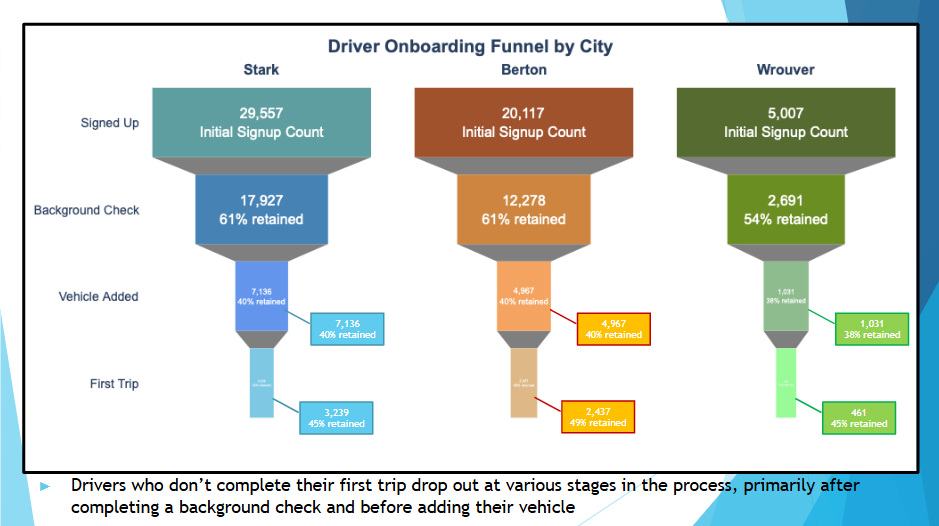
at each step, uber loses drivers
-

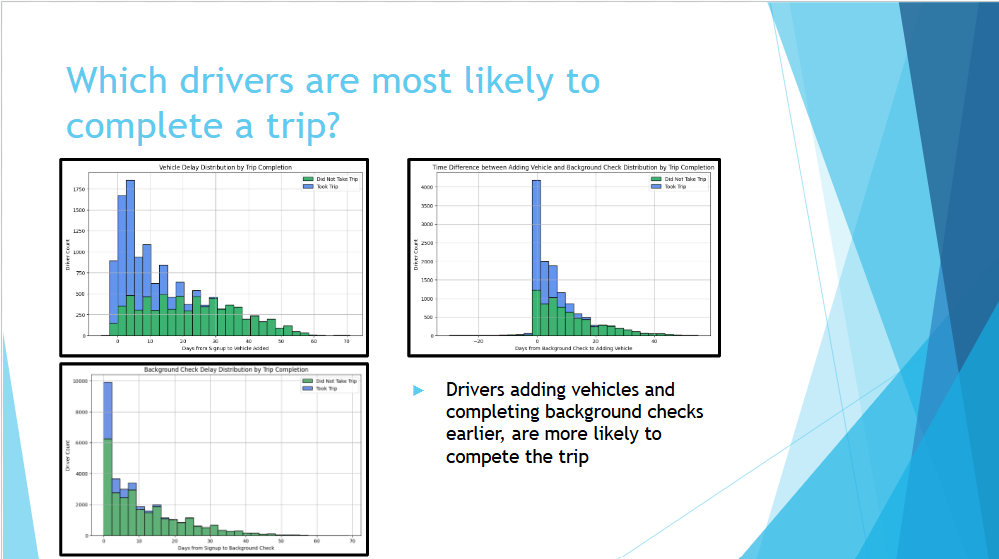
the features and factors for losing drivers
-
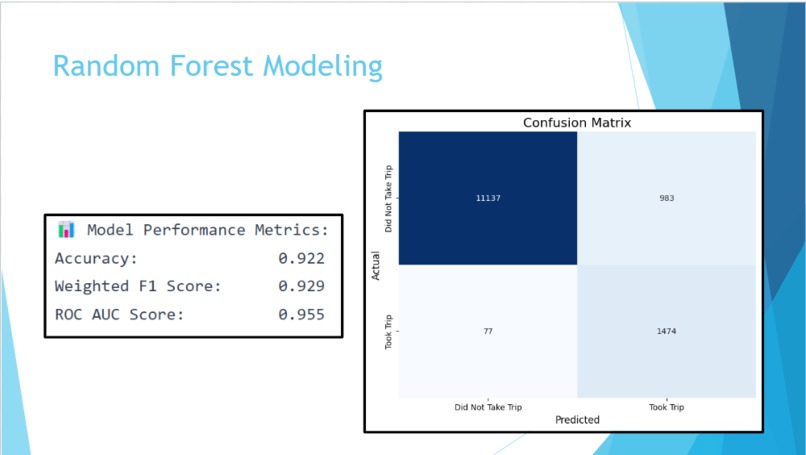
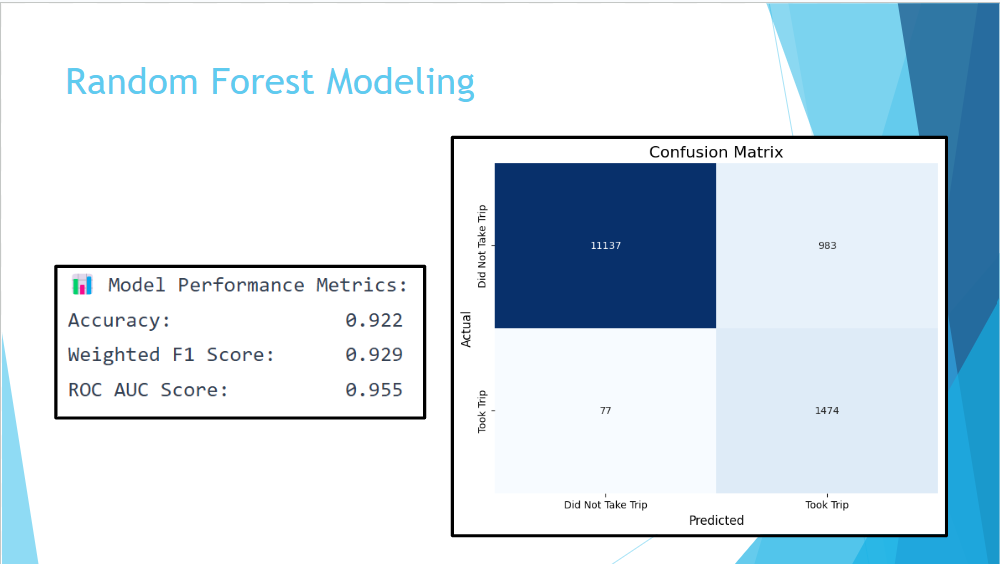
the best model to predict whether new drivers will start driving
-

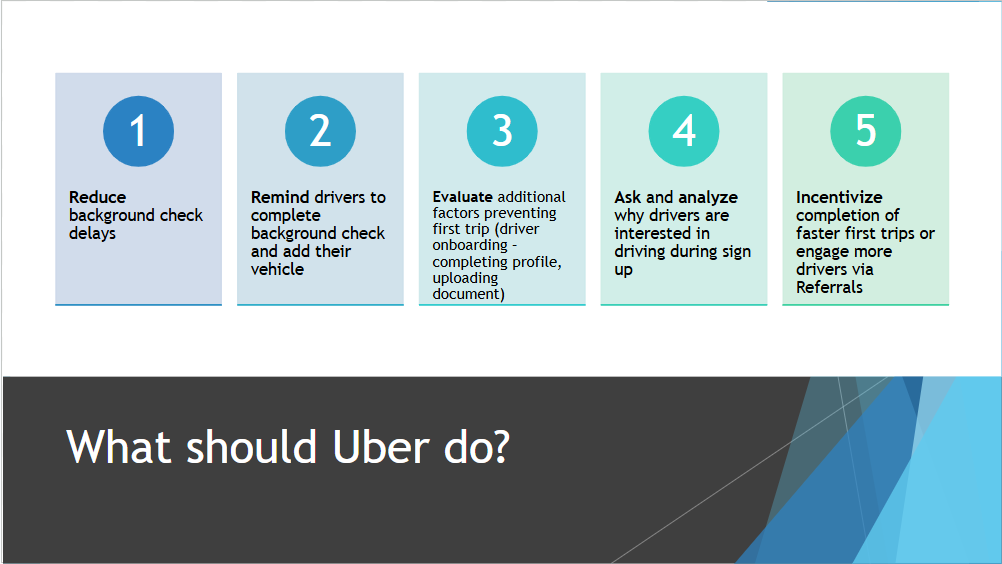
applications and next steps for uber
Inspiration
Businesses often rely on data to gain insights, expand their reach, and increase profit. We wanted to learn about data that could make a meaningful impact by helping Uber grow their business.
What it does
Using Uber driver sign up data provided by StrataScratch, we identified and visualized the relationships between first trips and other factors such as driver sign up dates, background check dates, and vehicle add dates. Our team developed a binary classifier to predict whether a driver that is signed up will complete a first time and identified strategies for increasing first trip turnout rate.
How we built it
We mainly used jupyter notebooks on Deepnote with python libraries including Pandas and Numpy for data cleaning and preprocessing such as dealing with null values and encoding non-numerical values. For data visualization, we used a combination of Matplotlib for histograms and pie charts, Seaborn for correlation heatmaps and confusion matrices, and Plotly for other charts and graphs. For our machine learning, we used sklearn for data scaling and models as well as imblearn for data balancing.
Challenges we ran into
The first challenge we ran into was dealing with null values. At first, we just dropped them and ended up with 12k observations, which is about 20% of our original data. We found that these observations were well balanced; there was about an equal number of users who completed their first trip and those who did not. This will change later on. The second challenge we faced was having a skewed distribution for each of our predictors. In order to combat this, we decided to scale our data using sklearn’s RobustScaler to minimize the effect of outliers.
We trained our first logistic regression and random forest models on this and ended up with an accuracy and F1-score of 74%. To better improve our random forest model, we decided to drop features that were contributing less to the model and ended up with the two most important features: vehicle_delay, the amount of days which users registered their vehicle, and bgc_vehicle_delay, the amount of days between users completing their background check and registering their vehicle. We also ran 5-fold cross validation on our data to determine the maximum depth to use for our random forest and found that a maximum depth of 5 was the most ideal. However, even after feature selection and hyperparameter tuning, our results were only marginally better. We tried different machine learning models as well, such as XGBoost to focus on the errors of each tree, and LightGBM to focus on the most beneficial splits. However, our results seemed to be stagnant at 74%.
So, we decided to use the null values that we had previously dropped as an effort to increase the number of training and testing data. After checking the distribution for the column values, we found that there were a lot of outliers, so we decided to use the median value. We found that with the addition of these new observations, the data was significantly unbalanced; about 89% of users did not complete a first trip and only 11% of users who did. Thus, since we had about 54k total observations, we decided to random undersample the training data as an effort to reduce bias towards the majority class. After applying random undersampling, feature selection, and hyperparameter tuning on our new training data, we ended up with an impressive accuracy of 92% and weighted F-1 score of 93%.
Accomplishments that we're proud of
Initially, our team was proud that we were able to complete the challenge. From there, we were able to further enhance our training methods for our predictive model, as well as discover newer insights when taking the time to diagnose each column and its significance to the matter at hand.
What we learned
We learned the importance of being intentional in every stage of the ML lifecycle. From data visualizations to model selection and model evaluation, every decision was made with our ultimate purpose in mind: identifying what factors influence first trips and accurately predicting those trips. Throughout the process, we learned how to perform data cleaning, feature engineering, and combat class imbalances.
What's next for The Missed Ride
Moving forward, our team would like to provide a more practical solution/application to help increase First Trip Drivers for Uber. We could probably look at more of the data or a different data set to find what keeps Uber drivers driving. We could also look into if Uber drivers continue to drive even after their first trip, to see how we can help develop habits and retention for these drivers.


Log in or sign up for Devpost to join the conversation.