-
-
Body Map
-
Daily Log
-
Sandbox
-
Dashboard
-
Methodology & Trust
Metabolic Mirror: Project Story
Inspiration
The idea came before the problem.
We thought it would be genuinely cool to build something that could predict how your daily choices might shape your future health, a kind of mirror that reflects not just where you are, but where you're heading. A metabolic mirror. The name came naturally.
From there, we started researching what tools and data sources could actually make that possible. We already knew about wearables: fitness trackers, smartwatches, heart rate monitors. Those were the obvious starting point. But as we dug deeper, we discovered two technologies we hadn't fully appreciated before.
The first was continuous glucose monitors, CGM patches you wear on your skin that read your blood sugar in real time, every few minutes, without needles. The second was epigenetic testing, blood tests that analyze DNA methylation patterns across hundreds of thousands of sites in your genome to calculate your biological age, independent of your calendar age. Not just a single number, but an actual pace: how fast are you aging right now, at the molecular level?
The more we learned about these tools, the more a concrete problem came into focus. People using CGMs could see their glucose spike after a meal. People getting epigenetic tests could see their biological age. But nobody could answer the question that connected the two:
"Is what I did today making me age faster or slower?"
That gap is what Metabolic Mirror was built to close.
What It Does
Metabolic Mirror connects three data streams, wearables (HRV, sleep), continuous glucose monitors, and epigenetic reports, into a single, continuous answer to one question: is your biology aging faster or slower than your calendar?
The product is built around six views, each with a distinct job:
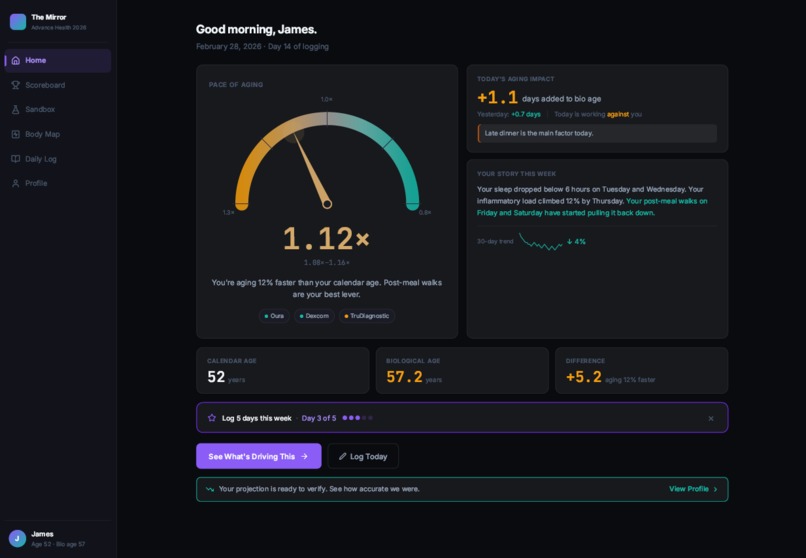
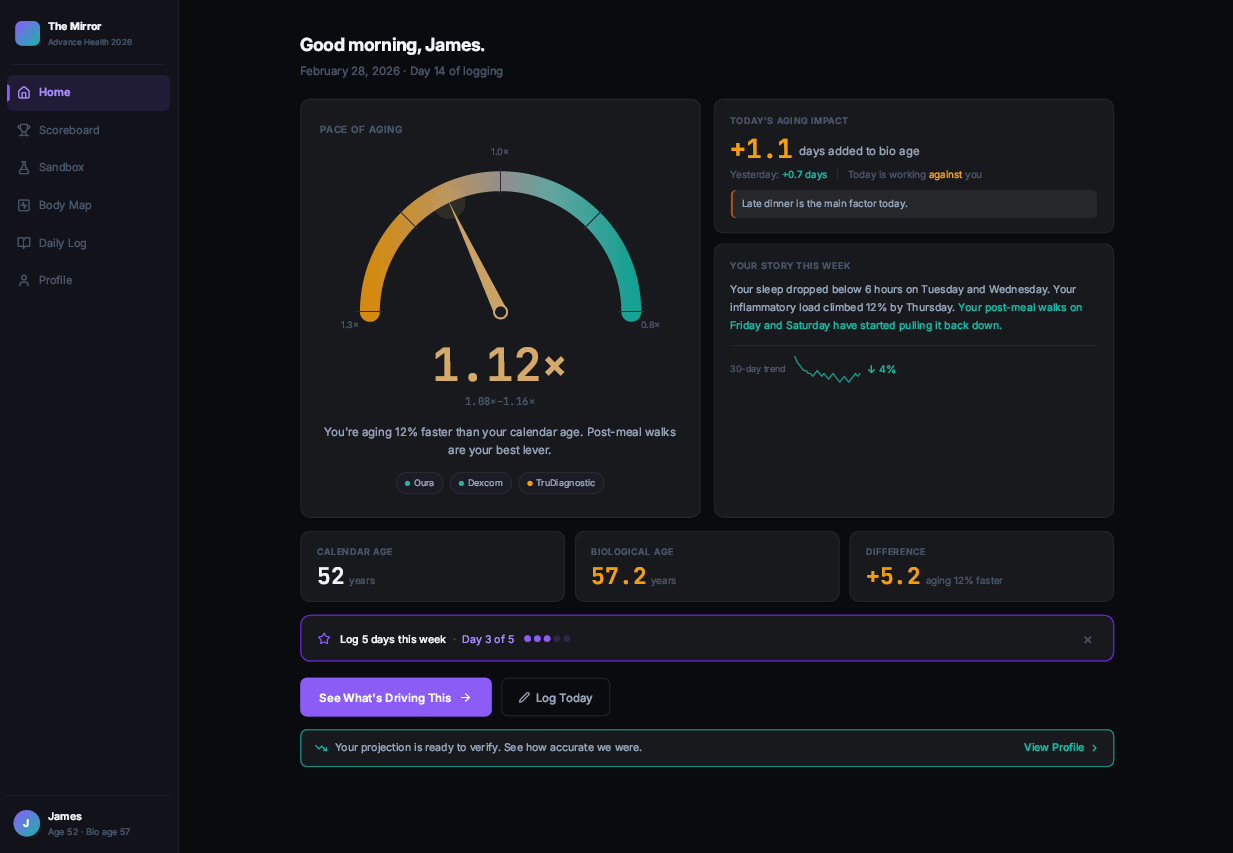
Dashboard delivers a verdict quickly. A pace gauge shows the user's current aging rate (e.g. 1.12×). One sentence explains what it means and what to do about it: "You're aging 12% faster than your calendar age. Post-meal walks are your best lever." Three data source pills show what is feeding the system and when it last synced.
Intervention Scoreboard shows what the user can change and by how much. Habits are ranked by their projected impact on biological aging, each one tagged with an evidence grade (STRONG RCT / MODERATE RCT / PRELIMINARY). Impact bars make it easy to compare options at a glance.
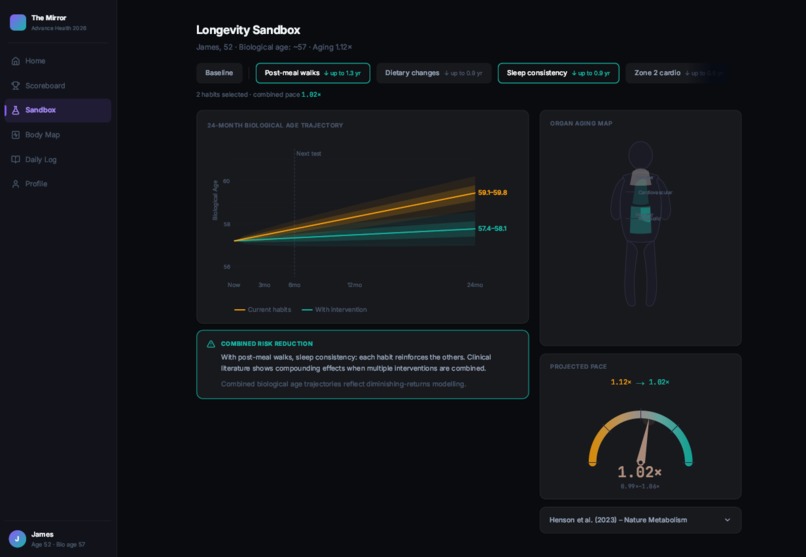
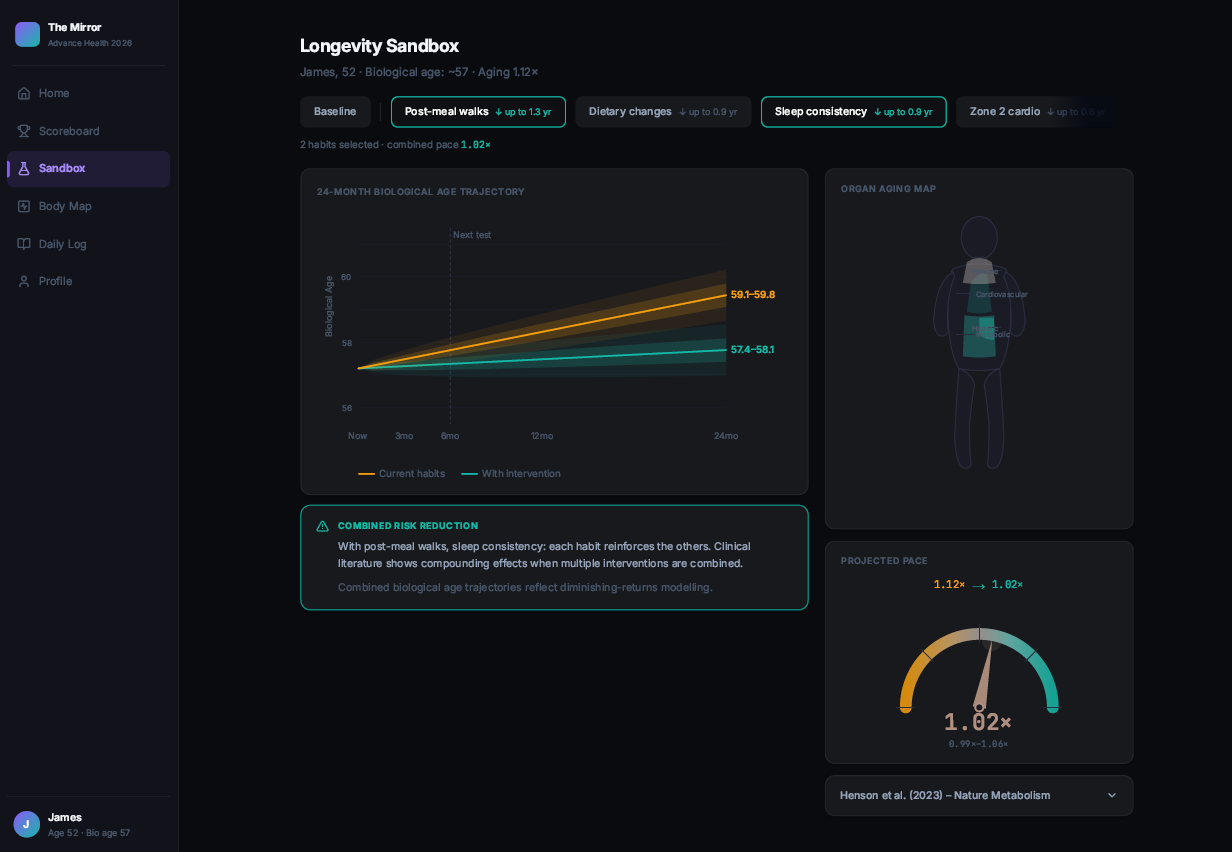
Longevity Sandbox lets users explore two futures side by side. A diverging fan chart shows the current trajectory in amber (biological age rising) and a chosen intervention in teal (biological age falling). Confidence bands widen over time to reflect growing uncertainty. A mini pace gauge updates when the user switches between scenarios, showing the projected shift from 1.12× to 1.02×.
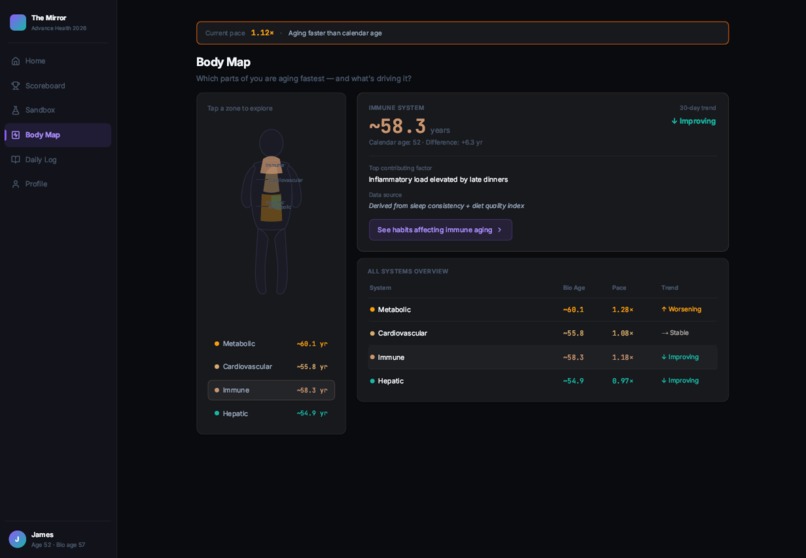
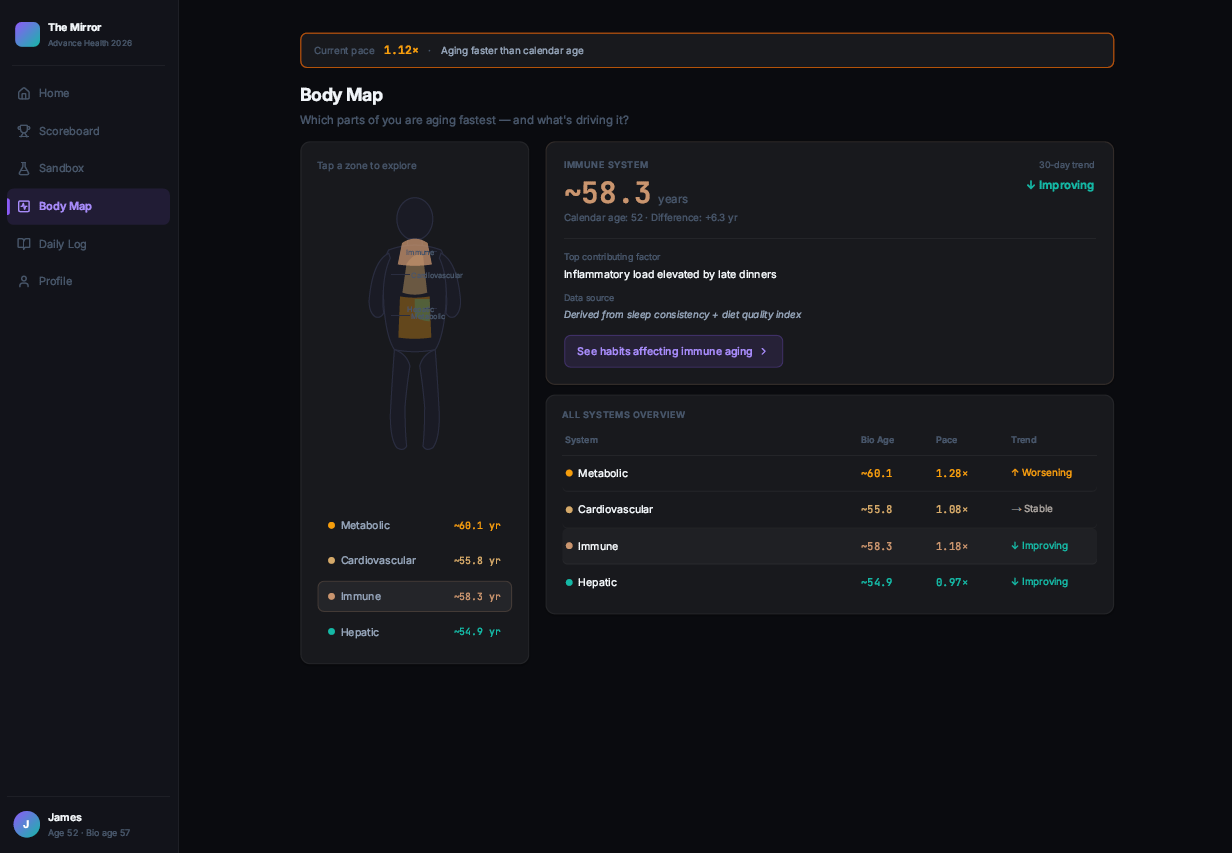
Body Map works alongside the fan chart to show the same information spatially. An SVG body silhouette is divided into four organ zones: metabolic, cardiovascular, immune, and hepatic. Each zone is colored on the amber-to-teal scale based on its current aging rate. When the user selects an intervention, the zones animate to their projected colors over 800ms. Zones that improve most shift the most noticeably. The fan chart shows the numbers; the body map shows where in the body the change is happening.
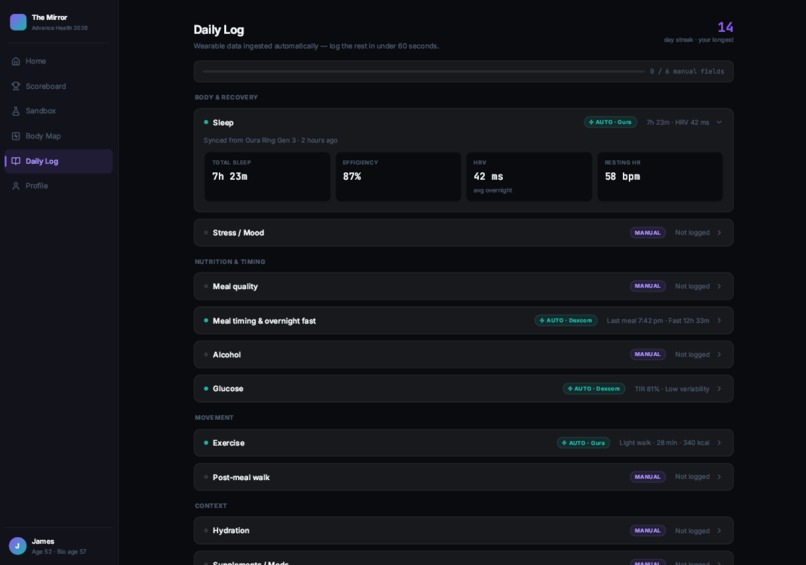
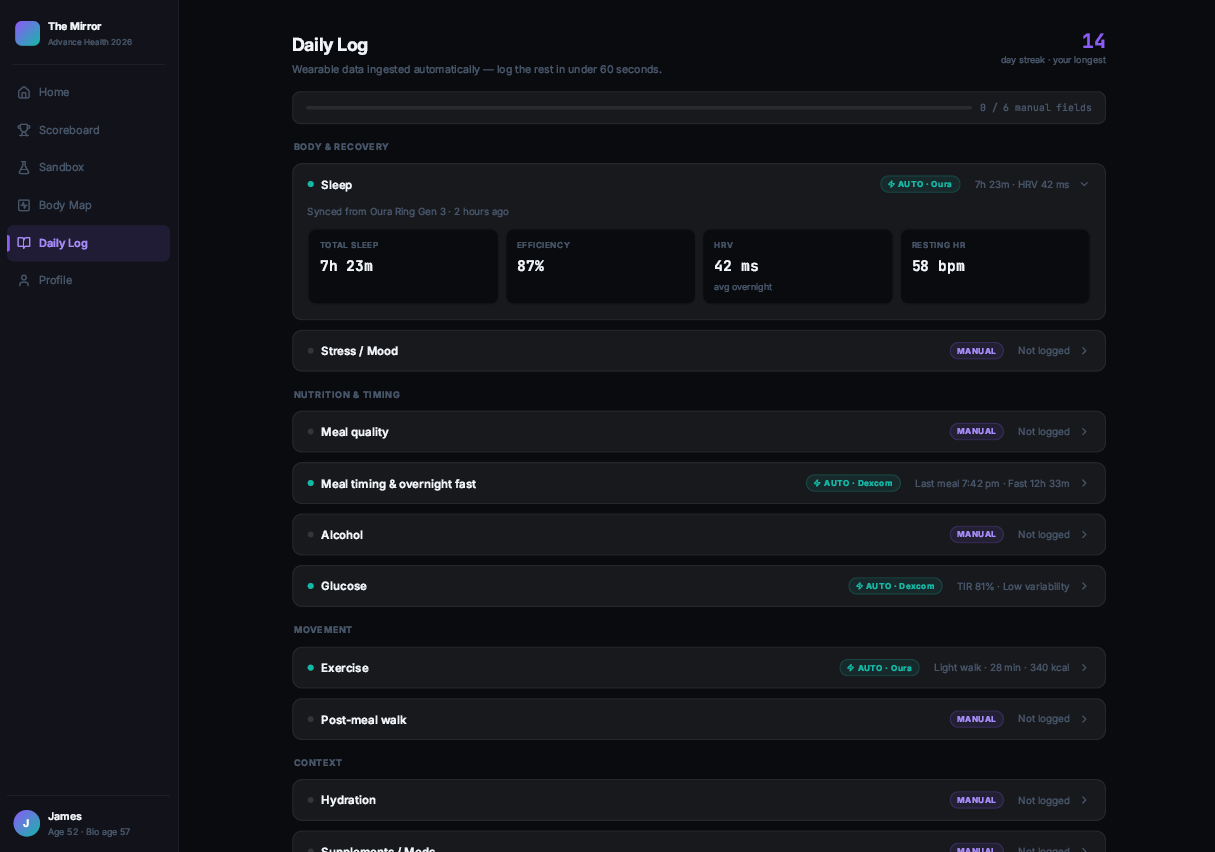
Daily Log captures what sensors cannot. A short check-in, under 60 seconds, records meal timing, alcohol, stress, and movement. Each entry feeds into the bridge engine and updates the pace gauge immediately, so users see the impact of their inputs before closing the app.
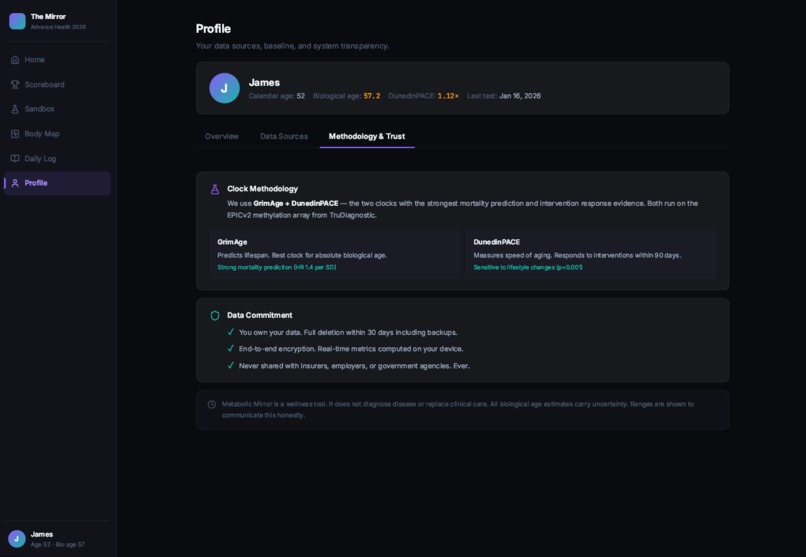
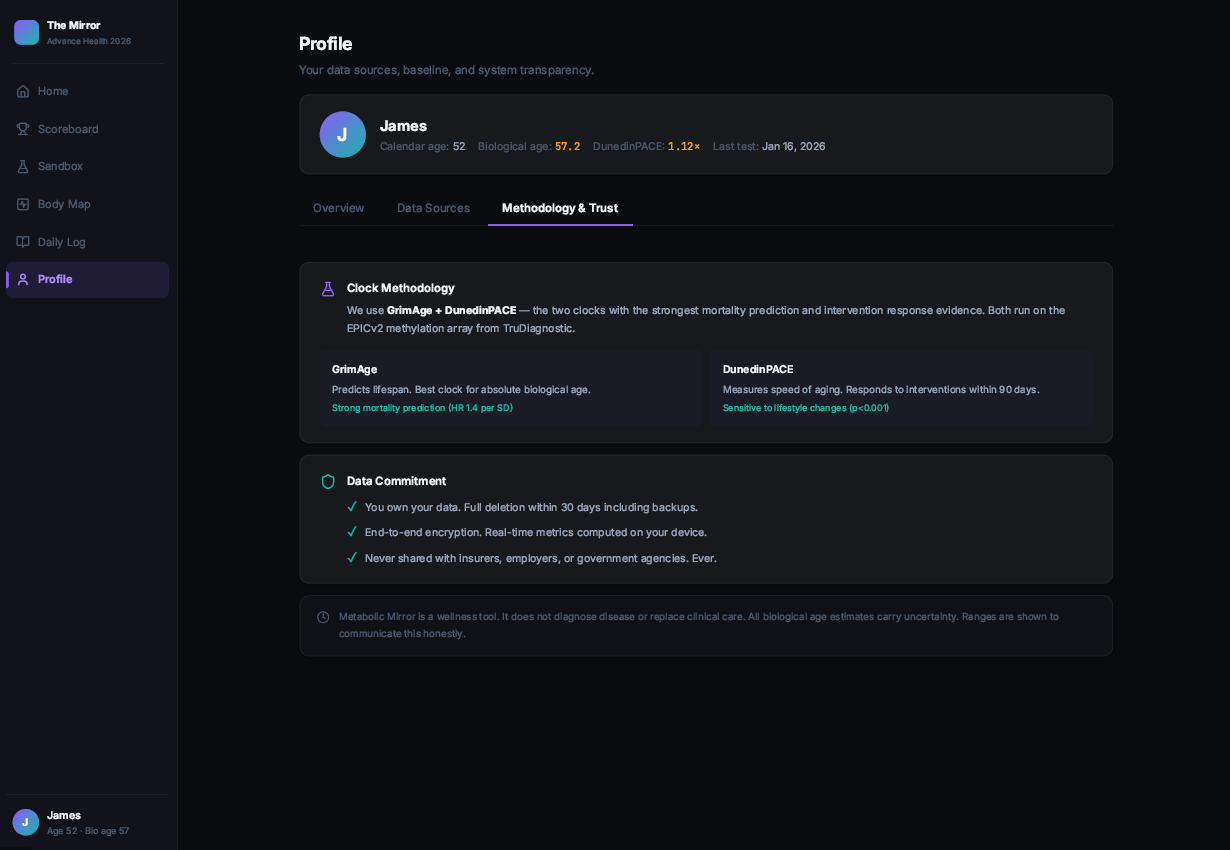
Profile is organized into three sections. Overview shows user identity and a summary of the current epigenetic baseline. Data Sources has expandable cards for each connected device, wearable, CGM, and epigenetic report, showing sync status, last reading, and connection controls. Methodology and Trust covers the clocks used (GrimAge and DunedinPACE, EPICv2 array), data commitments (encrypted, on-device, never shared, deletable in 30 days), and scope: a wellness tool, not a diagnostic.
How We Built It
The biggest architectural decision was to abandon machine learning entirely.
The initial plan involved training a predictive model. Then we asked: do we actually need ML to answer this? The clinical literature already has the effect sizes. Fitzgerald et al. showed an 8-week lifestyle intervention reversed biological age by 3.23 years. Kawamura et al. showed 2-year reductions from sustained exercise. The CALERIE trial quantified caloric restriction effects on DunedinPACE. These are published, peer-reviewed numbers with confidence intervals. We didn't need to train a model. We needed to implement the science.
We built a transparent, rule-based bridge engine instead:
- Normalize daily variables (glucose variability, HRV, sleep efficiency, dietary pattern) to a 0–1 scale
- Weight and combine using literature-derived coefficients into a Daily Aging Impact Score
- Anchor to the user's last DunedinPACE measurement as a baseline
- Apply temporal uncertainty, meaning confidence bands widen the further we project from the last epigenetic checkpoint
- Smooth with a 7-day rolling average and display with honest uncertainty ranges
Every projection references its source study. Every output shows a range, not a point estimate. The engine runs entirely client-side with no backend, keeping the build simple and the demo reliable.
The visualizations, the pace gauge, fan chart, and body map, are built with custom SVG math rather than off-the-shelf chart libraries, giving us precise control over the animations that make the Sandbox come alive.
| Layer | Technology |
|---|---|
| Frontend | React + TypeScript + Tailwind CSS |
| Visualization | Custom SVG (pace gauge, body map, fan chart) + D3 math |
| Bridge Engine | JavaScript, client-side |
| Data | Synthetic JSON (James, 52, 90-day dataset) |
| Deployment | Vercel, one artifact, no backend |
Challenges We Ran Into
The 3D trap. The original plan included a Three.js 3D body visualization. We estimated 15–25 hours to do it properly, half a hackathon. The pivot to a 2D SVG body map with colored organ zones solved the same design problem in a fraction of the time. The constraint made the product better.
The anxiety problem. Health apps default to red for anything bad. Red spike on the glucose chart. Red alert for elevated heart rate. Red warning for poor sleep. Red is the color of medical emergency, not the color of "here's what to work on next." We built the entire palette around this: amber at the accelerating end, teal at the decelerating end, violet for calls to action. Red appears nowhere. The design philosophy isn't "hide the bad news." It's "frame everything as actionable information, never as alarm."
The ethics gap. Epigenetic data isn't explicitly protected under GINA. Life insurers are already exploring biological age for underwriting. Our early drafts barely mentioned this. The rebuild took it seriously: on-device processing where possible, end-to-end encryption, explicit no-sharing commitments with insurers and employers, full user-controlled deletion. Framing recommendations as empowerment rather than blame matters too, since epigenetic age correlates with poverty and pollution exposure, not just individual choices. The product has to hold that complexity.
The engagement collapse problem. Most health apps fail at 90 days. If you only give users quarterly feedback, they disengage. If you give them daily feedback with no periodic ground truth, they don't trust it. Metabolic Mirror is designed around three feedback cadences simultaneously: daily (metabolic stress score), weekly (composite trends), quarterly (epigenetic verification). When the next test arrives, the app compares its predictions to actual results, deepening trust when accurate and recalibrating transparently when not.
Accomplishments That We're Proud Of
The fan chart divergence is the moment we're most proud of. When a user toggles from "Current Habits" to an intervention in the Longevity Sandbox, the amber line stays visible while the teal line draws in and curves downward. The body map's organ zones shift from amber to teal. The mini gauge needle swings from 1.12× to 1.02×. The projected outcome label changes from "57.2–58.3 yr" to "54.5–55.1 yr." All of it happens in under a second, in one fluid cascade.
Two futures. One decision. Rendered spatially. That animation is the entire value proposition of the product, and it required getting the science, the design, and the engineering all right simultaneously.
We're also proud of the no-red principle and what it represents: a genuine commitment to building a health product that orients rather than alarms. Every design decision, the amber-to-teal spectrum, the uncertainty bands that widen honestly over time, the evidence grades visible on every projection, the verdict sentences that always end with an action, adds up to a product that leaves the user feeling more capable, not more anxious. That's harder to build than it sounds.
What We Learned
Scope cuts are product decisions. Every feature we removed made the core experience cleaner. The Longevity Sandbox only works as a demo moment because everything else stepped back to let it breathe.
Transparency is a feature. Showing uncertainty ranges instead of point estimates, grading evidence instead of flattening it to a single score, making the bridge engine logic visible and auditable, these choices make the product feel more trustworthy, not less confident.
The psychology is the product. The hardest problem wasn't the fan chart math or the SVG gauge animation. It was figuring out how to make a person who is aging faster than they should feel capable rather than panicked. Every color choice, every word of copy, every motion timing was in service of that single emotional outcome.
First principles take time but save time. Our planning went through a full teardown and rebuild before a line of code was written. That process felt slow. But it eliminated dead-end building by clarifying the actual problem first.
What's Next for The Mirror
The prototype answers one question for one persona. The full product is a platform.
Real device connections. The current build uses synthetic data for James, 52. The next step is live integrations: Oura and Apple Health APIs for wearables, Dexcom and Abbott APIs for CGM, and a structured upload pipeline for TruDiagnostic and Elysium epigenetic reports.
Validated projections. The bridge engine currently runs on published population-level effect sizes. With real longitudinal data, pairing daily metabolic signals with before/after epigenetic tests, we can validate and personalize those projections, tightening the confidence bands for individual users over time.
Women's health. Hormonal cycles interact directly with glucose variability and inflammatory markers. The current model treats these as noise. A women's health layer would model the luteal phase glucose response, perimenopause metabolic shifts, and HRT's documented effects on epigenetic pace, making Metabolic Mirror meaningfully more accurate for half the population.
Clinical decision support. The clinician persona, currently underserved, represents a natural growth path. A practitioner dashboard showing patient trajectories, intervention rankings, and projected epigenetic outcomes at the next test date would transform how longitudinal metabolic health is managed between annual appointments.
Health equity. Epigenetic age reflects cumulative environmental exposure: air quality, chronic stress, access to whole foods, not just individual choices. A responsible expansion of Metabolic Mirror would surface environmental contributors alongside behavioral ones, giving users and clinicians a more honest picture of what's driving the pace of aging and what levers are actually within reach.
Built With
- css
- d3.js
- javascript
- json
- react
- svg
- tailwind
- typescript
- vercel


Log in or sign up for Devpost to join the conversation.