-
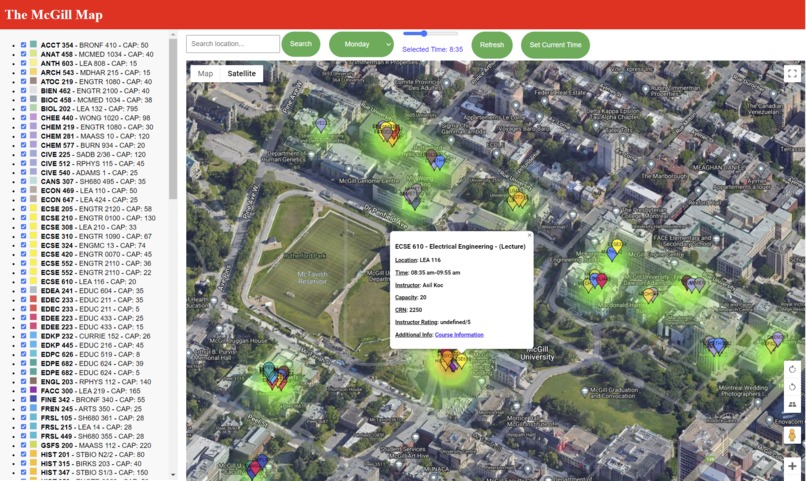
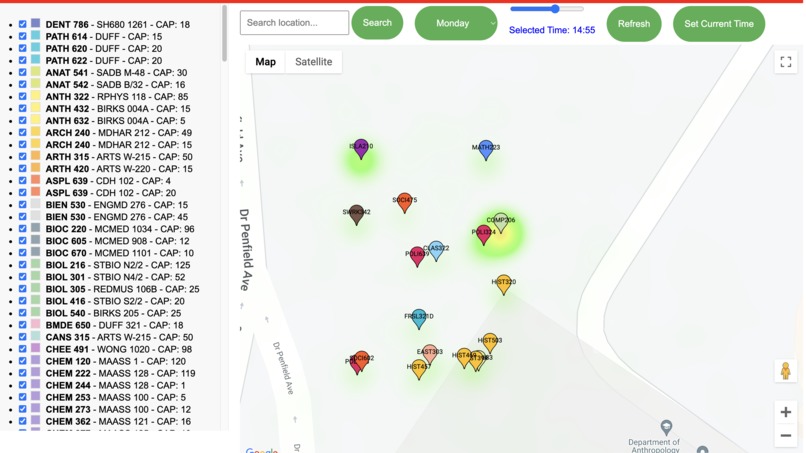
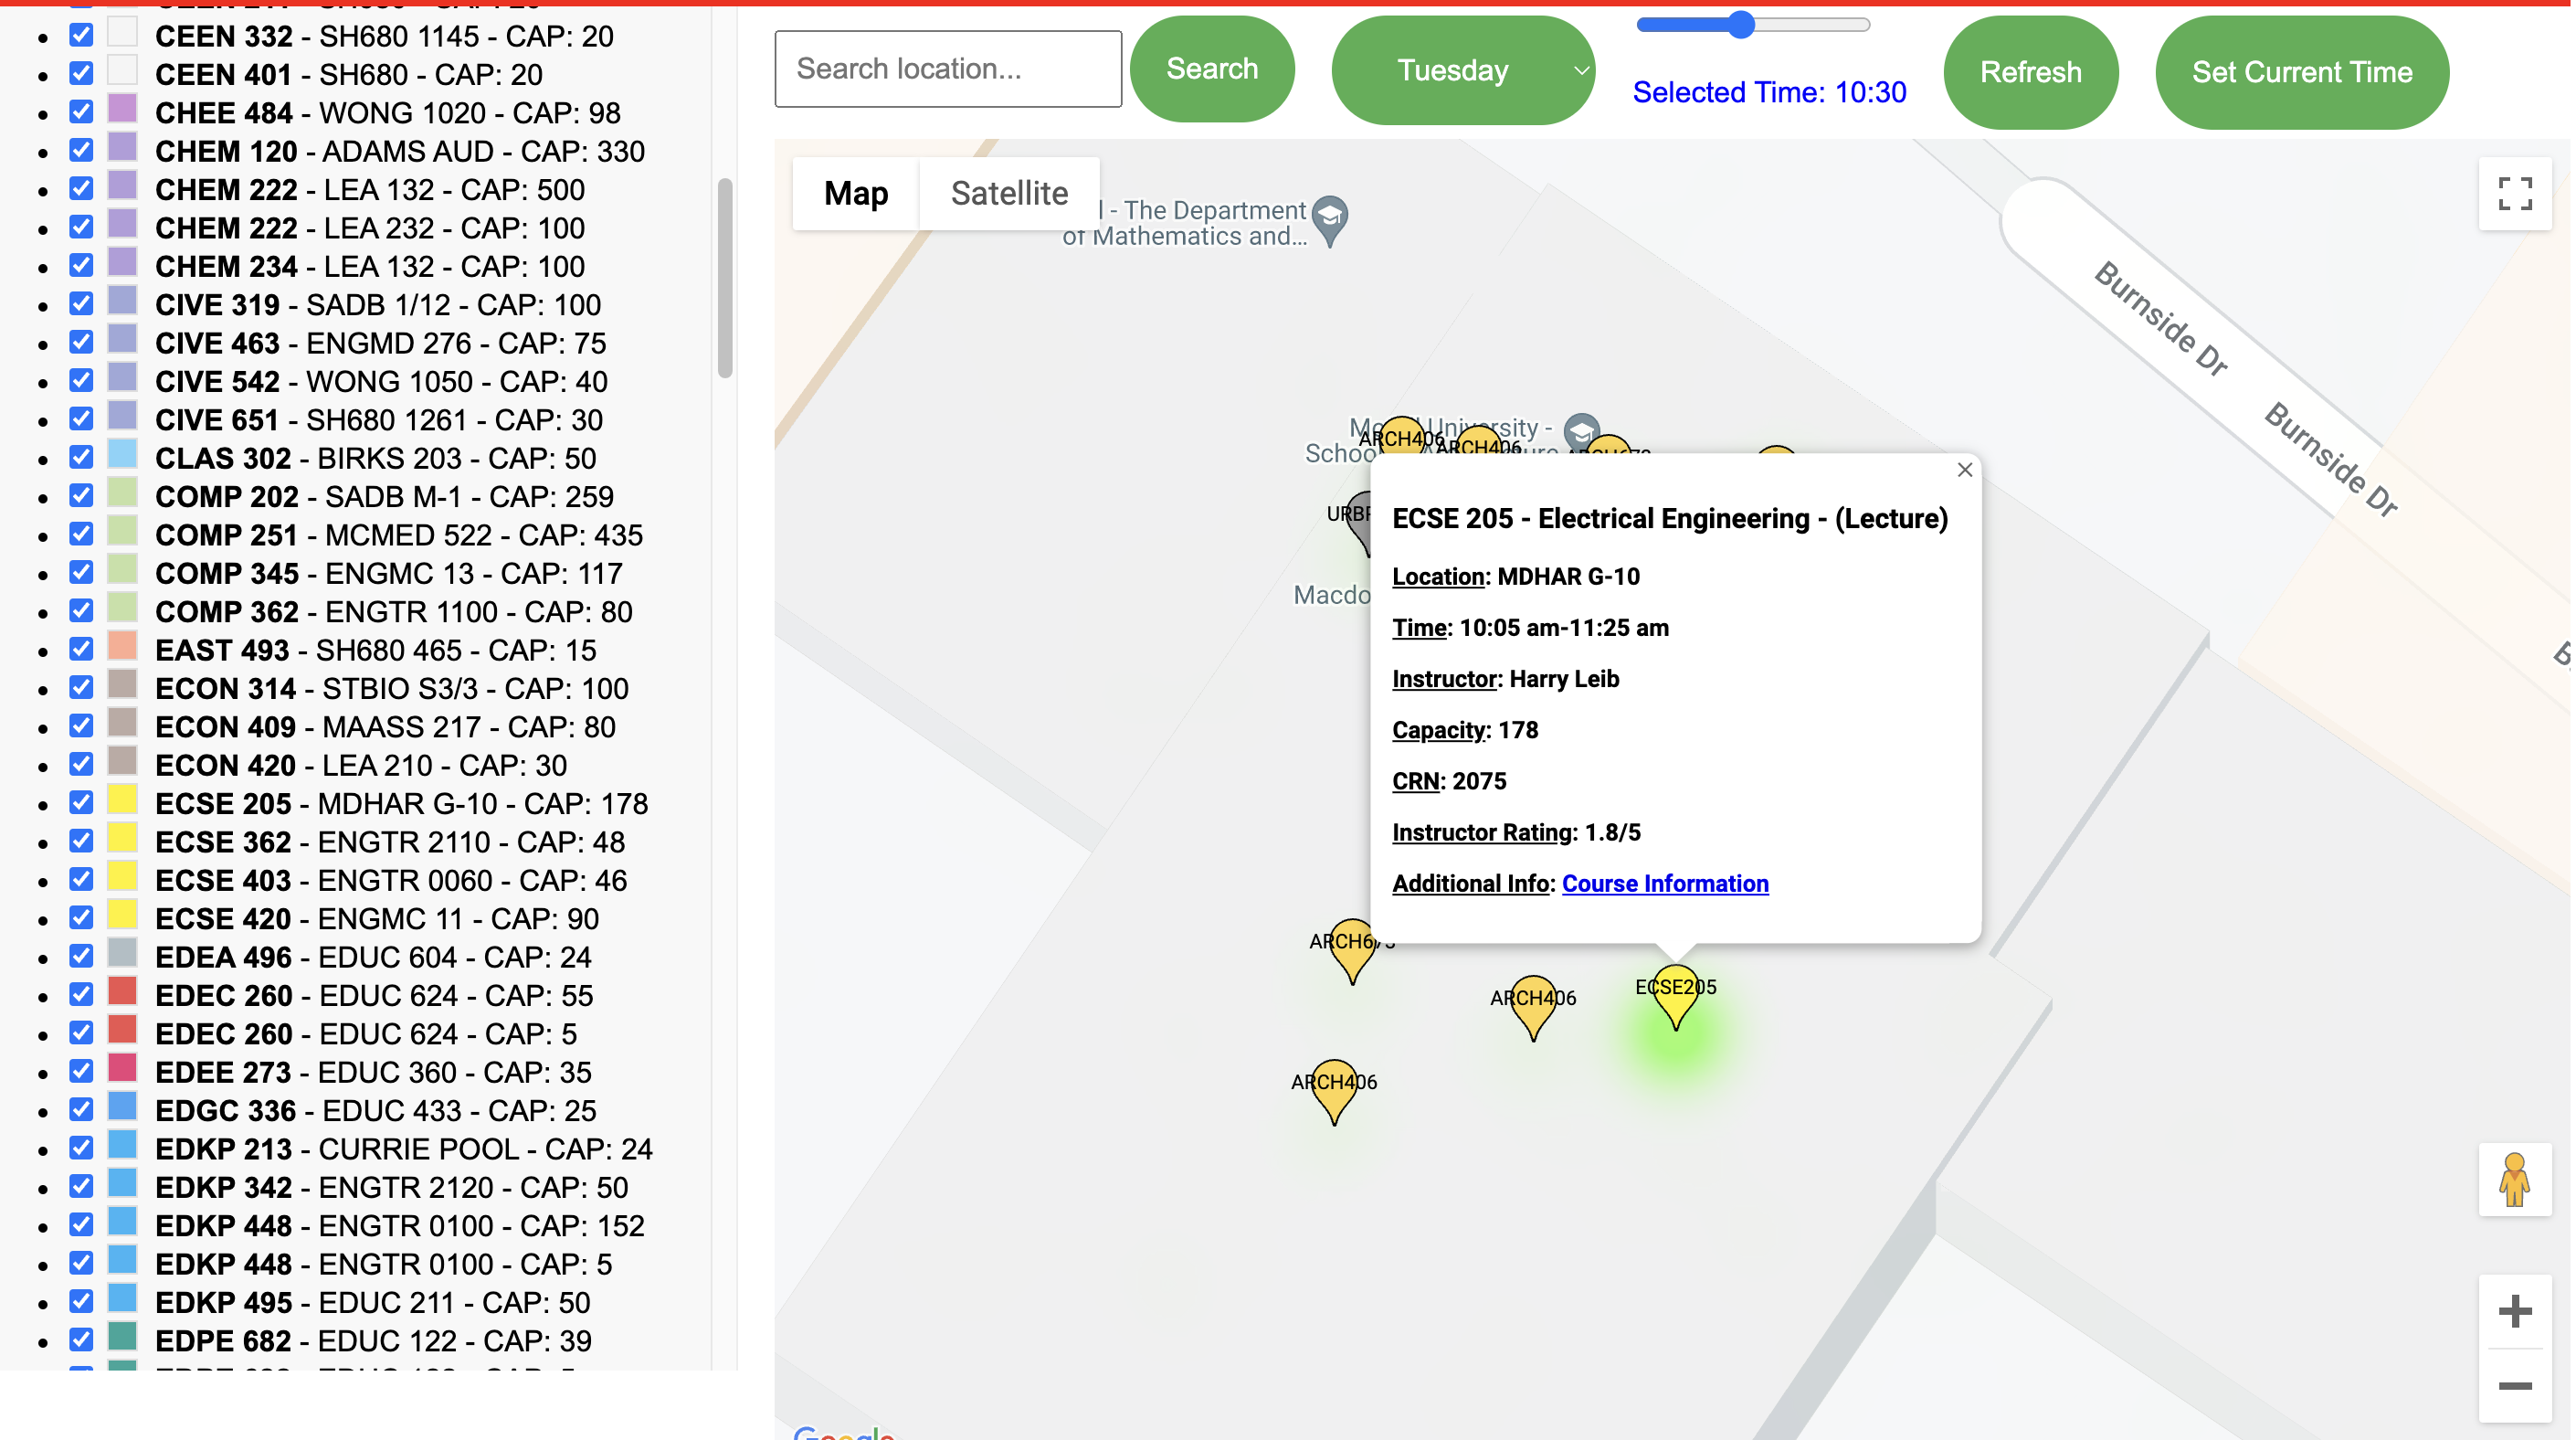
Satellite view with course info
-
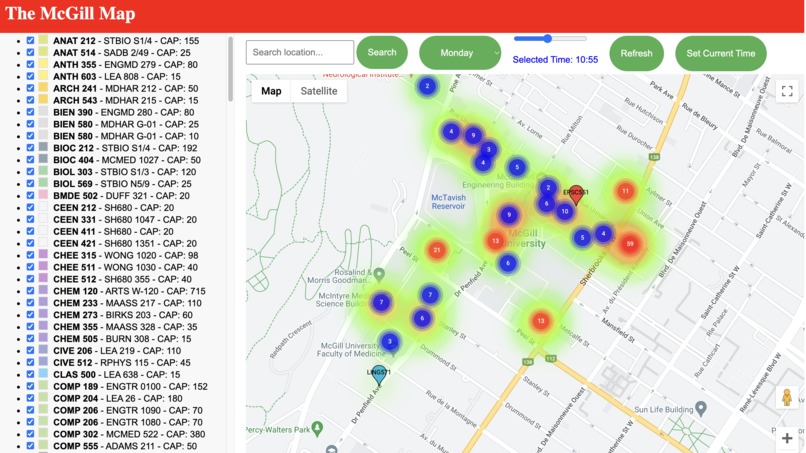
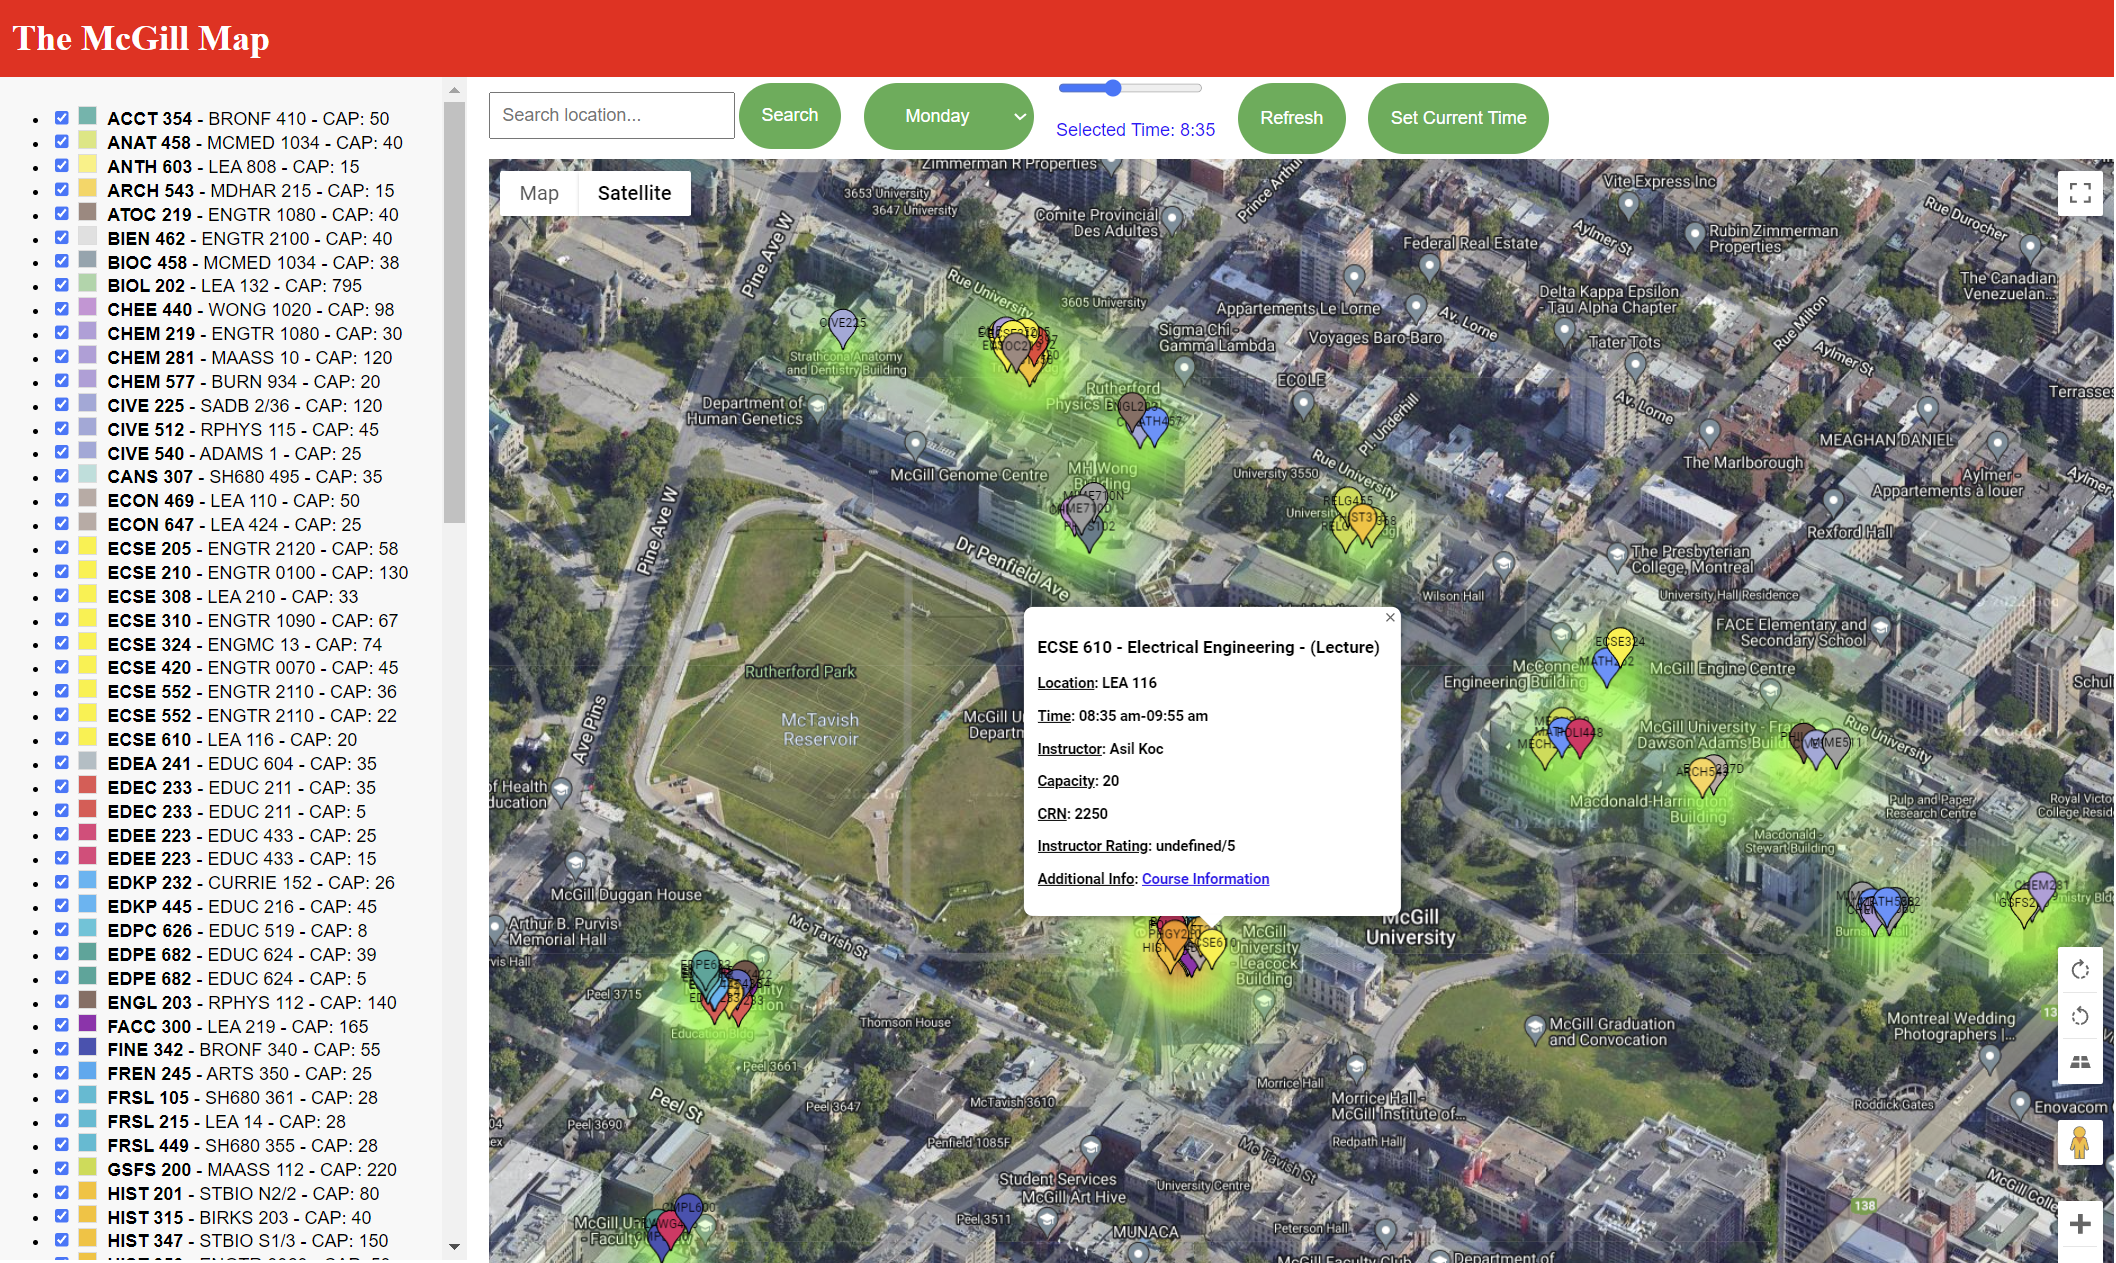
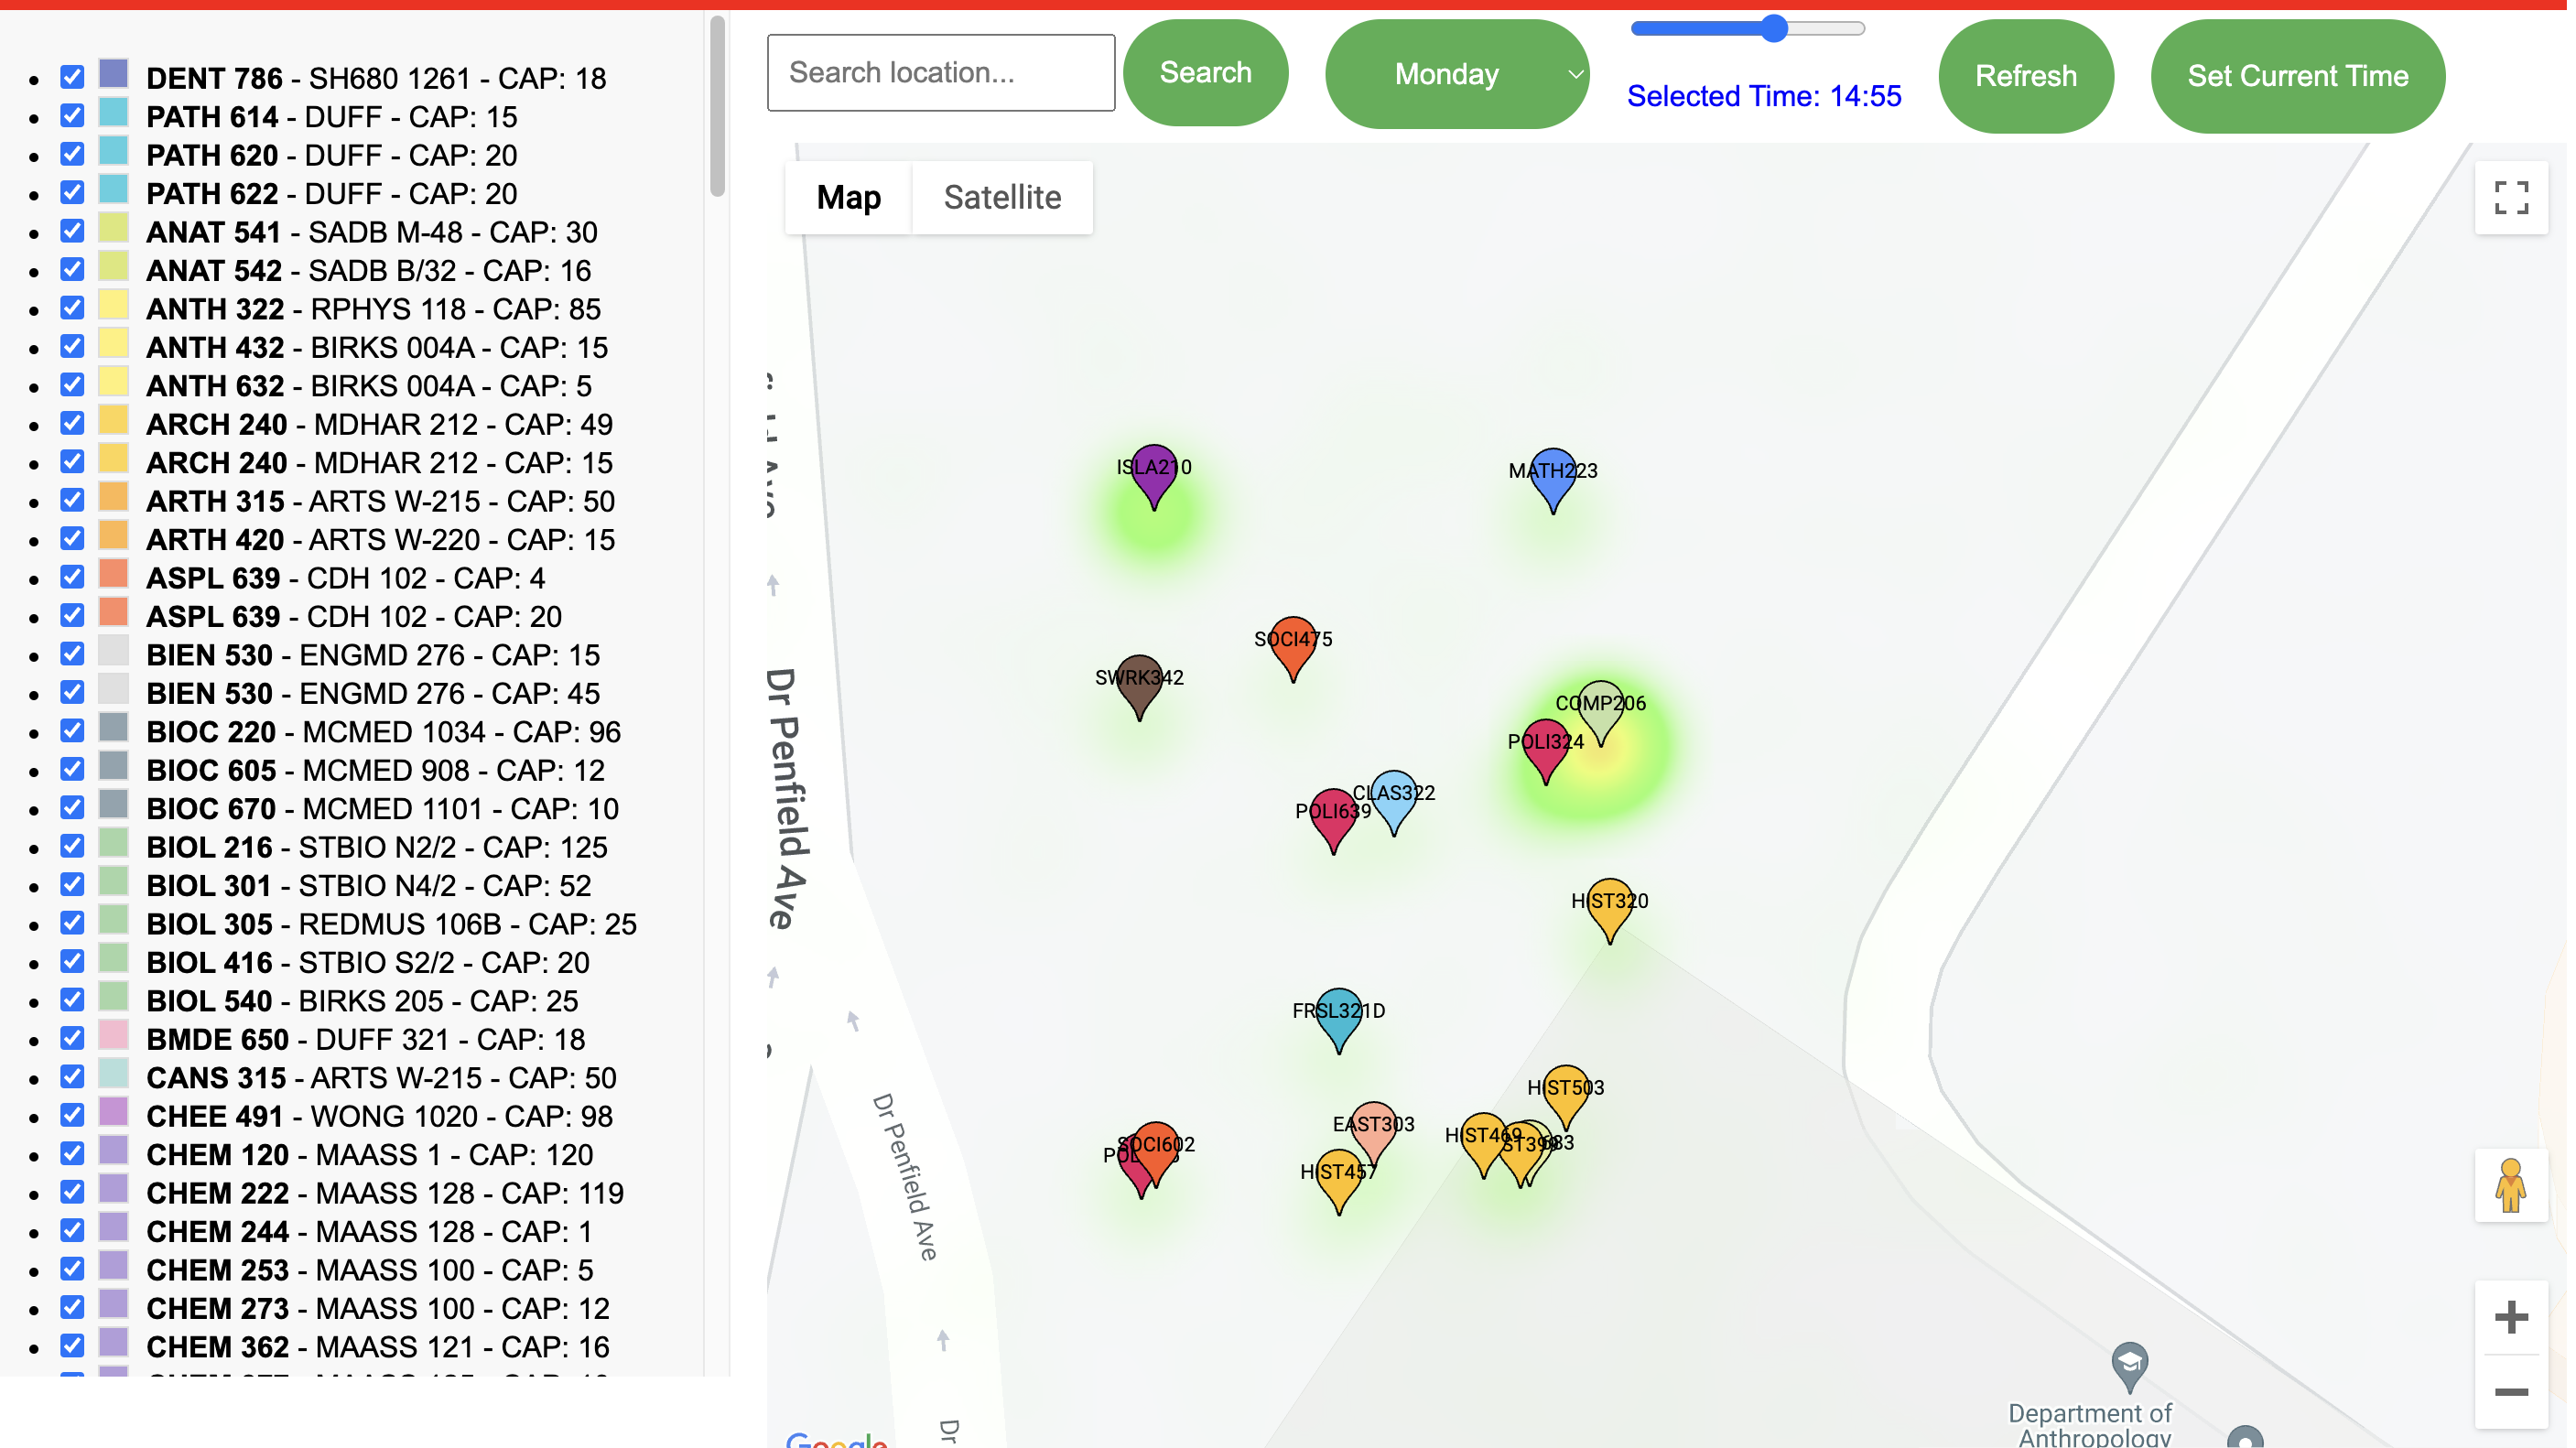
A zoomed out view of the map
-
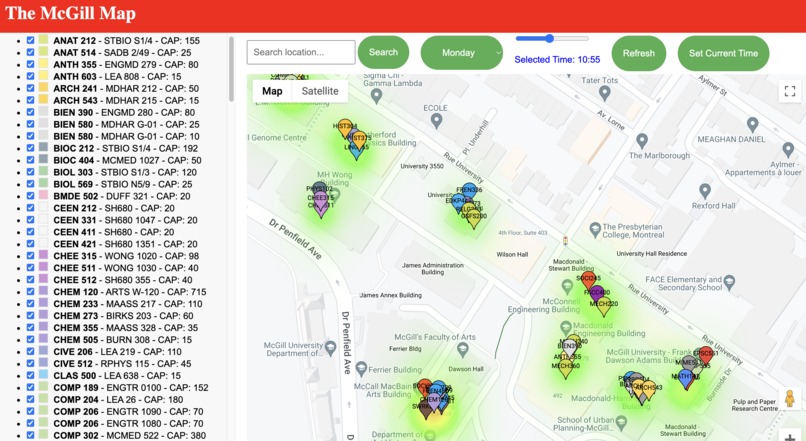
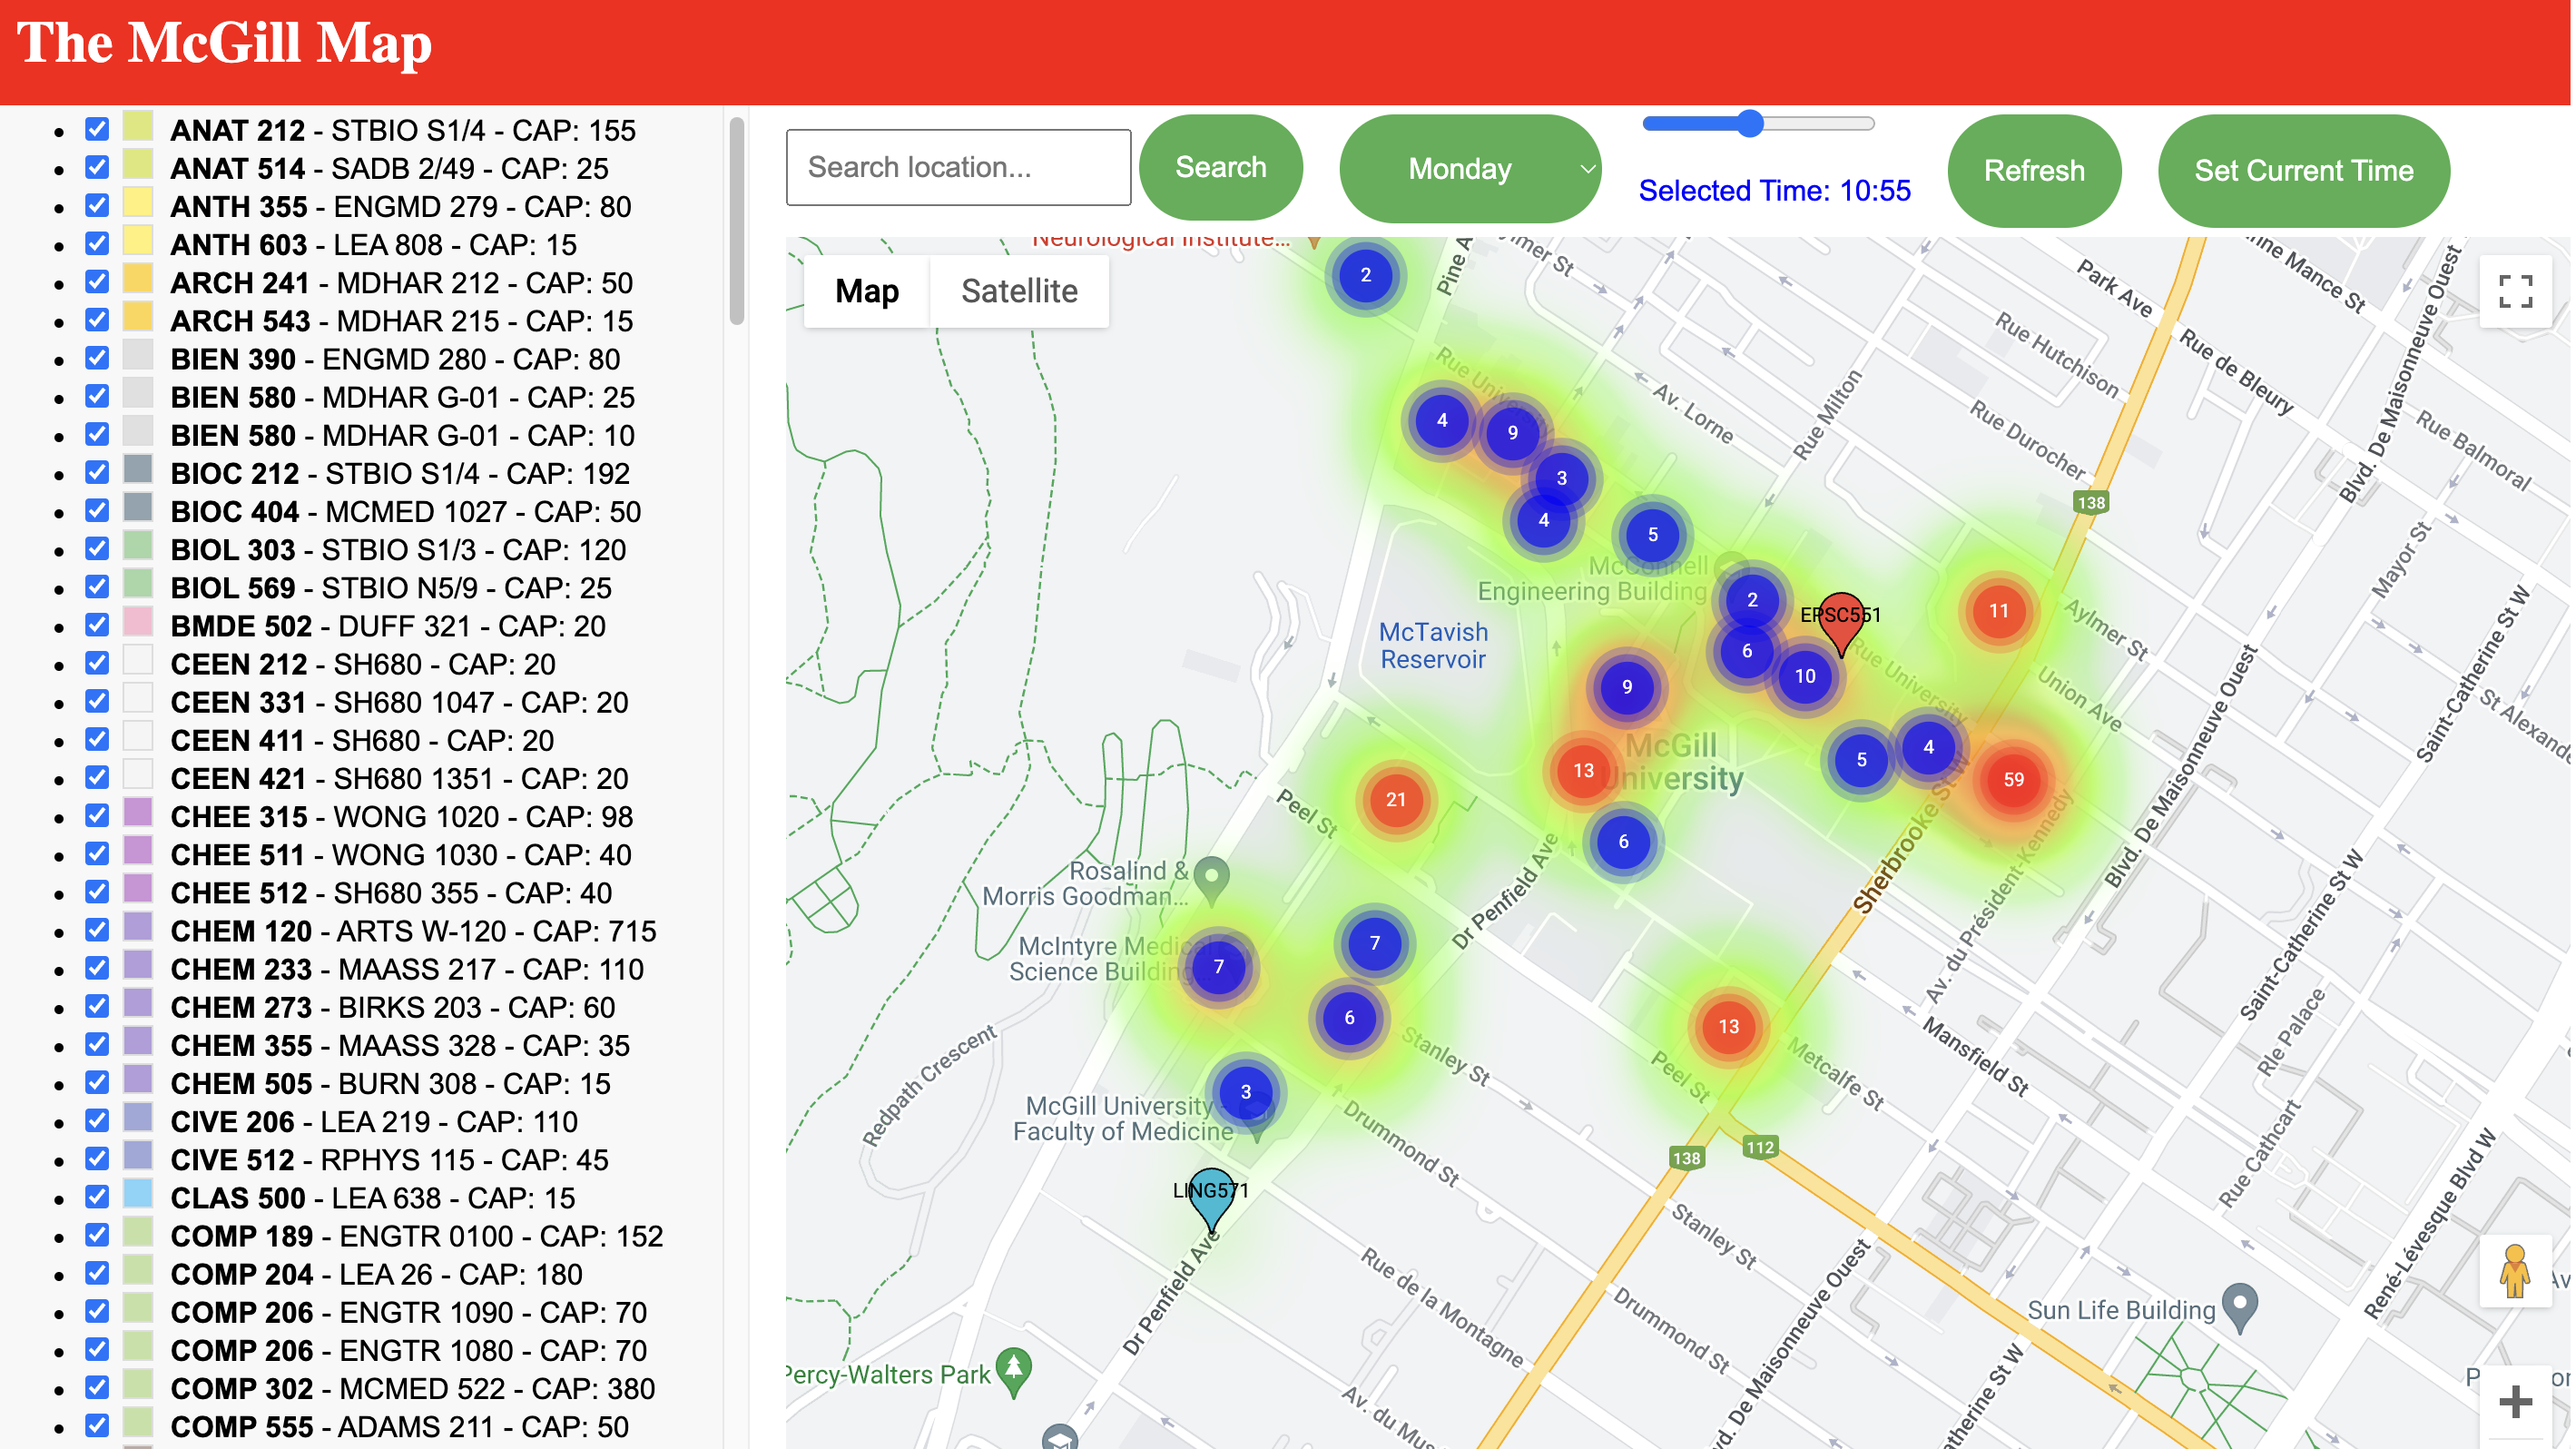
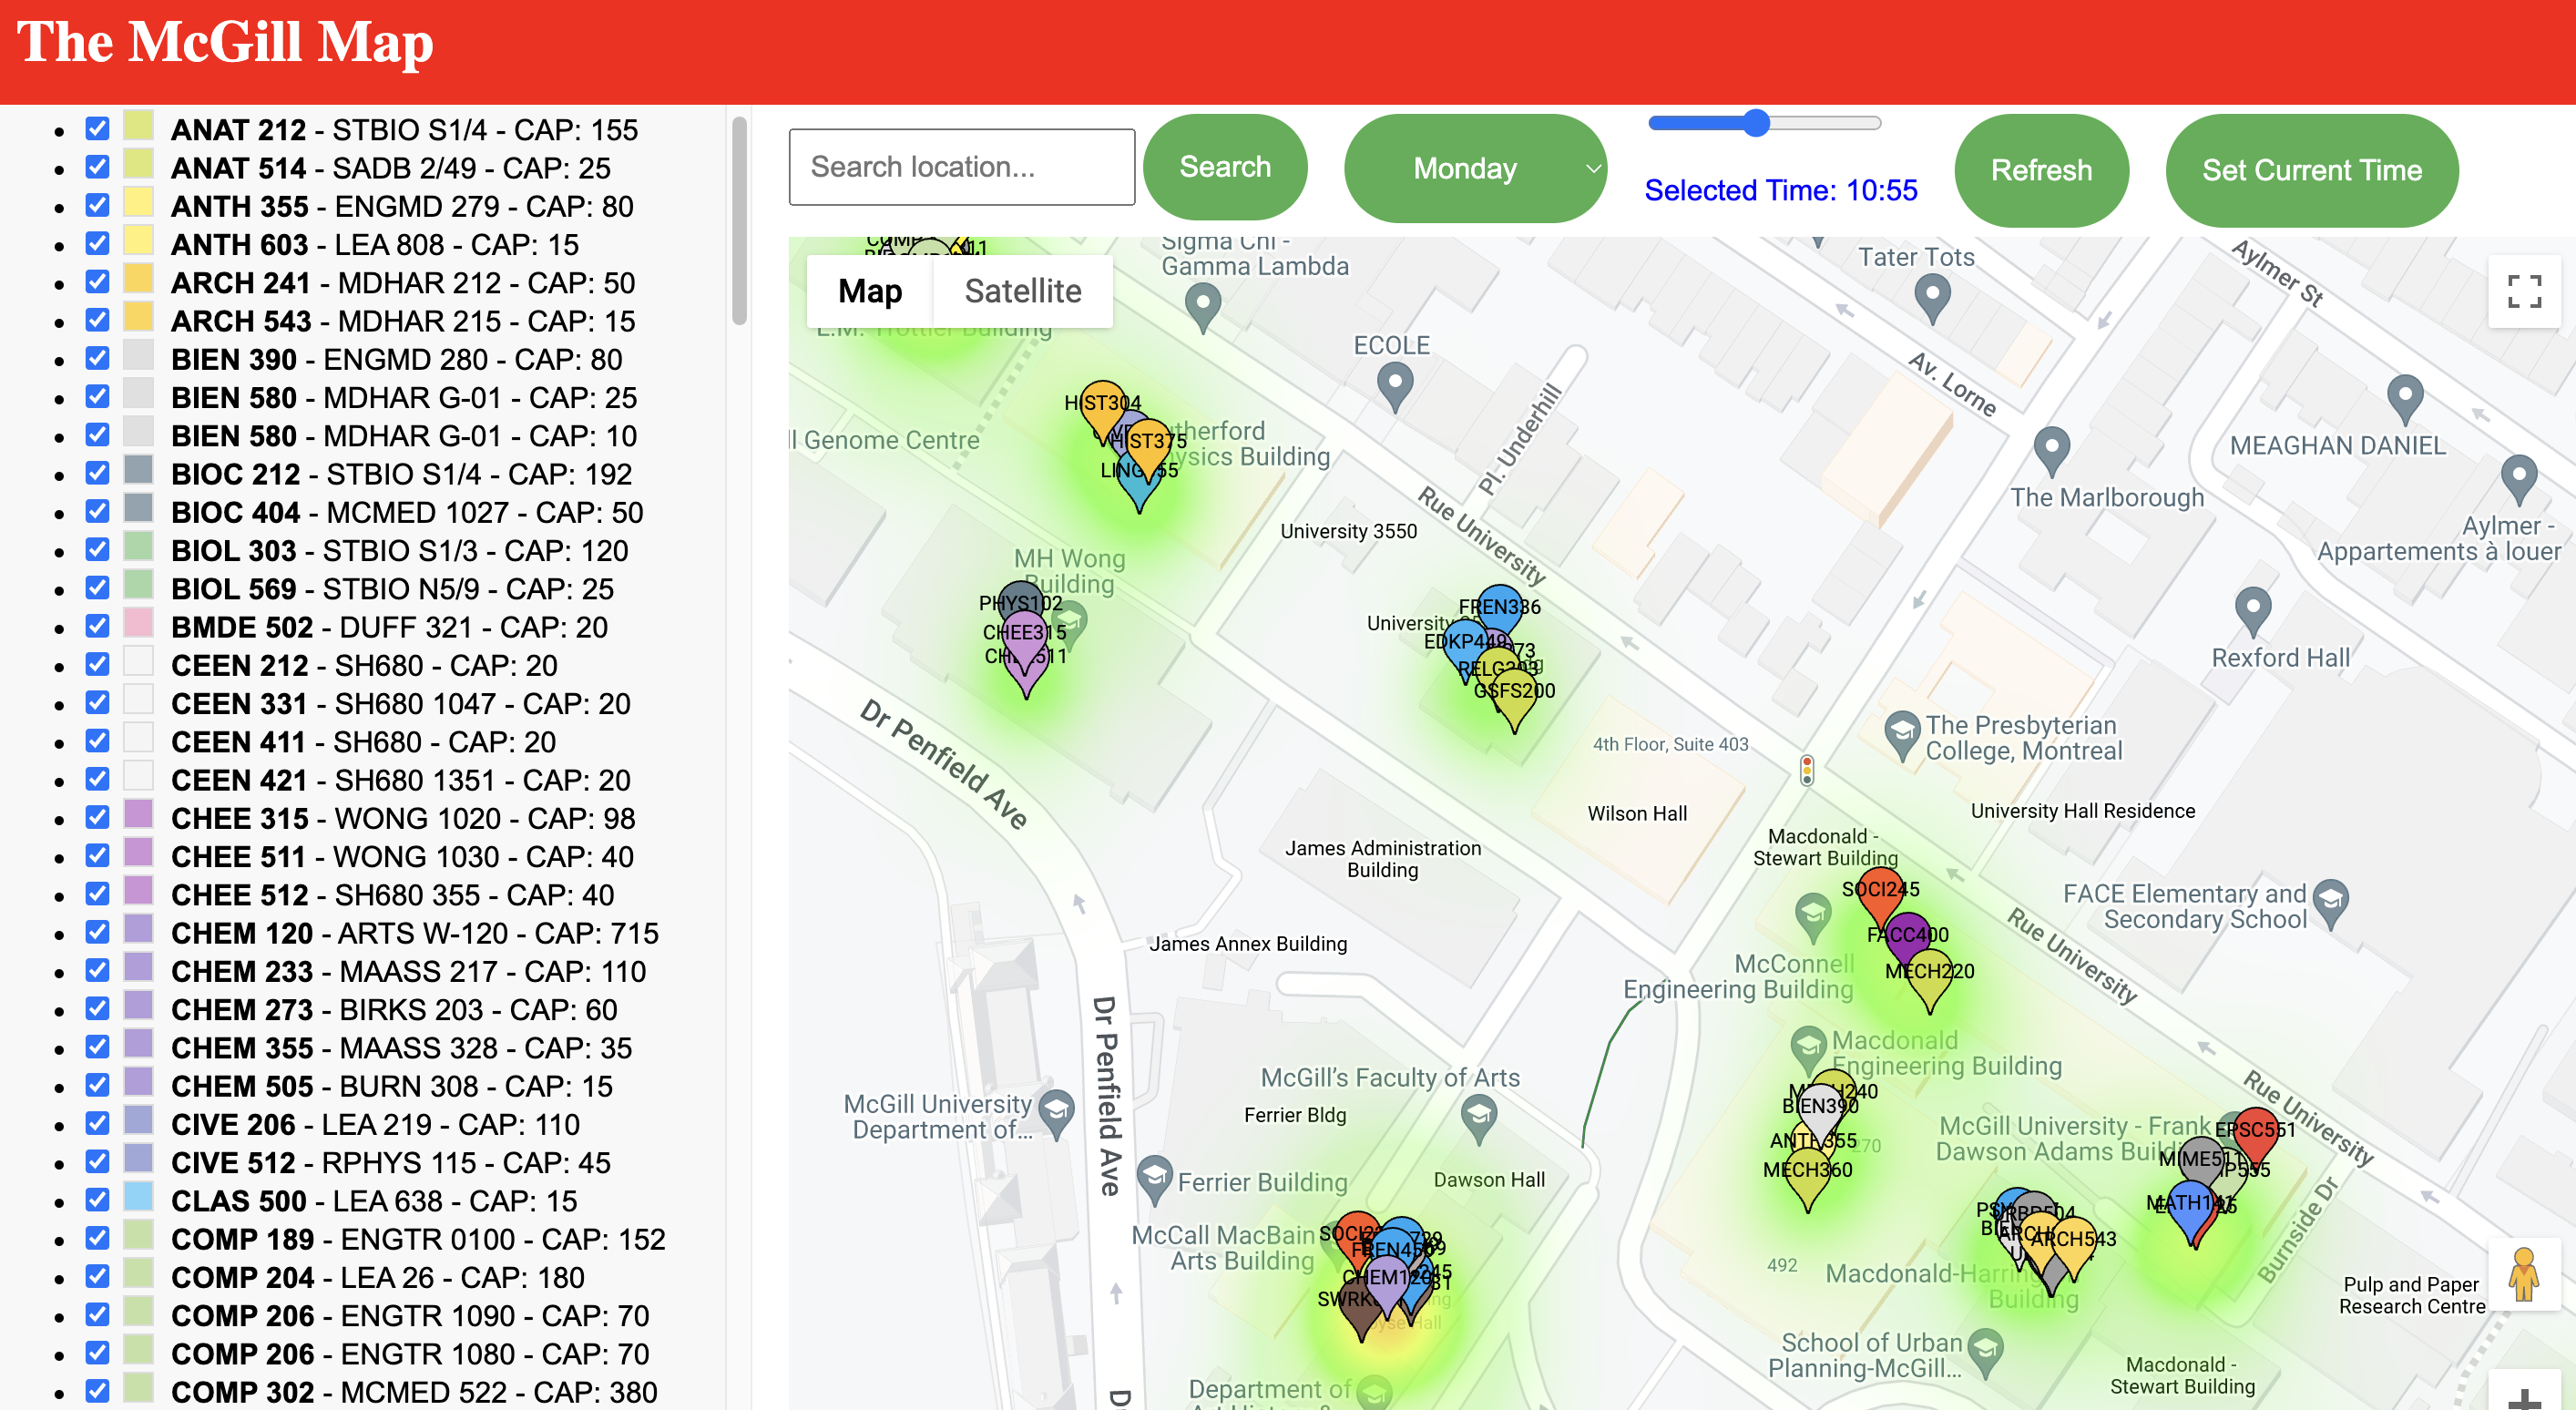
A more zoomed in view of the map
-
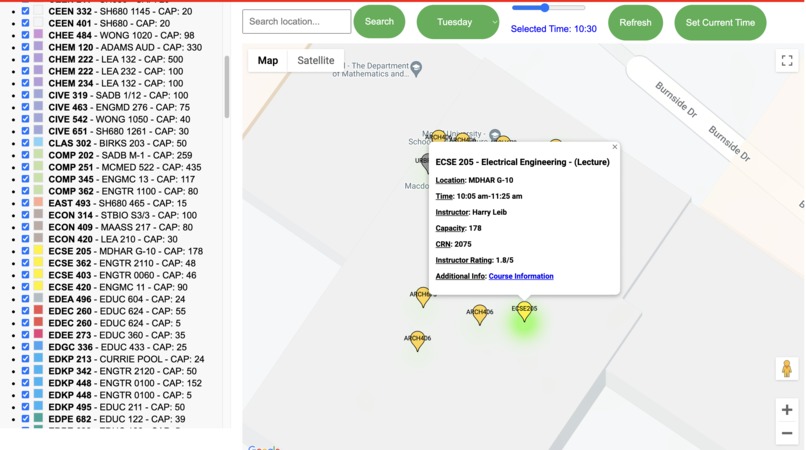
Selecting a course
-
A closeup of the heat map associated with number of students
Inspiration
We've always wanted to tackle a project that involved processing huge amounts of data. We also wanted to make a project that can help students at McGill explore and audit classes so that they can discover their interests.
What it does
The McGill map is a map that allows students to see all current courses taking place on the current day and time. Additionally, students can select their desired day and time and find the courses taking place.
How we built it
We did all the data analysis and manipulation using python and use a mySQL database to store it. We then used flask as a backend and integrated that with our frontend that we made with Svelte using TypeScript, HTML and CSS as well as the Google Maps Javascript API.
Challenges we ran into
The hardest part of this project was the huge amount of data we needed to collect and organize. Getting the data analysis working was definitely a challenge. Additionally, we are not used to frontend so getting everything set up took longer than expected.
Accomplishments that we're proud of
We're proud that we have a very usable project that is simple and easy to use by the end-user.
What we learned
We gained more data analysis skills as well as expanded our frontend knowledge as well as familiarity with the Google Cloud Platform.
What's next for The McGill Map
We think this project could be very useful to McGill students as well as administrators who would like an easier way to visualize activities taking place at McGill. We would love to take this project further and try to add more visualizations to the project such as traffic flow analysis using AI.


Log in or sign up for Devpost to join the conversation.