-
-

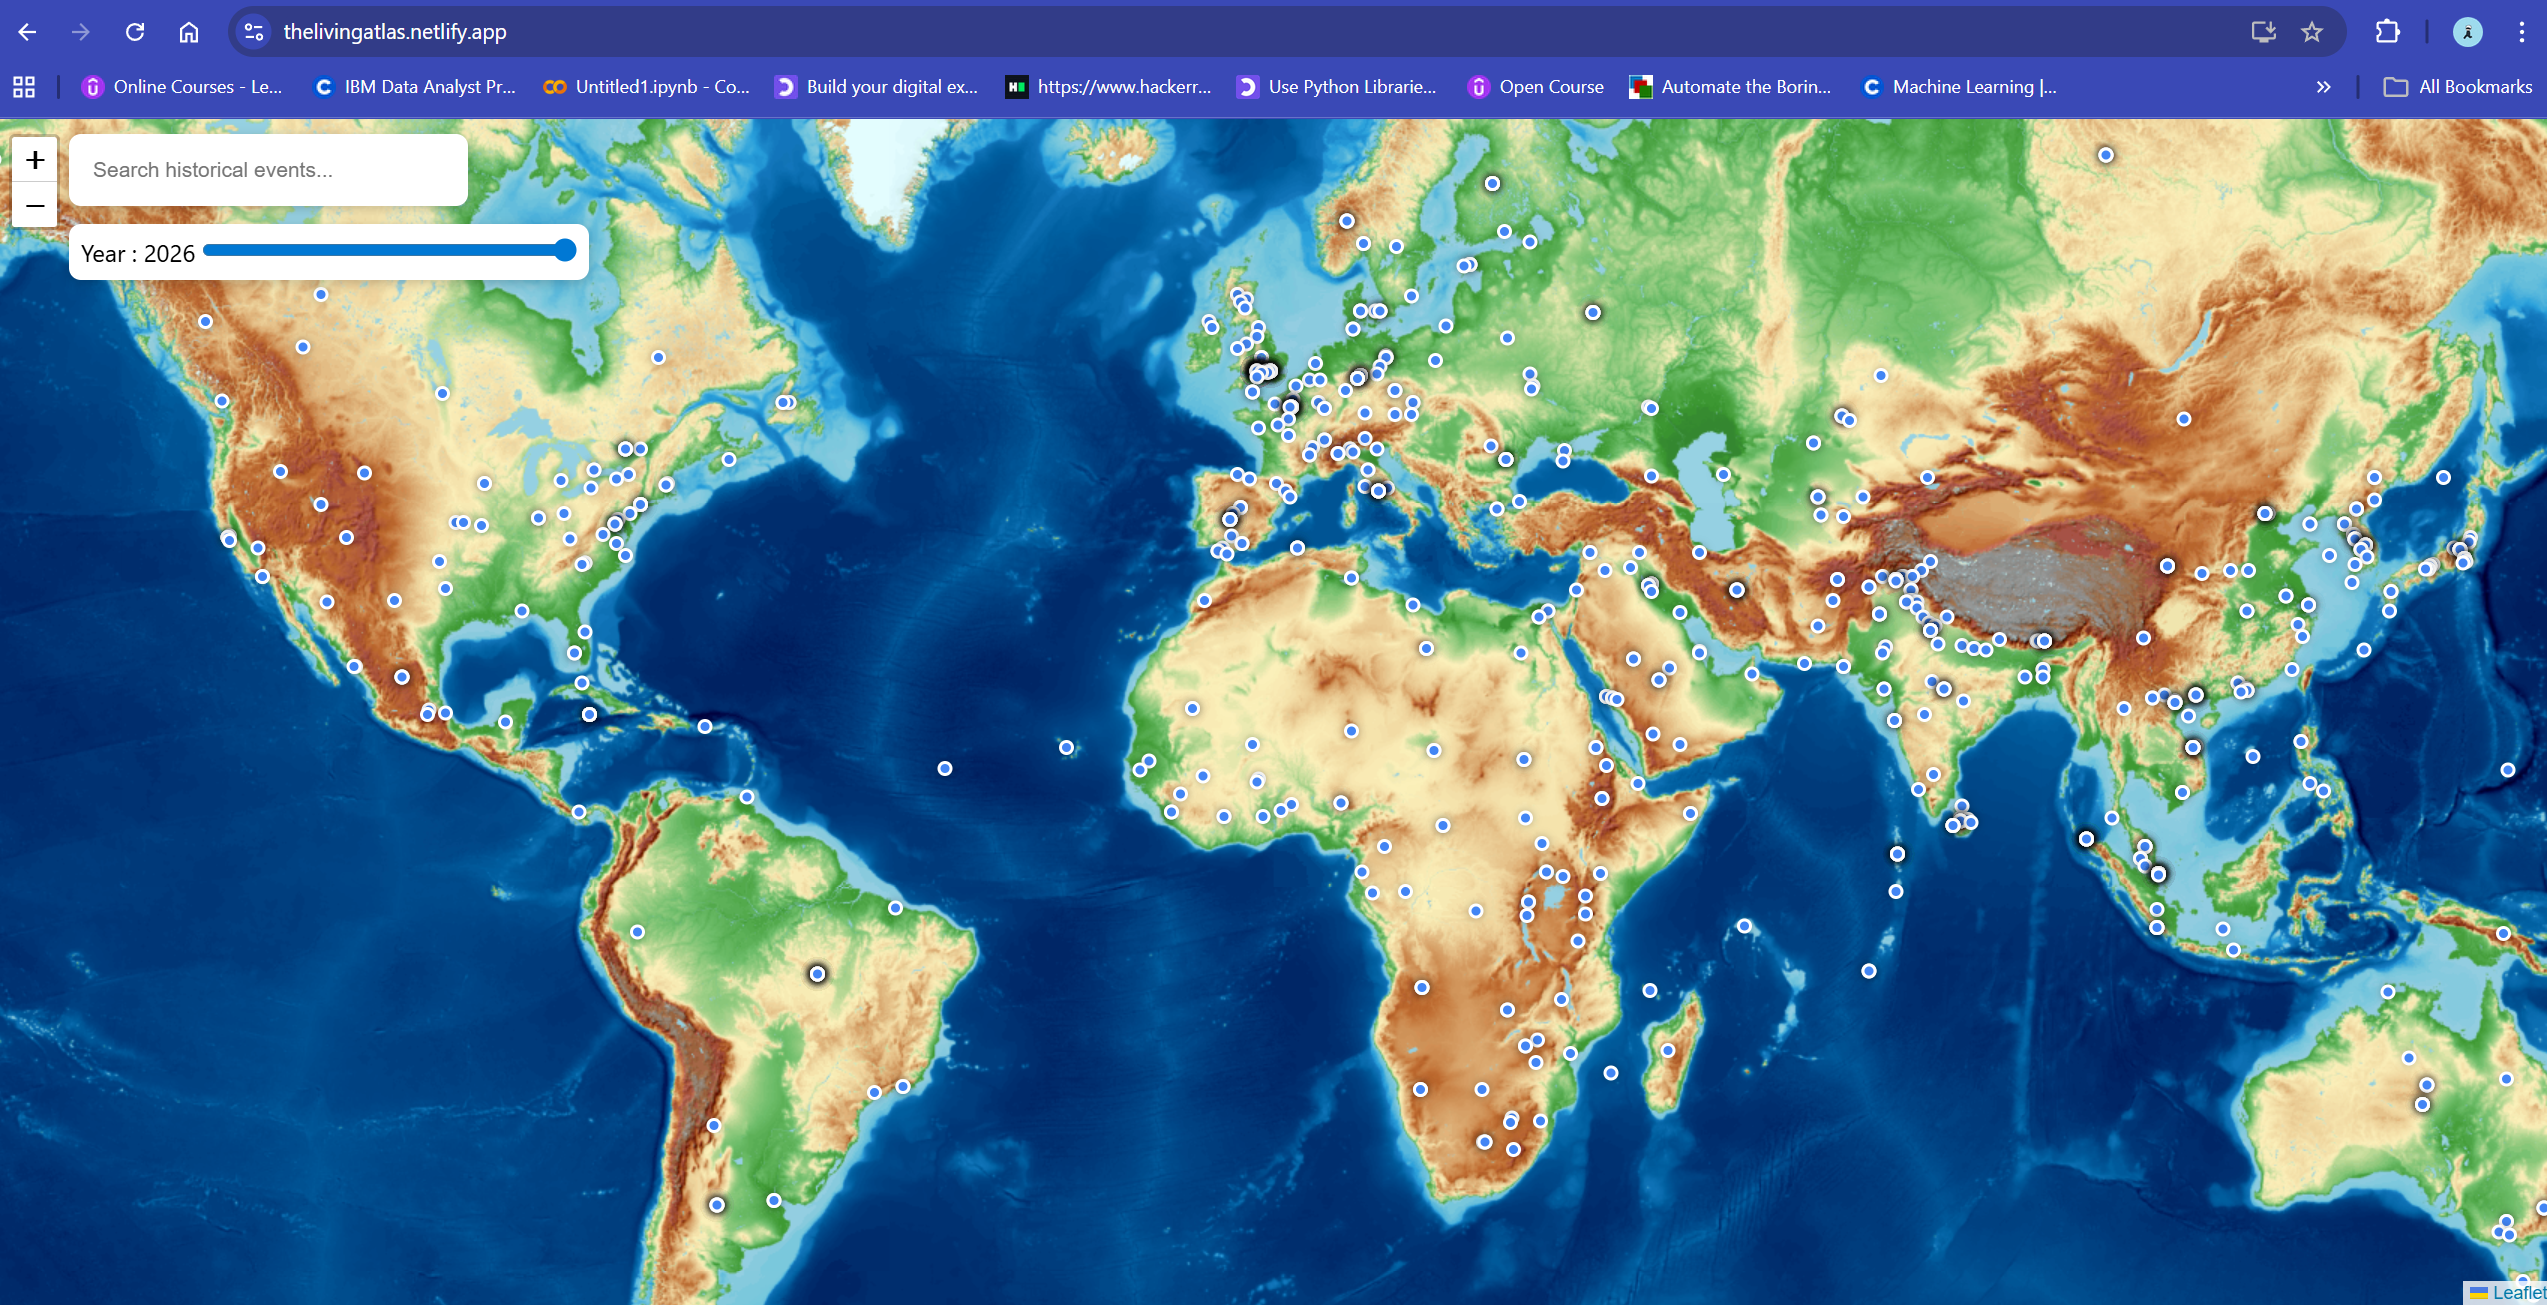
The webpage features a map displaying markers that highlight places of cultural importance.
-
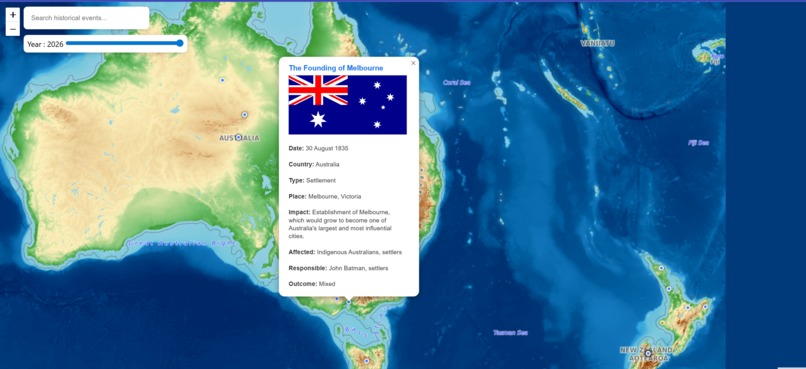
Each marker displays a summary of the historical event, along with a link to the corresponding Wikipedia page.
-

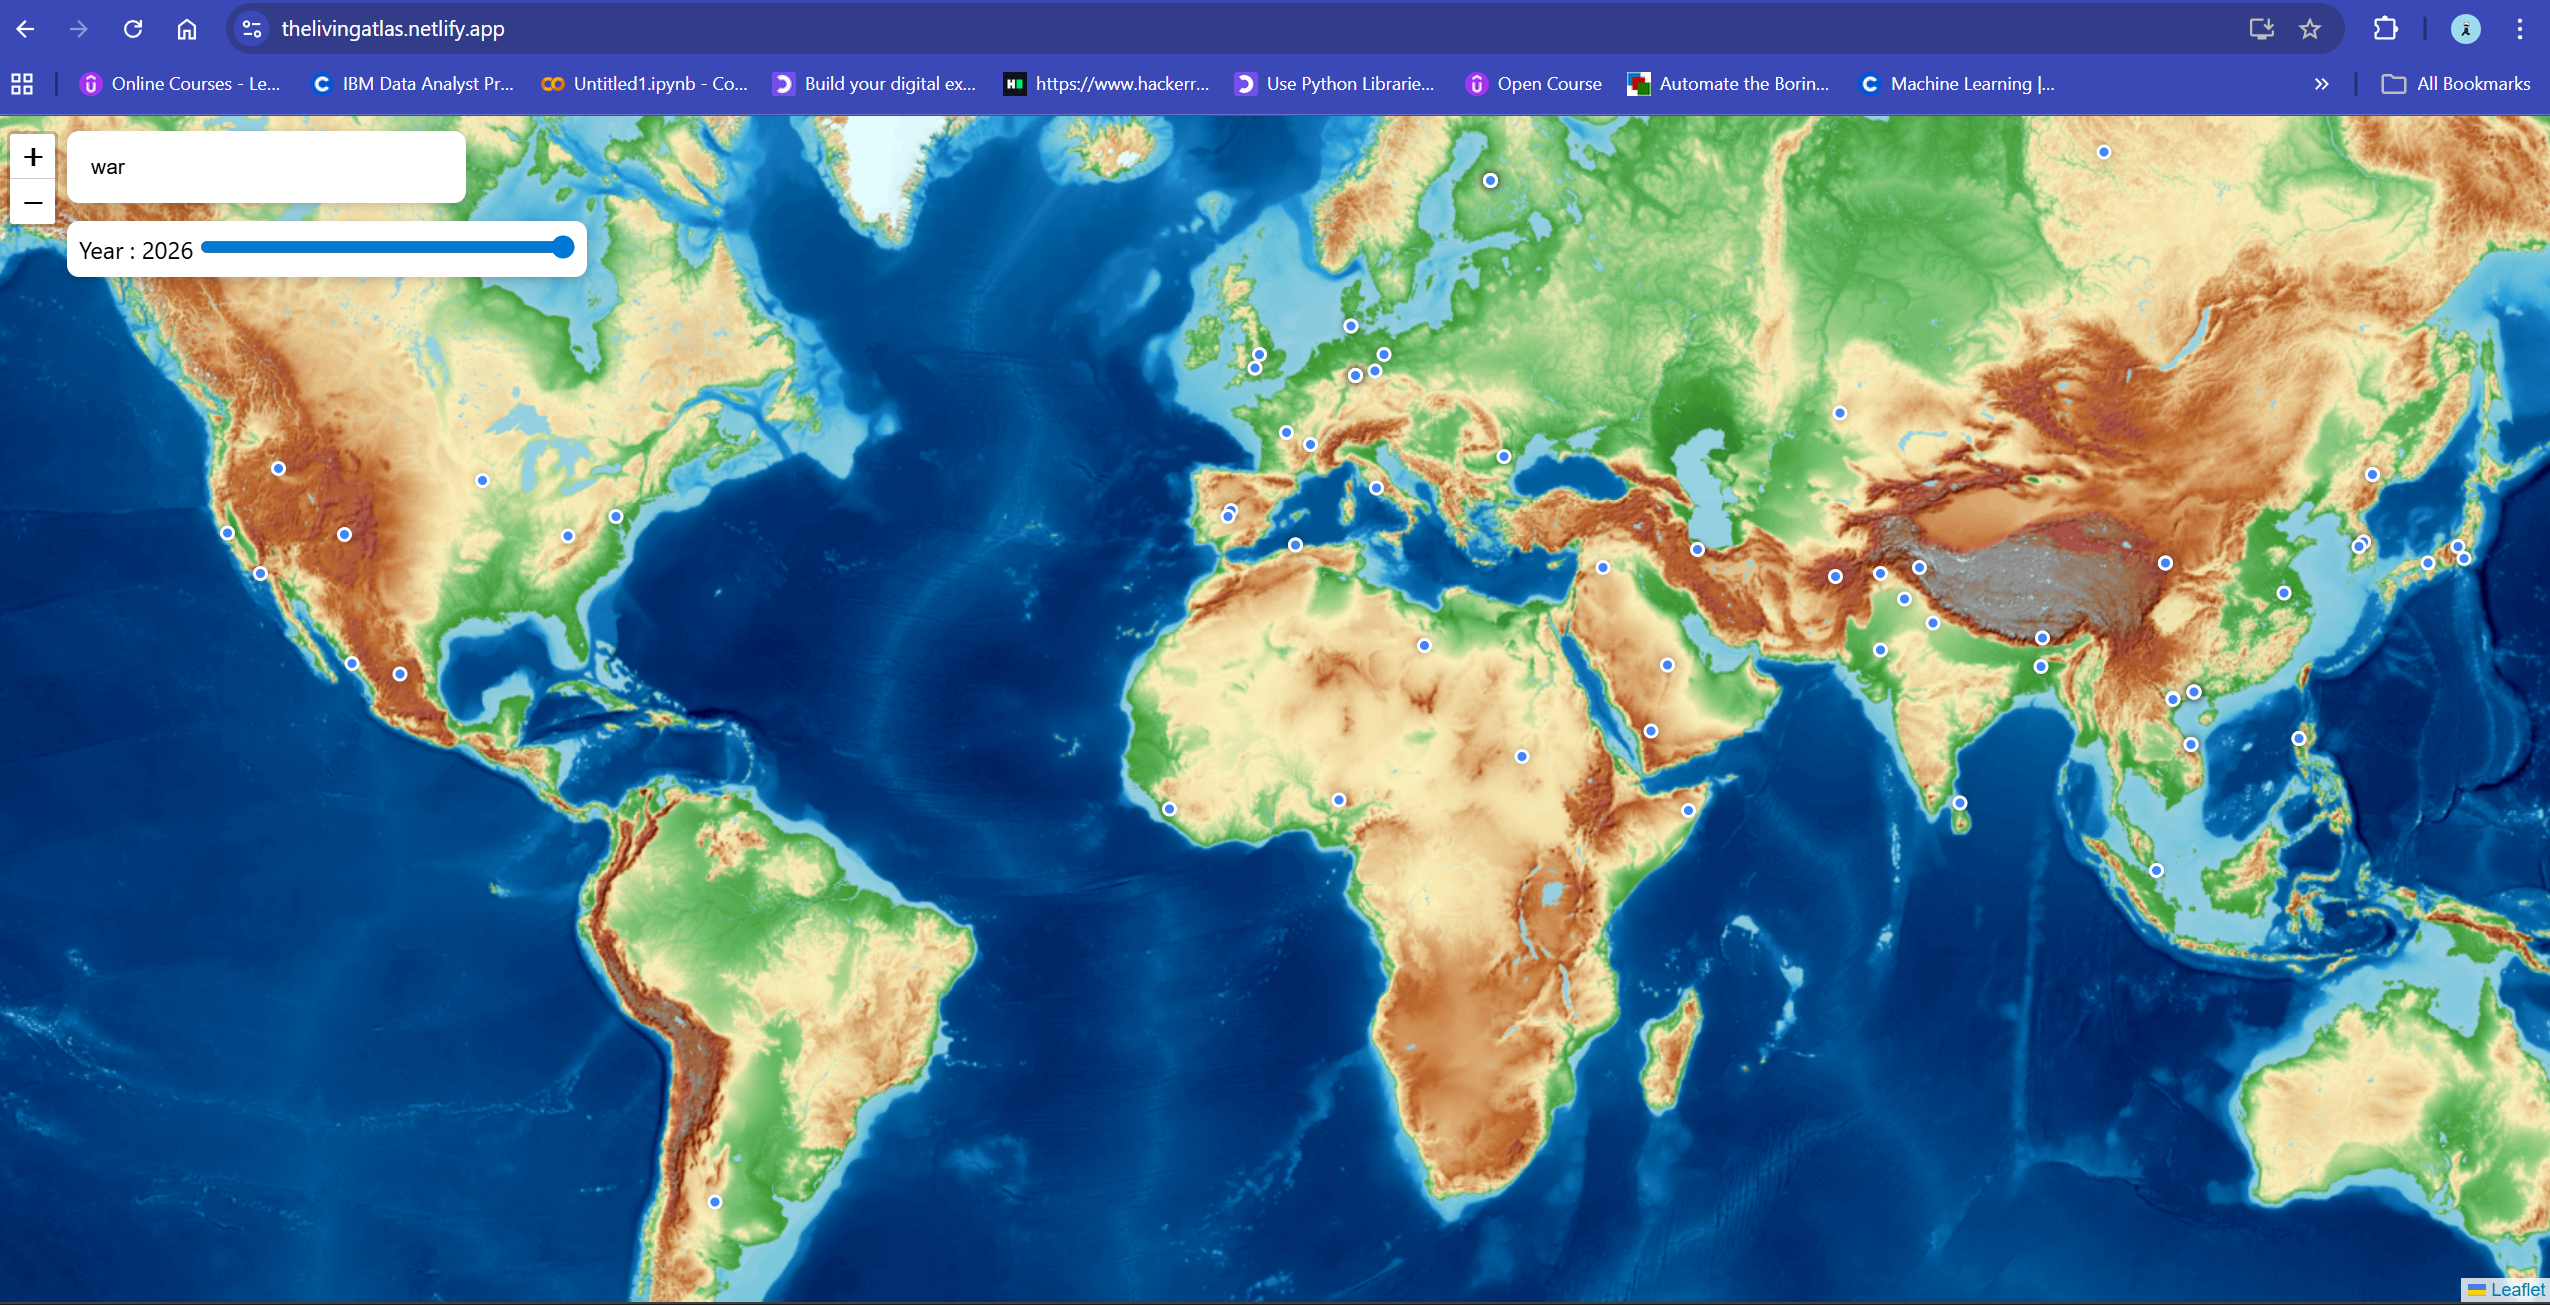
The search bar can be used to look up specific events. For example, in the screenshot, we have searched for all the wars that have occurred.
-
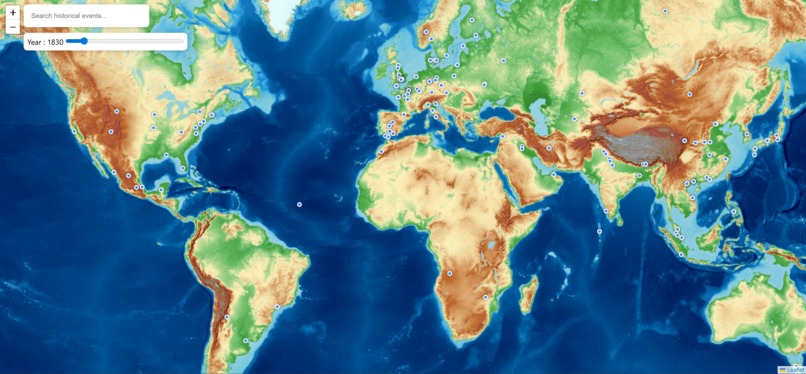
The time slider can be used to view events that occurred up to a specific point in time.


Inspiration
The inspiration for the Cultural Map Project came from studying how existing digital platforms preserve and present cultural and historical data, and identifying what they often lack.
Platforms like Wikipedia, digital museum archives, and mapping tools such as Google Maps already store vast amounts of cultural and historical information. However, while these systems are powerful, they often present data in a linear or text-heavy format, which makes it harder for users to feel the connection between events and the places where they happened.
This project was inspired by the idea that history is inherently spatial—every cultural moment is tied to a location on the map. By combining the clarity of maps with the depth of historical datasets, we aimed to improve how people interact with cultural knowledge.
What it does
The Cultural Map Project is an interactive web application that visualizes historical and cultural events on a global map.
It allows users to explore history spatially by interacting with markers placed on real-world locations where events occurred. Each marker opens a detailed popup containing information about the event, including its name, date, location, type, and historical context.
Users can also: Search for specific events (e.g., wars, discoveries, cultural movements) Explore events geographically using an interactive world map Filter events by time using a timeline slider to view history up to a selected year
Overall, the project transforms static historical data into an explorable, map-based storytelling experience, making cultural and historical knowledge more engaging and intuitive.
How we built it
We built the Cultural Map Project as a modern web application focused on turning historical datasets into an interactive, map-based experience.
The frontend was developed using React.js, allowing us to build a dynamic and component-based user interface. For the mapping system, we used React-Leaflet with Leaflet.js, which enabled smooth rendering of an interactive world map powered by OpenStreetMap tiles.
To bring real historical data into the project, we used a CSV dataset of cultural and historical events (sourced from Kaggle).
Each event was then mapped using its latitude and longitude coordinates, allowing us to place markers accurately on the world map. These markers are interactive and display detailed popups when clicked.
Challenges we ran into
One of the biggest challenges in this project was working with the historical events dataset itself and transforming it into a format suitable for mapping and interaction.
The original dataset only included place names (e.g., cities, regions, or historical references) but did not provide latitude and longitude coordinates, which are essential for plotting points on a map. To solve this, we built a custom geocoding pipeline using the OpenStreetMap Nominatim API to convert each place name into geographic coordinates using python. The dataset also required preprocessing to ensure: Valid place name formatting Removal of empty or null entries Consistent structure across all event records Without this step, the geocoding results were unreliable.
We faced several technical challenges while building the application, particularly around integrating the data with the React-Leaflet map and ensuring smooth, responsive performance. Rendering a large number of interactive markers led to performance concerns and visual clutter, which required careful optimization and filtering before display. Implementing real-time search functionality also proved challenging, as we had to properly synchronize user input with dynamic updates to the map without causing lag or unnecessary re-renders. In addition, managing React state across components such as the map, search bar, and event popups required thoughtful structuring to keep the application stable and responsive. Ensuring that all markers rendered correctly and that the UI remained consistent under different filtering conditions took multiple iterations of debugging and refinement.
Accomplishments that we're proud of
One of our biggest accomplishments was successfully transforming a static historical dataset into a fully interactive, map-based storytelling experience that allows users to explore cultural and historical events visually across the world. We are particularly proud of building a smooth and responsive integration between the dataset, search functionality, and the React-Leaflet map, enabling real-time filtering and dynamic marker updates without breaking performance. Another key achievement was designing an intuitive user experience where each marker provides meaningful context through popups, making historical data more engaging and accessible. We also successfully implemented a reliable data pipeline that processes and prepares large-scale event data for visualization, along with overcoming multiple technical challenges in rendering, state management, and UI consistency. Overall, we are proud that the project not only works as a functional prototype but also effectively demonstrates how technology can make cultural preservation more interactive, visual, and impactful.
What we learned
Through building the Cultural Map project, we gained valuable experience in working with real-world datasets and transforming them into meaningful visual experiences. We learned how to process and structure data for geospatial visualization, and how to integrate external APIs with a frontend application to enrich raw information. On the development side, we improved our understanding of React.js, especially state management and component interaction, as well as working with mapping libraries like React-Leaflet to build interactive and responsive map-based interfaces. We also learned the importance of performance optimization when handling large datasets and dynamic UI updates, along with debugging complex issues involving rendering, filtering, and synchronization between components. Overall, the project helped us strengthen both our technical and problem-solving skills while showing us how data, design, and storytelling can come together to create engaging digital experiences.
What's next for The Living Atlas
The next phase of The Living Atlas focuses on making historical exploration more intelligent, personalized, and action-oriented.
We plan to introduce search by country and place, allowing users to instantly filter and explore events tied to specific regions around the world. This will enable a more intuitive geographic entry point into history, helping users move seamlessly from global overviews to local detail.
Building on this, we aim to integrate AI-generated summaries for each historical event, which will dynamically simplify and enrich context. These summaries will make complex historical narratives easier to understand at a glance while still preserving depth for users who want to explore further.
We also plan to extend the platform beyond events by adding monuments, museums, and cultural landmarks connected to historical narratives. This will allow users to explore real-world sites tied directly to the stories they are viewing, bridging the gap between digital history and physical locations.
To make this experience more practical and immersive, we will implement route and distance features, enabling users to find the shortest or most convenient paths to visit selected historical sites. This transforms exploration into actionable travel planning, not just passive discovery.
In addition, we will improve the user interface (UI/UX) to make exploration more fluid and visually engaging. This includes cleaner map interactions, improved filters, better timeline navigation, and a more intuitive event-to-location linking system. The goal is to reduce cognitive load while increasing exploration depth.
To support performance and scalability, we will also optimize map loading speed and responsiveness. This can be achieved through techniques such as data clustering for dense regions, lazy loading of map tiles and event layers, caching frequently accessed geographic data, and prioritizing visible-region rendering. These improvements will ensure smooth navigation even when handling large-scale historical datasets.
Overall, these enhancements will transform The Living Atlas from a passive visualization tool into an interactive cultural discovery system—where users can not only explore history, but also understand it instantly, navigate it spatially, and connect with it in the real world.

Log in or sign up for Devpost to join the conversation.