-
-

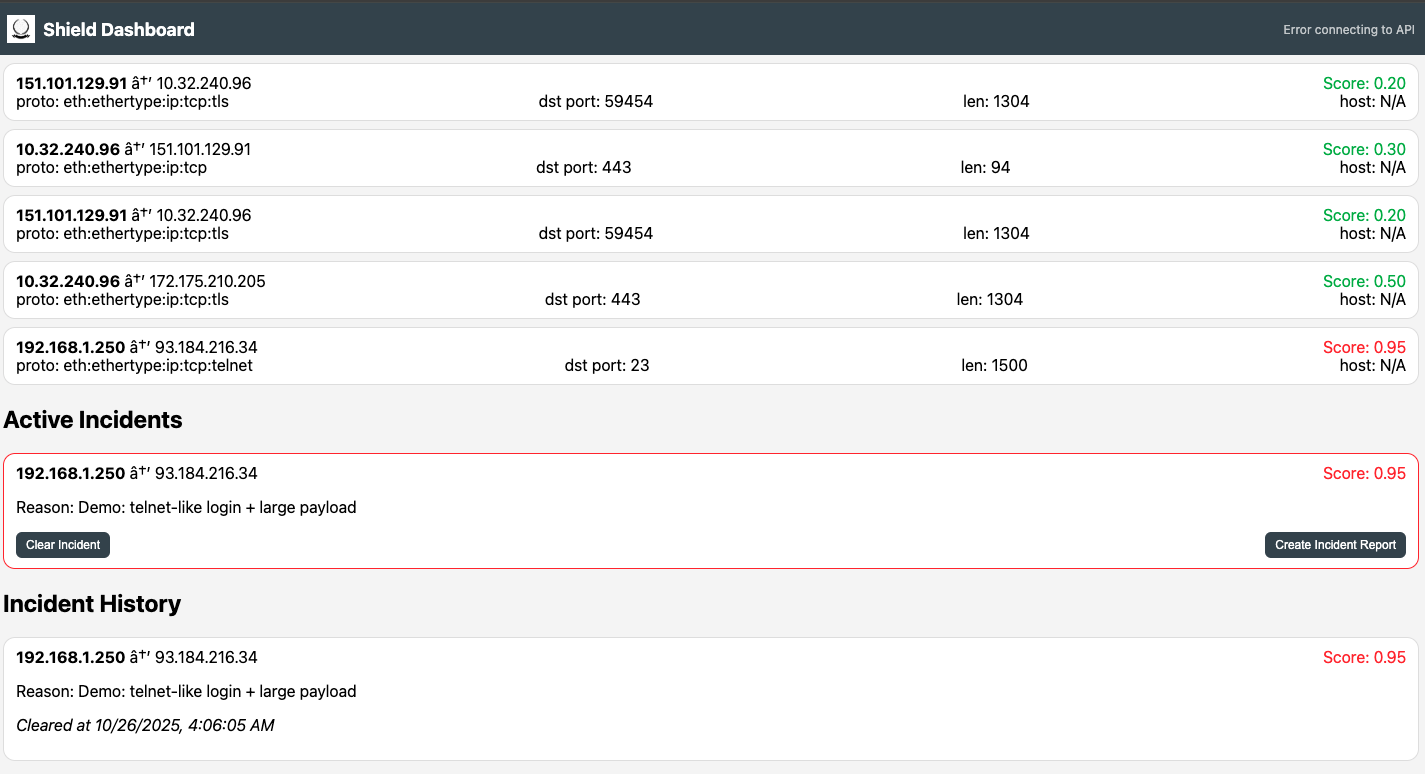
The dashboard
-
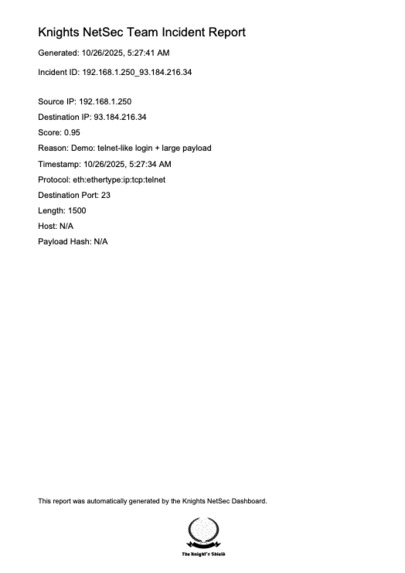
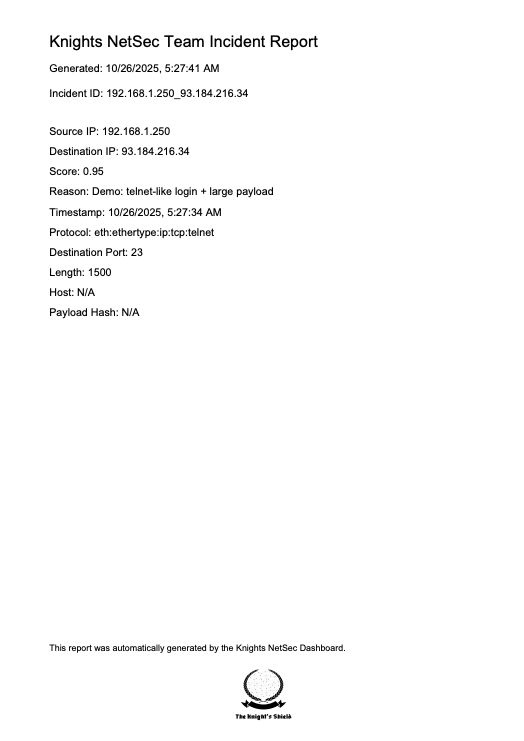
Incident pdf
-
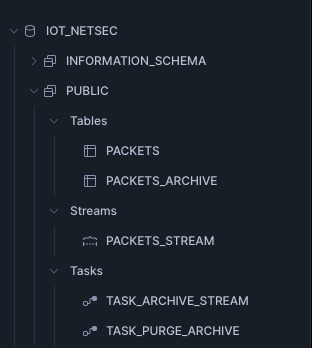
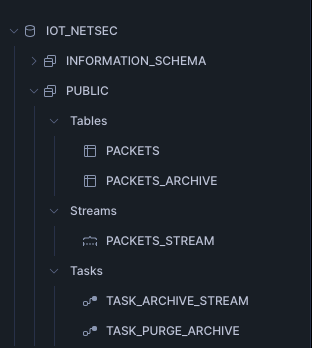
SnowFlake Directory
-

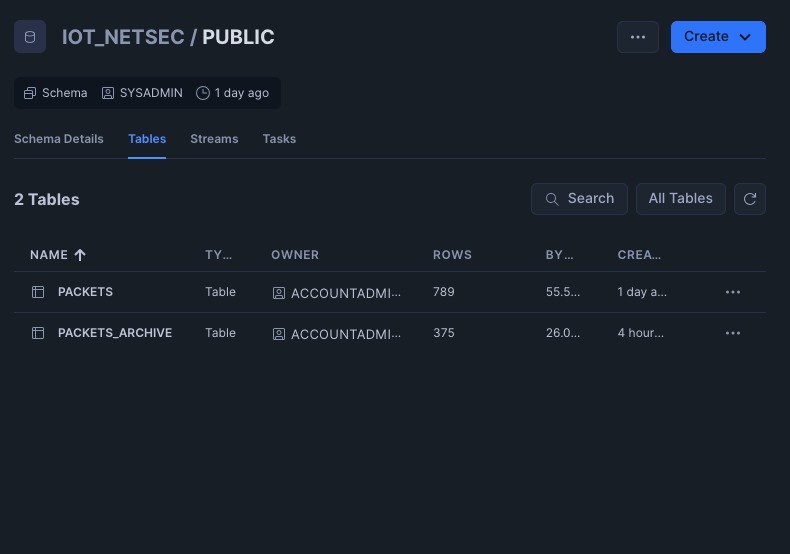
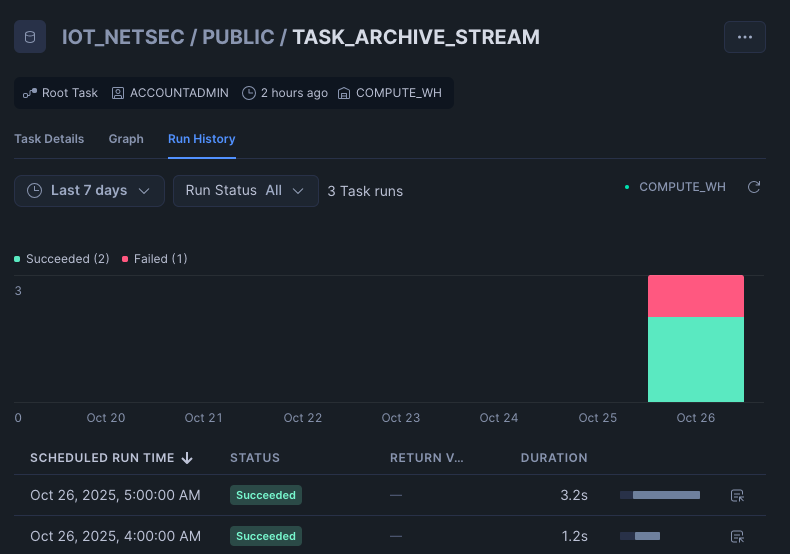
SnowFlake Tast
-
SQL Databases

Inspiration
The inspiration behind this project is actually quite funny. One of my good friends recently got an interview for a Data Engineering intern position at Lennar Homes, after his interview he called me and told me all about this interview. He explored the HQ, met some other interns, but one thing he mentioned was that he had walked by the network security office and he had told me how in the front of the office there was a huge board made up of multiple panels displaying what I'm assuming was network traffic, protocols, packets, etc., but what stuck out to me was when he said "I didn't understand anything that was on that board". Which led to me wanting to create my own version that anyone can access and use to record packets on their own network.
What it does
The Knight’s Shield monitors your network in real time, capturing all outgoing and incoming packets. It automatically detects unusual or potentially malicious behavior — such as strange IP destinations, unsecure protocols, or high-risk traffic patterns and flags them as “incidents.” Each incident is logged with detailed metadata, including source, destination, protocol, ports, and timestamps. Users can clear incidents or export them as professional PDF reports. All packets are stored in Snowflake, and older data is periodically archived automatically to keep performance smooth.
How we built it
The Knight’s Shield was built from the ground up using a combination of tools for networking, cloud storage, and data visualization. On the backend, Wireshark’s TShark captures live packets directly from my device’s network interface. These packets are then sent in real time to a Snowflake SQL database, where they’re stored and condensed. A FastAPI server acts as the bridge between Snowflake and the dashboard it fetches new packet data and serves it as an API endpoint. On the frontend, I used HTML, CSS, and JavaScript to build a live updating dashboard that visualizes the packets every few seconds. Suspicious packets are automatically flagged and displayed as incidents, and users can generate incident reports in PDF format directly from the dashboard.
Challenges we ran into
One of the biggest challenges I ran into early on was data management. Originally, all the packet data was being stored locally in a JSON file, which quickly became inefficient. The files grew large, and accessing or analyzing data in real time became slow and unreliable. To solve this, I integrated the Snowflake API. This completely made it so much easier. It allowed me to manage my data extremely well and I was able to implement task that allowed for flushing of data. With that I was able to keep a constant flow of data.
Accomplishments that we're proud of
What I am mainly proud of was my ability to integrate the snowflake api to get live seamless data as well as the scoring system. I feel like the scoring system from my end was a really great idea because it creates a priority list so you do not need to be reading every package to the tea. You can just look at the score and see if you need to take action or not, obviously when it comes to networking there A LOT more than just wire shark packages, but for a start I was extremely proud o it.
What we learned
Similarly to my accomplishment what i learned was how to properly integrate an api which is something i have been struggling with for a while.
What's next for The Knight's Shield
I want to turn The Knights Shield into a homelab that can create VPNs and have the usage of firewalls. I also want to turn the dashboard into a IoT Dashboard not just a simple network security dashboard.
Built With
- html
- javascript
- json
- python
- snowflake
- sql
- wireshark


Log in or sign up for Devpost to join the conversation.