-
-
Inattention Tax
Inspiration
Between March 2022 and July 2023 the Bank of Canada raised the overnight target from 0.25% to 5.00%. Prime and variable mortgage rates followed within days. We tested whether posted savings rates followed at the same speed and magnitude, and whether that relationship has changed over time.
What it does
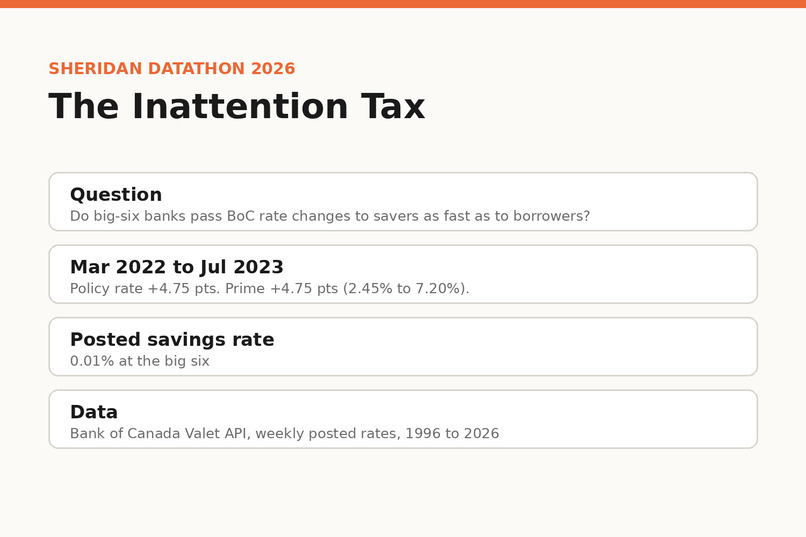
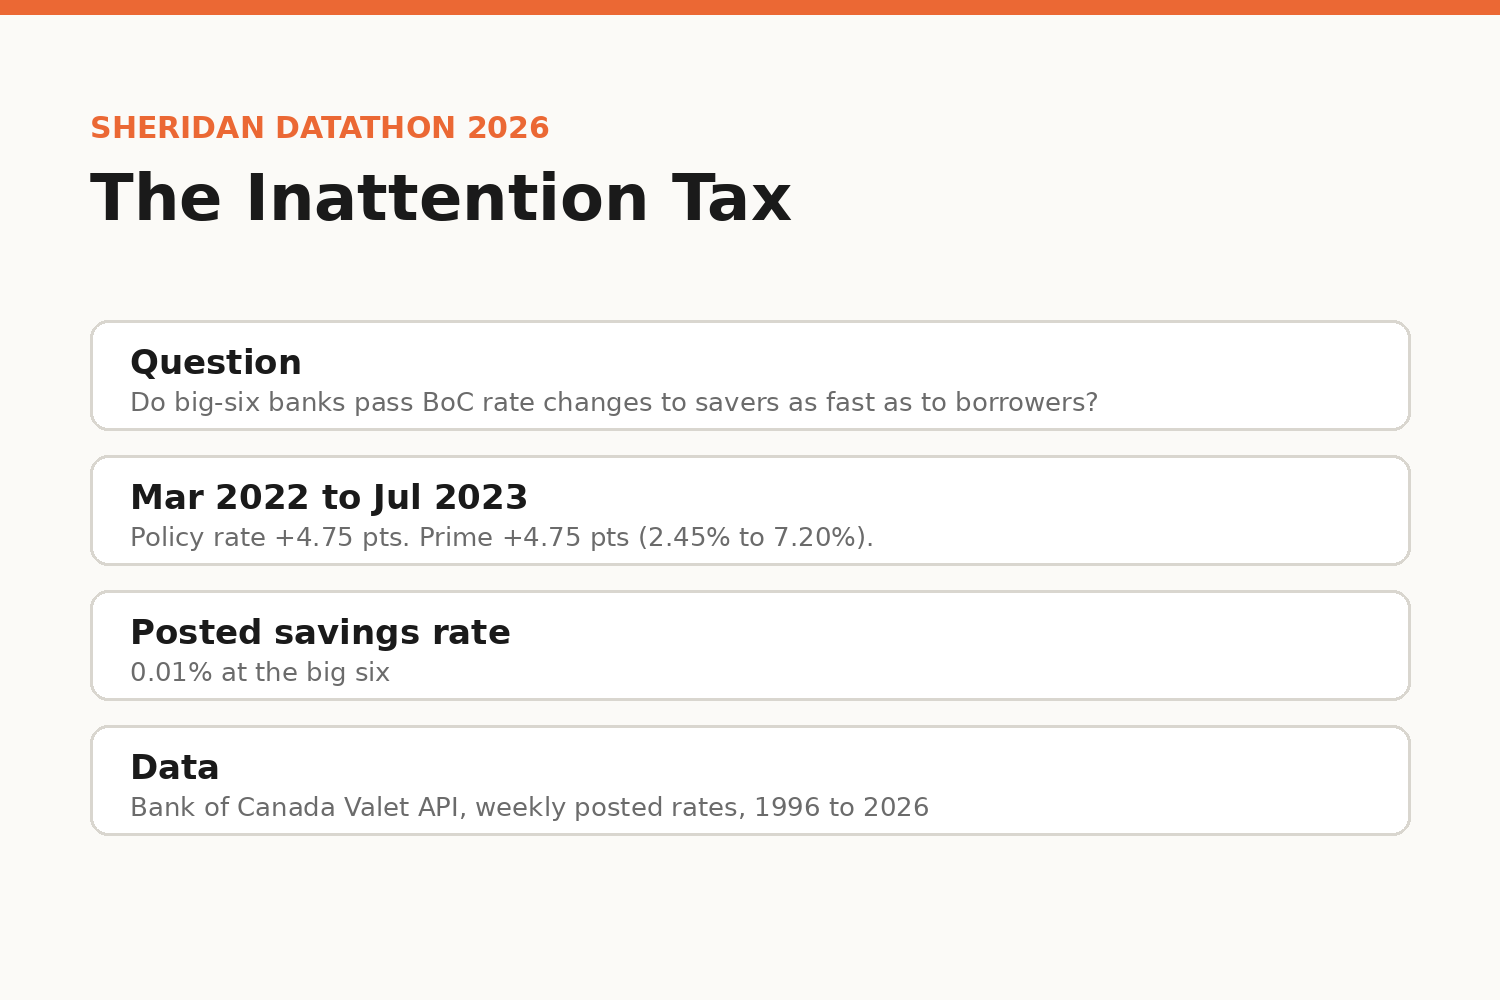
Question. Do Canada's largest banks pass Bank of Canada rate changes to savers as quickly and fully as to borrowers, and has that changed over time?
The project measures how each posted rate (prime, 5-year mortgage, 1-year and 5-year GIC, non-chequable savings) responds to policy rate changes. It separates hikes from cuts, identifies when savings rate sensitivity to policy changed, and estimates the interest savers did not receive relative to the earlier relationship. A calculator compares interest earned on a given balance in posted savings vs 1-year GICs over a selected period.
Findings. From March 2022 to July 2023 the policy rate rose 4.75 points, from 0.25% to 5.00%, and big-six prime rose the same 4.75 points, from 2.45% to 7.20%, a full 1:1 pass-through. The posted non-chequable savings rate at the big six is around ~0.01%. Borrowing costs track policy one for one while the posted savings rate stays near zero, and that gap is what the dashboard measures, broken down by product, by direction of the move and by year.
How we built it
- Bank of Canada Valet API for weekly posted rates (mode of the six largest chartered banks), the overnight target, and monthly personal notice and fixed-term deposit balances
- Weekly and monthly series stored in Tiger Data hypertables with a monthly continuous aggregate
- Event study of cumulative pass-through at 1, 4, 13 and 26 weeks after each policy change
- Asymmetric error-correction model per product with HAC standard errors, testing equal adjustment speed above and below the long-run spread
- Rolling 60-month pass-through coefficient with binary segmentation (ruptures) for break detection
- Counterfactual savings rate fitted on the pre-break period, applied to actual notice deposit balances
- Streamlit and Plotly front end, with all displayed figures computed directly from model output
Challenges we ran into
Aligning daily policy data, weekly posted rates and monthly balances on one time index. Posted rates exclude promotional and online-bank offers, so the dollar estimate is an upper bound. The counterfactual depends on the baseline window, so we report it under three windows (full pre-break, 10 years, 5 years).
Accomplishments that we're proud of
The break date is estimated from the data rather than assumed, and the counterfactual is reported across multiple baselines so the main result can be checked for sensitivity.
What we learned
Pass-through varies by product, direction and horizon. A single average coefficient hides the asymmetry that drives most of the savings shortfall.
What's next for The Inattention Tax
Add online-bank and HISA rates to measure how much of the gap is recoverable by switching, and extend the calculator into a monthly comparison against the best available rate.
Built With
- pandas
- plotly
- postgresql
- python
- ruptures
- statsmodels
- streamlit
- timescaledb
