The Gilded Ace — Decision Room

Luck, location, or a leak?

Inspiration

Imagine being given $100,000 to improve a casino floor, and the general manager's first instinct is to replace the ten machines making the least money.

Our question was simple: What if those machines aren't actually the problem?

A machine might be experiencing unusually bad payout luck, sitting in a low-traffic location, or spending too much time offline. Replacing it without identifying the underlying cause could waste the entire budget.

We wanted to build more than a dashboard. We wanted to build a decision room that challenges its own recommendations.

What It Does

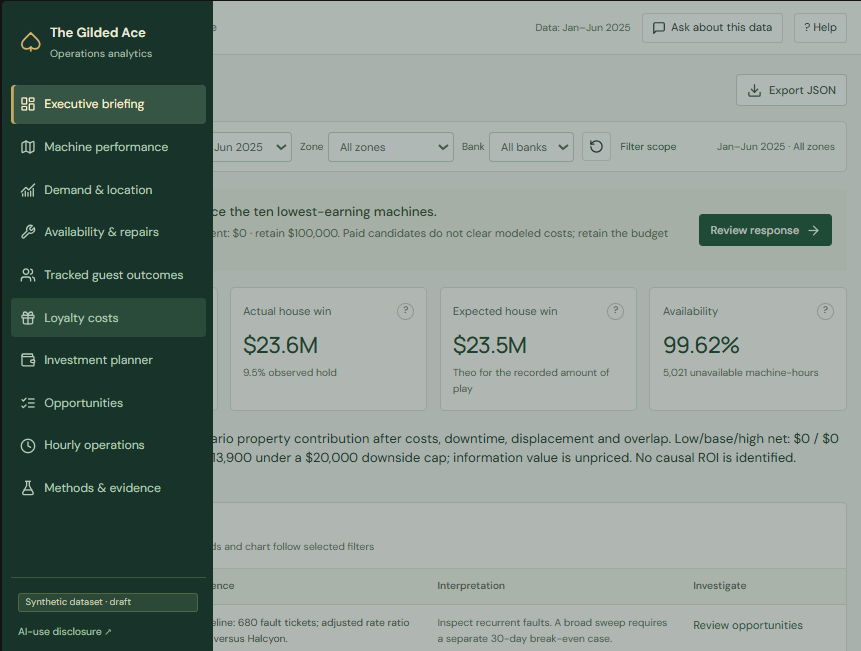
The Gilded Ace analyzes six months of synthetic casino operations through an interactive dashboard featuring:

  • Machine-level financial performance, statistical anomaly detection, and an interactive casino floor map.
  • Demand, downtime, repair, guest, and loyalty-program investigations.
  • Chronologically validated forecasting against a simple baseline.
  • A $100,000 investment planner comparing 968 feasible portfolios.
  • An evidence-grounded Gemini investigation assistant with an offline fallback.

Our findings included a statistically unusual payout pattern on machine M-1158, a roughly 31% relative decline in Back Forty wagering during an access disruption, and significant differences in manufacturer fault rates.

Our Biggest Finding

The best financial recommendation was to spend $0.

After evaluating intervention costs, opportunity losses, and scenario assumptions, our primary model recommended retaining the full $100,000 rather than funding interventions with insufficient demonstrated returns.

We also developed a separate $13,900 experimental strategy involving inspections, wayfinding, and a controlled loyalty pilot. Unlike the financial recommendation, this option prioritizes learning, and we explicitly disclose its negative modeled base-case return.

How We Built It

We combined React, TypeScript, Vite, Python-based statistical analysis, and a constraint-aware decision engine. Our methodology includes exposure-adjusted comparisons, multiple-testing correction, historical location attribution, and chronological forecasting.

A frozen weekday forecasting model achieved approximately $68,699 mean absolute error versus $218,258 for a constant baseline.

Challenges and What We Learned

The hardest challenge wasn't visualization. It was separating correlation from causation.

An unusual payout isn't proof of malfunction. A traffic decline isn't proof that signage will fix it. And a forecast isn't evidence that an intervention will generate profits.

We also tackled complex data reconciliation, time boundaries, model validation, and cloud deployment.

Our biggest lesson: Sometimes the most useful output of an analytics system isn't what to do next. It's knowing when the evidence isn't strong enough to justify acting.

What's Next

Expand the hourly operations explorer, validate interventions through controlled experiments, and use future results to update our recommendations.

All casino data is synthetic. Estimated intervention effects are scenarios, not proven causal returns. OpenAI Codex assisted with implementation, analysis, testing, and documentation; Gemini is used for optional evidence-grounded investigation.

Built With

Share this project:

Updates

posted an update —

Technical Details: The Statistical Algorithms Behind Our Dashboard

One important distinction: Gemini doesn't perform our statistical calculations, and Tiger Cloud isn't just storing data. We built the analytical methods separately, use Tiger Cloud to query historical hourly data efficiently, and let Gemini retrieve and explain the results.

Here are the main algorithms we implemented:

  • Leave-One-Out Matched Peer Benchmarking: We compare each machine against other machines with the same game configuration, location zone, month, and weekday. The target machine is excluded from its own benchmark, and performance is normalized by available operating hours. This helps separate low demand from limited exposure.

  • Payout Anomaly Detection (Z-Test + Benjamini–Hochberg): We calculate expected house win using each game's configured return-to-player rate. We estimate payout variance from squared bet amounts and game volatility, calculate a standardized Z-score, and apply Benjamini–Hochberg false-discovery-rate correction across machines. This flagged M-1158 with Z = −4.57 and adjusted q ≈ 0.00151, without claiming a malfunction.

  • Poisson Regression for Machine Reliability: We model fault counts using Poisson regression with active machine-days as an exposure offset. We control for manufacturer, game configuration, zone, month, and weekday, using quasi-Poisson covariance to account for dispersion. Ridgeline's adjusted fault rate was approximately 3.56× Halcyon's.

  • Fixed-Effects Regression for Location Changes: We analyze wagering per available hour using weighted log-rate regression with date and zone-by-configuration fixed effects. We use Newey–West standard errors with a seven-day lag to account for temporal correlation. This supports the Back Forty demand finding while acknowledging that the relationship isn't necessarily causal.

  • Block Bootstrap Confidence Intervals: We resample observations in seven-day circular blocks within months to estimate uncertainty in machine performance and contribution ratios. This preserves some weekly dependence that ordinary independent resampling would ignore.

  • Chronological Forecast Validation: We select a weekday-based forecasting model using earlier training and validation periods, then freeze predictions for May–June. Its daily-wager MAE was $68,699 versus $218,258 for a constant-mean baseline, a 68.5% reduction. We also evaluated additional calendar-based models retrospectively.

  • Loyalty Mix Standardization: We match loyalty redemptions to POS transactions and calculate actual economic costs. We then hold January's item-and-tier mix fixed to distinguish changes in point pricing from changes in what customers redeem.

  • Constrained Portfolio Enumeration: We generated 20 evidence-based action bundles and exhaustively evaluated 968 feasible portfolios under the $100,000 budget, three-action-type limit, lead times, costs, and incompatibilities. This produced our $0 financial recommendation and a separate $13,900 experimental strategy under a different objective.

  • Tiger Cloud Time-Series Aggregation: We imported 1,321,908 machine-hour records into a TimescaleDB hypertable with seven-day time partitions and hourly continuous aggregates. Utilization is calculated as SUM(occupied_seconds) / SUM(available_seconds), rather than averaging percentages. We also rank one-to-four-hour maintenance windows by estimated theoretical contribution at risk. In measured Tiger Cloud tests, continuous aggregates made our full-property SQL query approximately 7.1× faster than scanning raw hourly data.

Gemini connects these findings through constrained function calling and verified evidence retrieval. It chooses which calculations and results are relevant to a question, while the underlying algorithms remain responsible for the numbers.

The goal was to make complex statistical analysis both reproducible and understandable—not to have an LLM guess what the casino should do.

posted an update —

Update: Google Gemini & Tiger Cloud Integration

We expanded The Gilded Ace with two integrations that make the dashboard more useful for investigating casino operations.

Google Gemini — Evidence-Grounded Investigation Copilot

Instead of using Gemini as a general-purpose chatbot, we connected it to our existing statistical analysis and decision engine.

  • Natural-language investigations: Users can ask questions like "Why was machine M-1158 flagged?" without manually searching through the dashboard.
  • Tool-based evidence retrieval: Gemini selects read-only analytical tools to retrieve machine diagnostics, statistical findings, and the evidence behind recommendations.
  • Reliable calculations: Financial figures and statistical results come from our analysis engine, not Gemini-generated estimates.
  • Offline fallback: If Gemini is unavailable, the dashboard can still provide deterministic, evidence-backed explanations.

Tiger Cloud — Hourly Operations Explorer

We used Tiger Cloud's TimescaleDB to extend our analysis from daily summaries to 1,321,908 historical machine-hour records.

  • Time-series analytics: Query and aggregate hourly wagering, occupancy, and machine utilization.
  • Interactive heatmaps: Compare activity across hours and identify patterns that daily averages can hide.
  • Maintenance planning: Identify historically quieter operating periods where inspections or repairs may cause less disruption.
  • Data validation: Reconcile hourly data against the original daily records to ensure the results remain consistent.

Why These Integrations Matter

Tiger Cloud helps us analyze when operational problems occur, while Gemini helps users understand why a machine was flagged and what the evidence actually supports.

Both integrations build on our existing analytics rather than replacing them, making the dashboard more useful for turning complex casino data into explainable decisions.

Live deployment verification of these integrations remains in progress.

Submission history