-
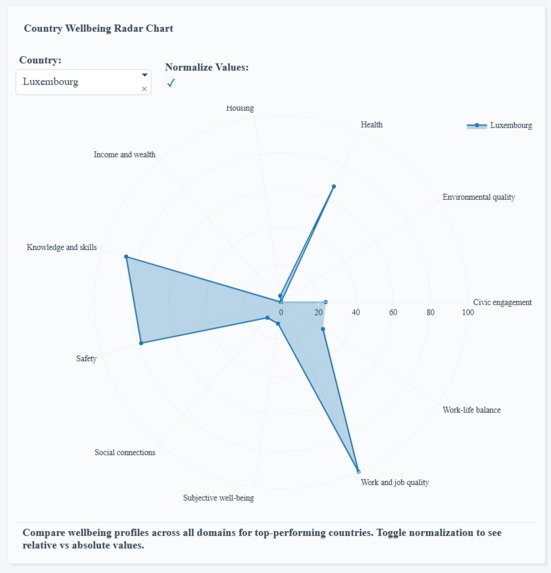
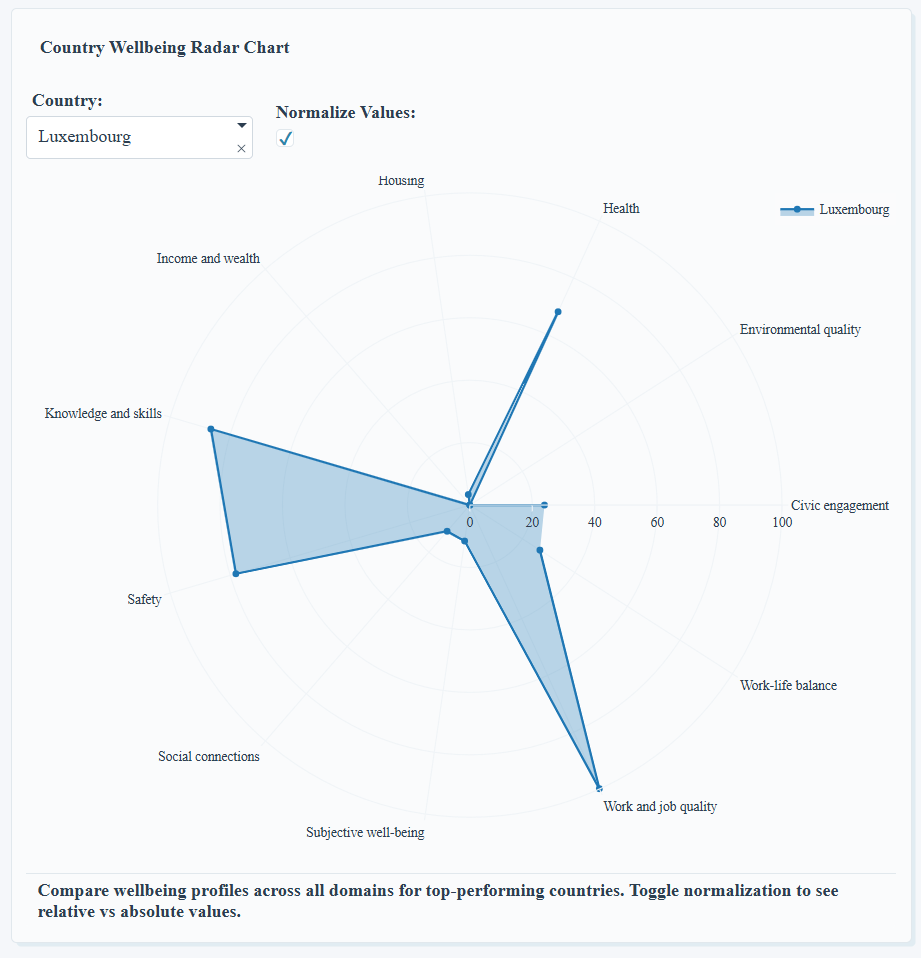
Country Wellbeing Radar Chart
-

Dashboard
-
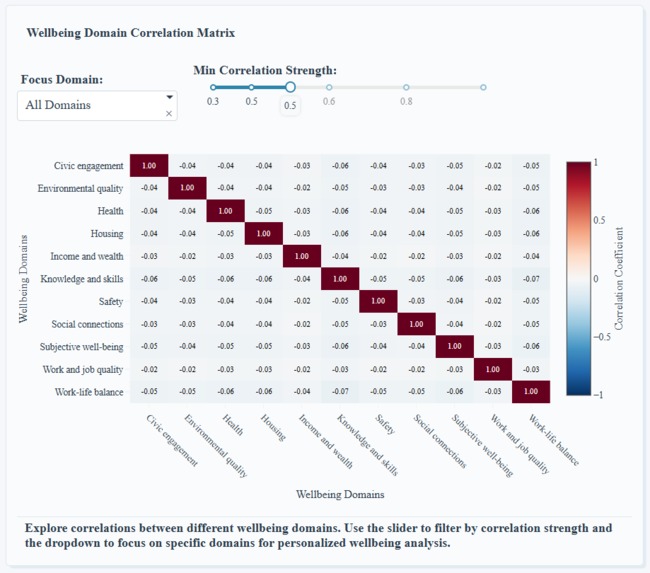
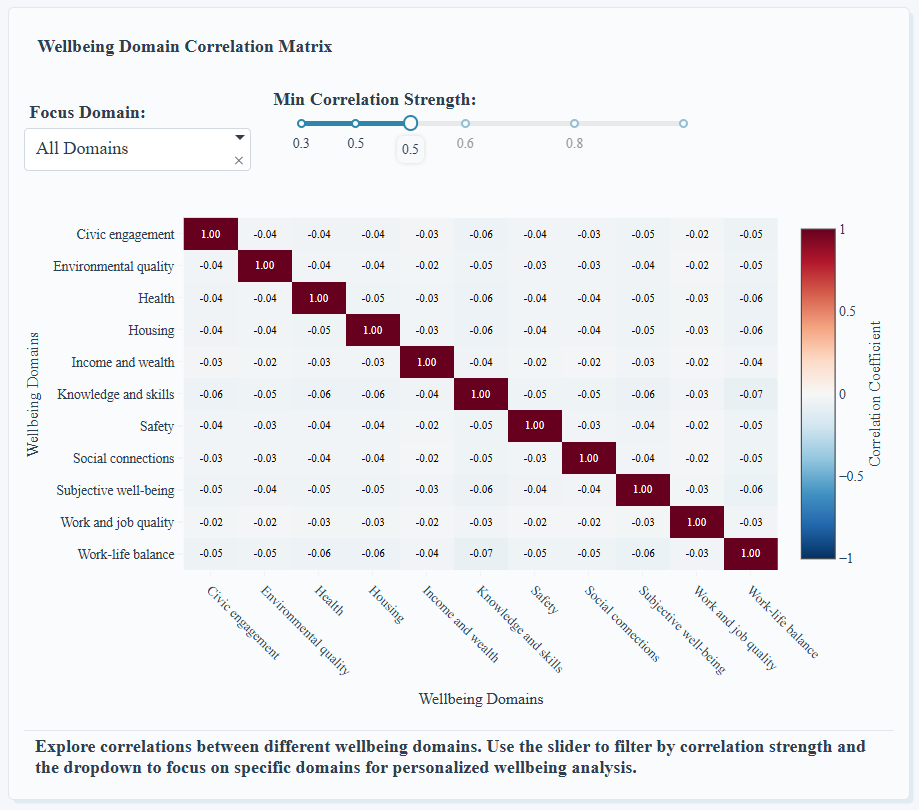
Wellbeing Domain Correlation Matrix
-
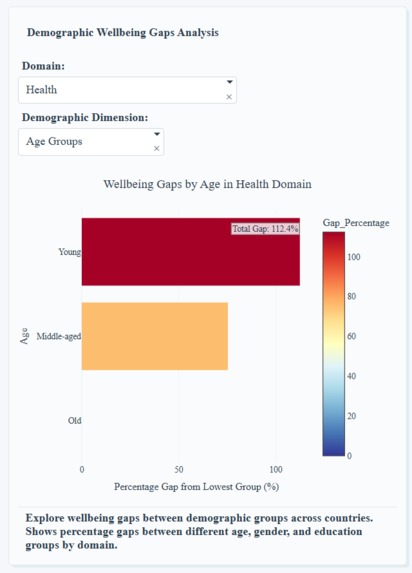
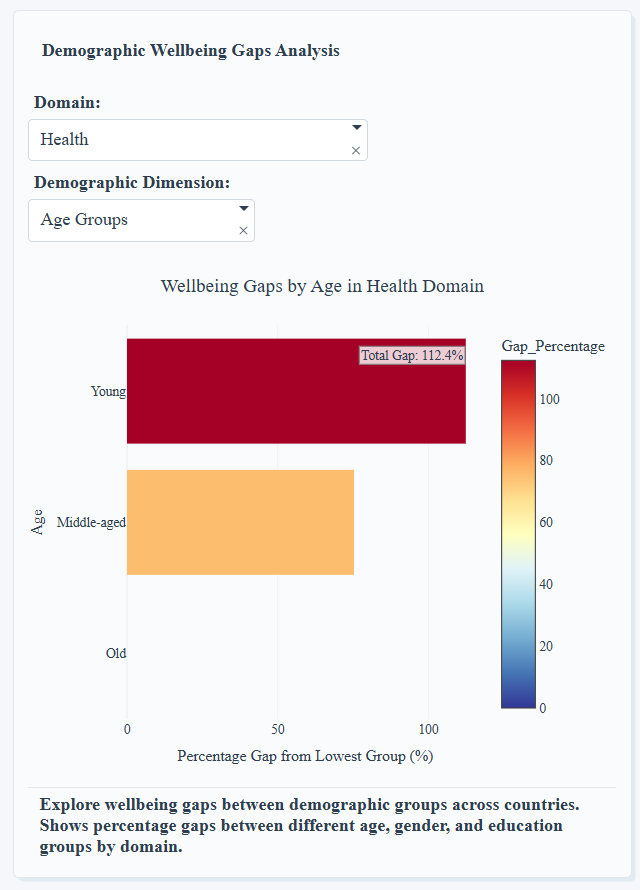
Demographic Wellbeing Gaps Analysis
-
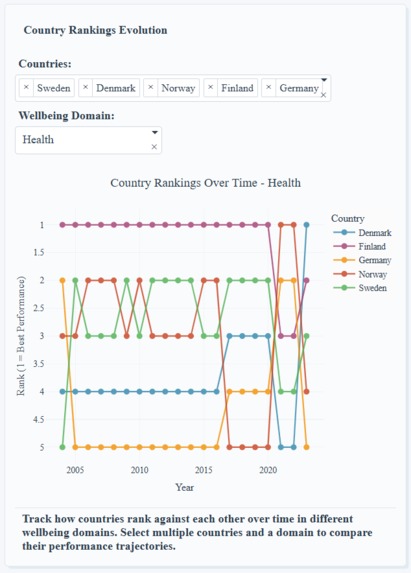
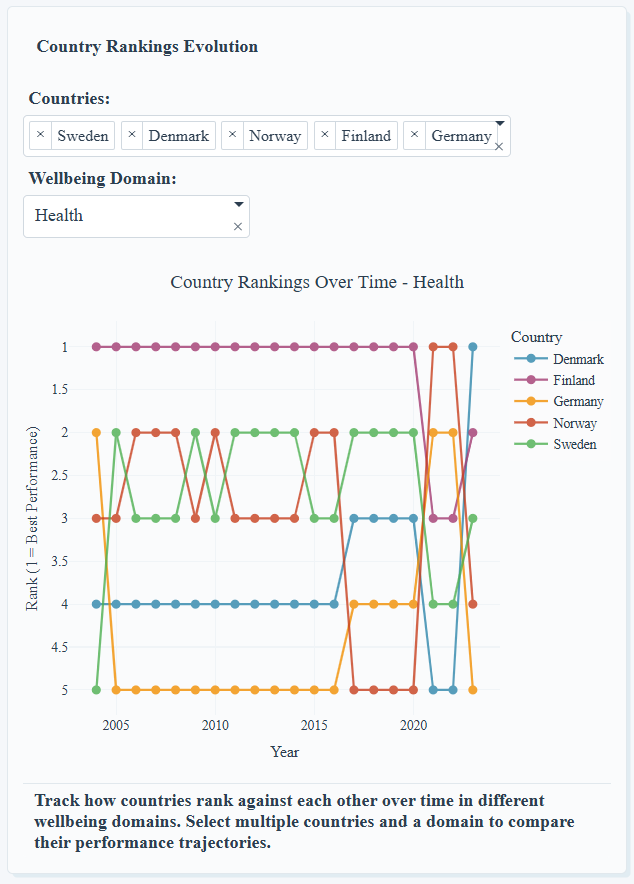
Country Rankings Evolution
-
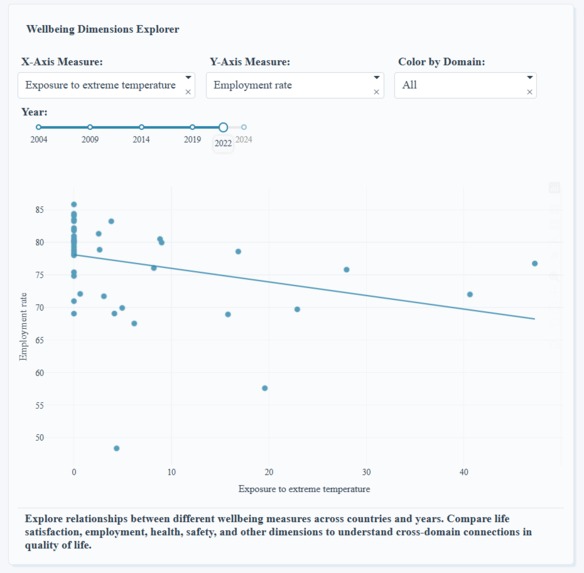
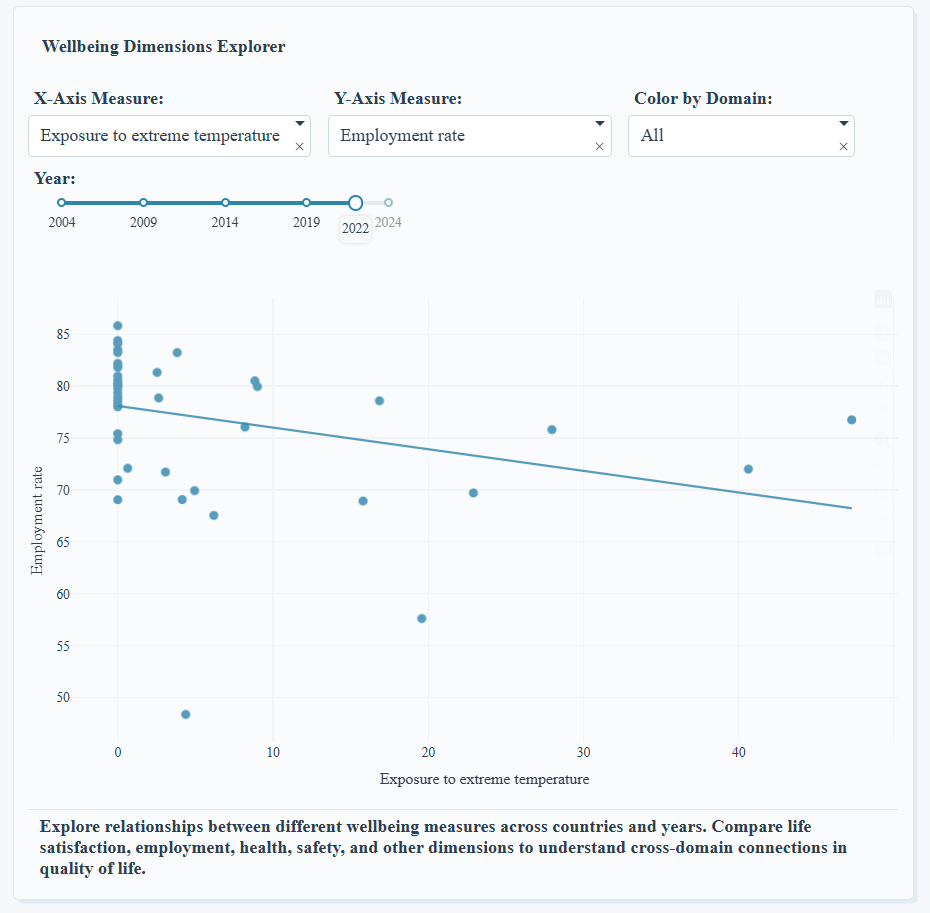
Wellbeing Dimensions Explorer
-
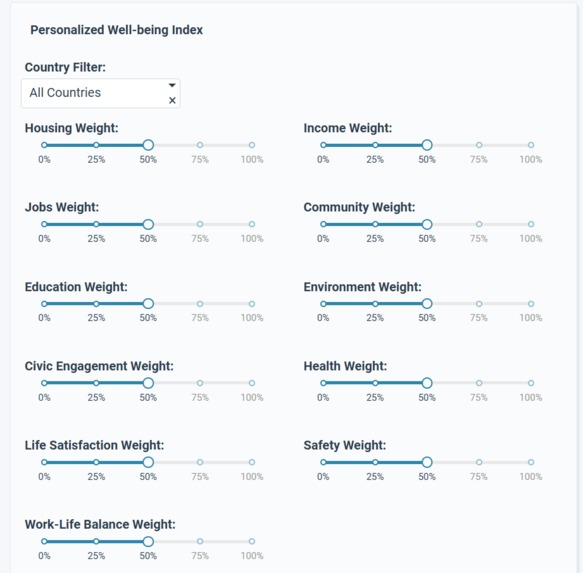
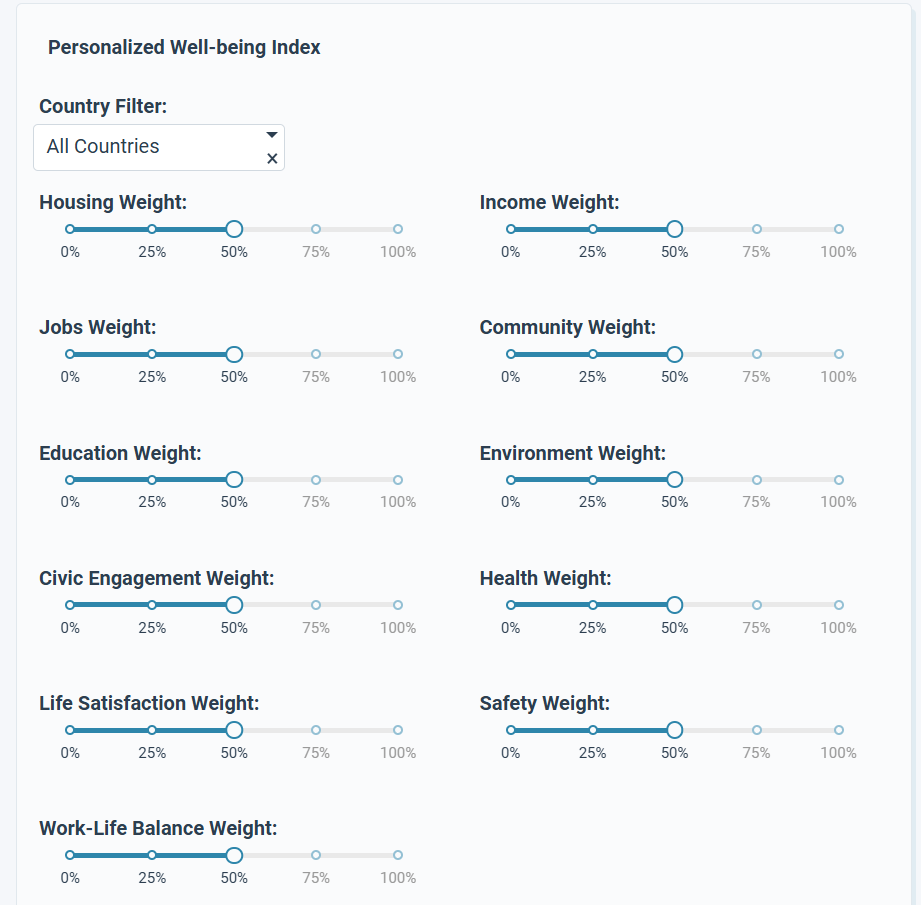
Personalized Well-being Index (Range Sliders)
-
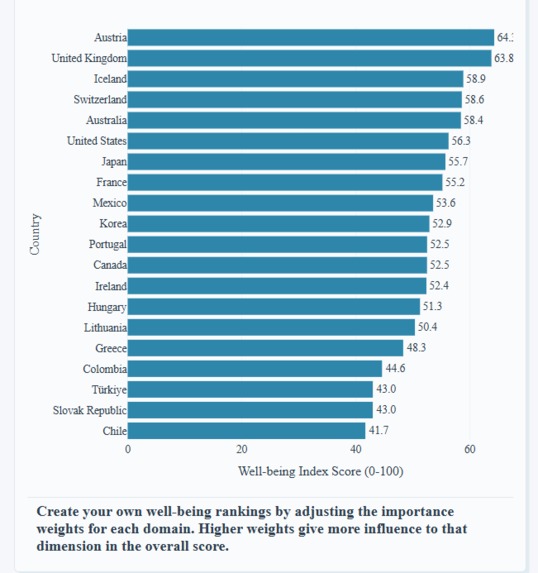
Personalized Well-being Index (Chart)
-
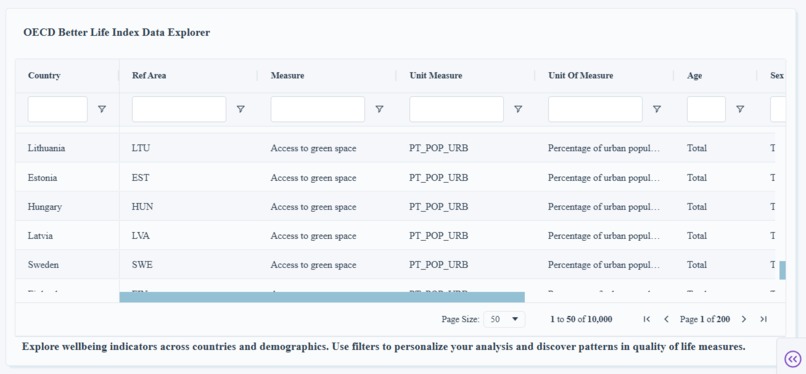
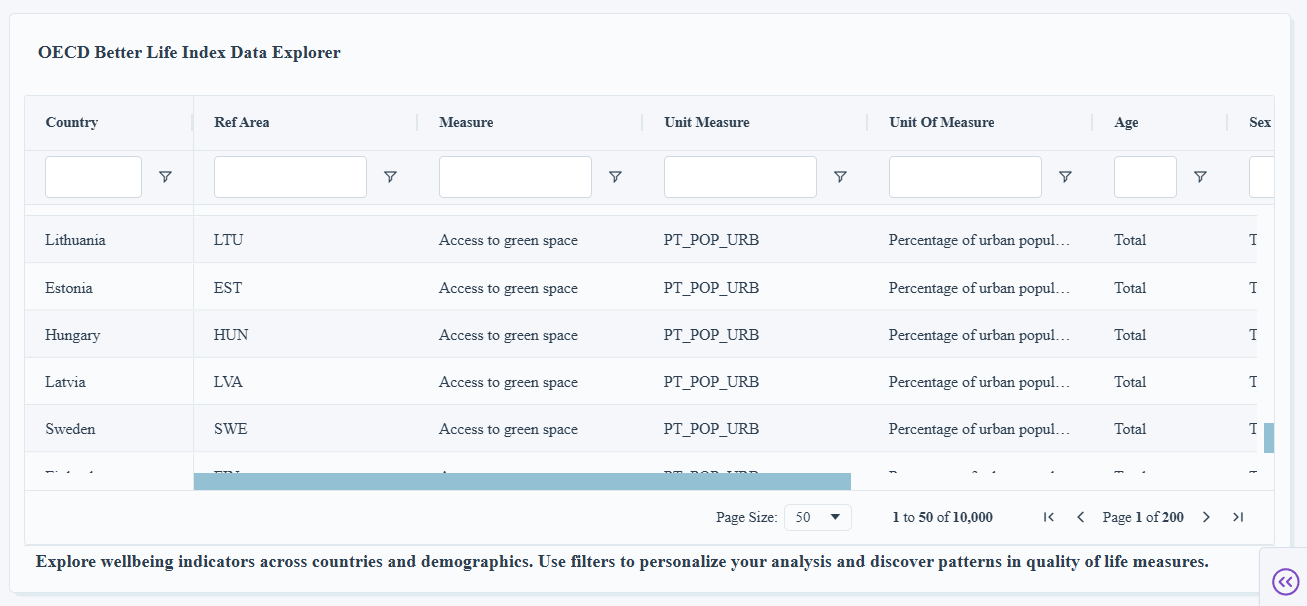
OECD Better Life Index Data Explorer
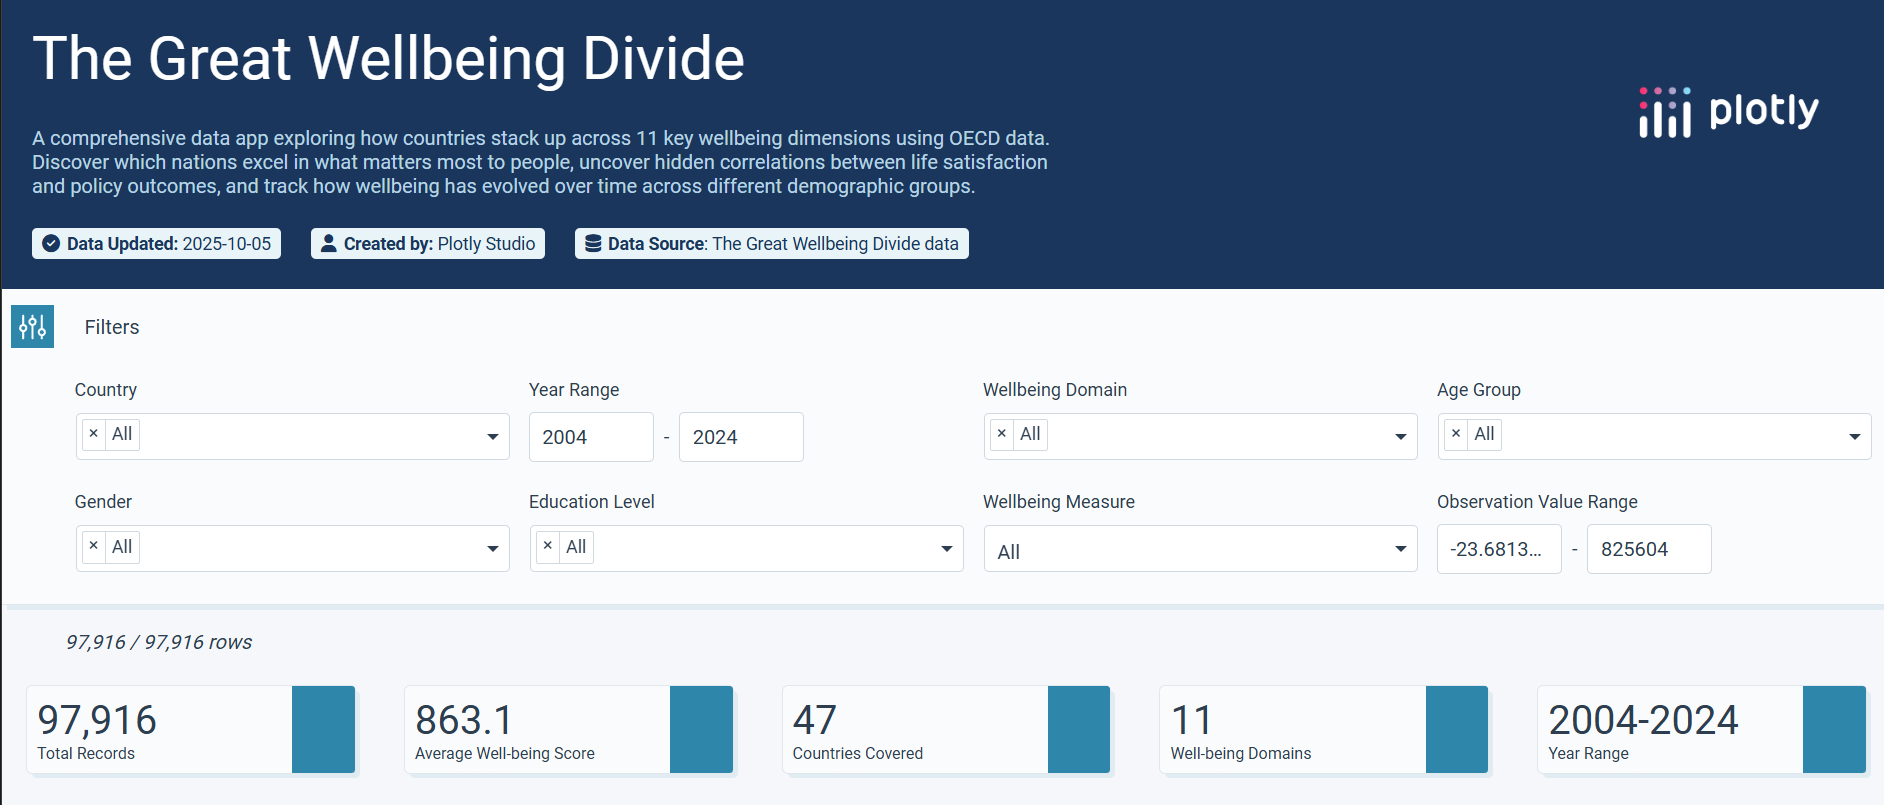

The Great Wellbeing Divide
This project was inspired by a desire to make complex wellbeing data accessible and actionable for everyone—from policymakers to curious citizens. The OECD wellbeing dataset is vast, with nearly 100,000 records across 47 countries and 11 dimensions (like health, education, income, environment, and more). Most dashboards just scratch the surface. I wanted to build an interactive platform that digs deeper:
- Uncovers hidden patterns in global wellbeing, revealing not just who tops the rankings, but why—and who is being left behind.
- Highlights demographic gaps (age, gender, education) that traditional rankings mask, showing where countries excel and where improvement is needed.
- Enables personalized exploration, letting users weight what matters most to them.
What I learned
- How to load, clean, and visualize large multi-dimensional datasets for public dashboards.
- Best practices for designing interactive filters, correlation matrices, radar charts, and time-series evolutions in Plotly Studio.
- Cloud hosting limits for large data apps, and the importance of providing screenshots/gifs for full transparency.
How I built it
- Data Processing: Imported and cleaned the full OECD dataset in Plotly Studio.
- Visualization: Used Plotly Studio’s AI-driven workflow to generate and refine multiple chart types (radar, matrix, scatter, custom index, etc).
- Deployment: Published via Plotly Cloud. Due to heavy resource needs, screenshots from my working local app are provided as well.
- Feedback: Storyboarding and UX improvements based on trial runs and user feedback.
Challenges I faced
- Handling a dataset this large (nearly 100,000 rows) on free cloud infrastructure caused slow loading—so I created full screenshots, provided public code, and optimized filters.
- Some complex charts required multiple iterations to meet both speed and storytelling goals.
- Ensuring accessibility and clarity for a diverse data audience.
Built With
- html/css
- oecd-wellbeing-dataset
- plotly-cloud
- plotly-studio
- python


Log in or sign up for Devpost to join the conversation.