Inspiration
The challenge started with a manager's request: replace the ten slot machines that earned the least. That sounded reasonable until we
asked why a machine earns little. It might have been on the floor for only a few weeks. It might sit in a quiet corner. It might ju
be unlucky. Or something might actually be wrong with it. Replacing all ten would pay for every one of those problems at once, even
though only one of them is fixed by a new cabinet.
So we built the dashboard around a single question a floor manager can act on: is this machine weak, or is it something else?
## What it does
The Gilded Ace dashboard takes a fictional Las Vegas casino from
meters to a July budget decision, and lets you trace every number back to the data.
- Machine audit separates luck, location and leaks. Only 1
the manager's bottom ten (M-1120) is still weak once time on the floor, placement and luck are removed. One cabinet, M-1158, k
\$36,165 less than its settings imply, and paid out on 38.6% of spins against a published 31.5%.
- Demand & uptime explains the spring decline. April to June wagers fell about \$52k a day, almost all from lower play per
available hour, not lost machine time. Heat had no effect, and Missouri's casino market fell too.
- Guests & comps reports player outcomes honestly. The top 10% of carded players placed 64% of wagers, and 84% of player
ended behind. It also found that on May 1 the points charged per dollar of comps were cut by 53% in every tier.
- Model validation tests a simple weekday forecast against real baselines on days the model never saw.
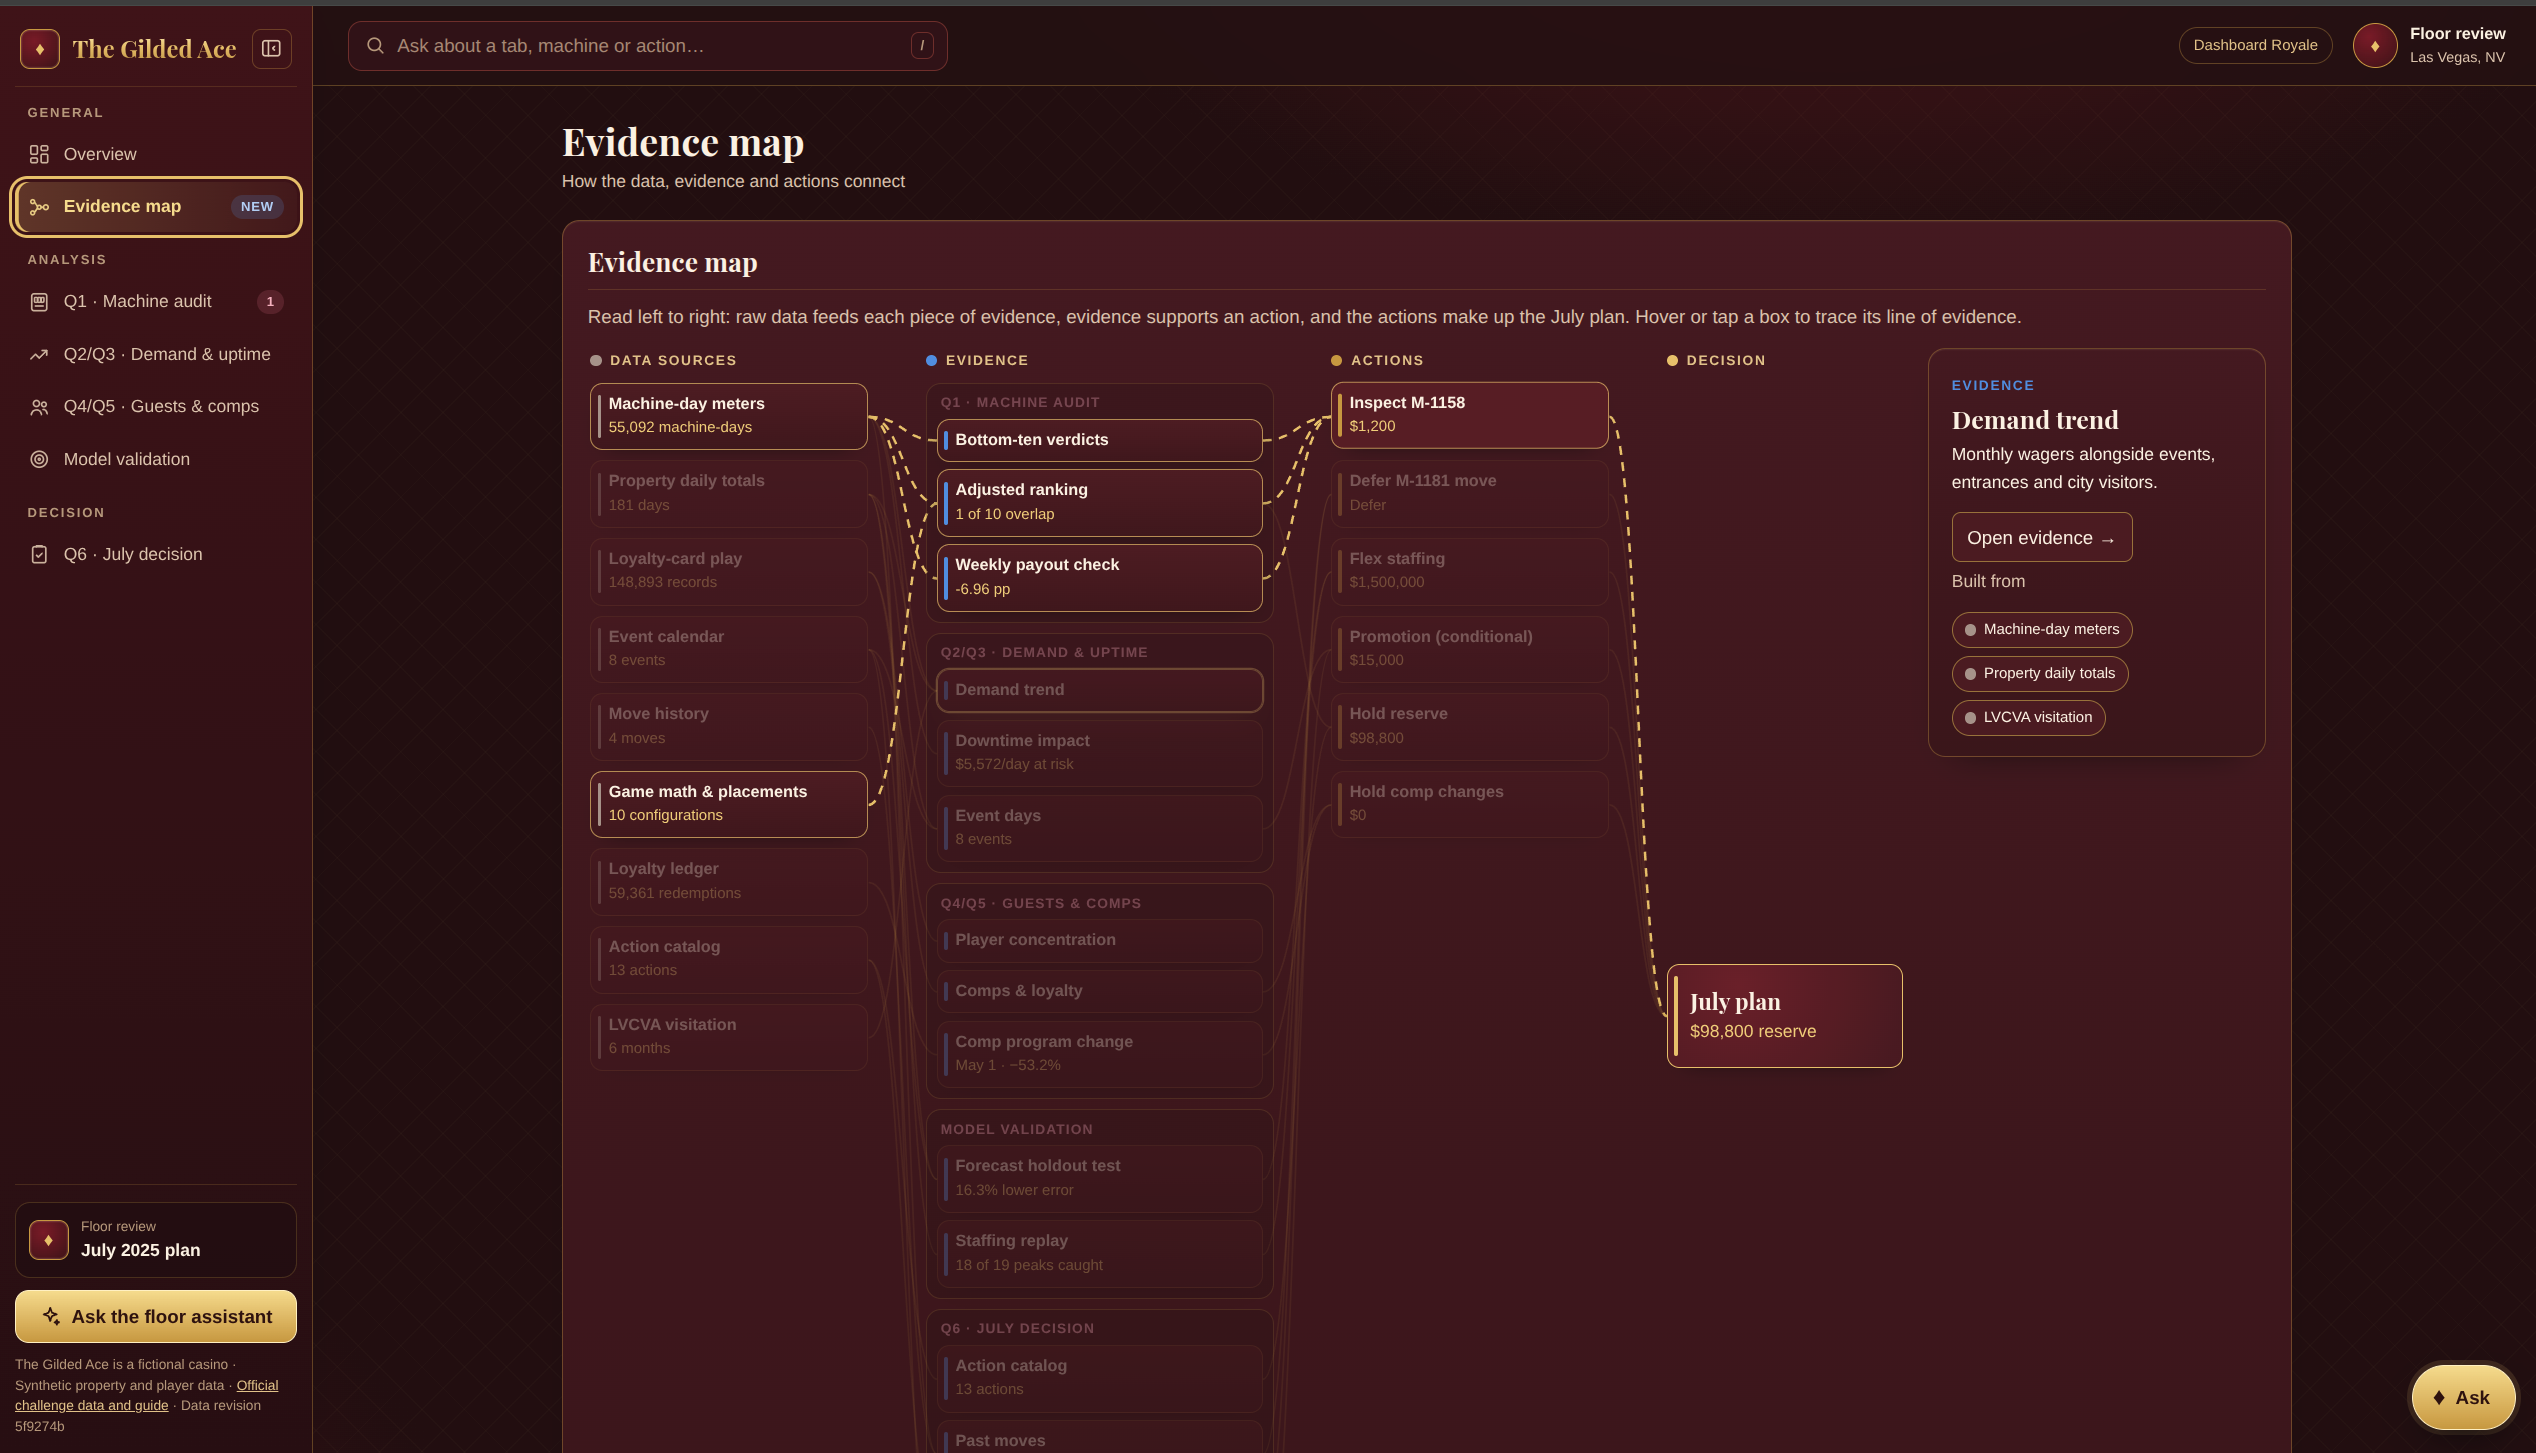
- July decision puts the \$100,000 into a ledger with the catalog rules checked: one \$1,200 inspection, \$98,800 h
in reserve, and a promotion that is only funded if registrations clear its hurdle.
- An evidence map, a Claims page and a built-in floor assistant let a judge trace any recommendation back to its data
a couple of clicks.
## How we built it
A Python build script (pandas) turns the official challenge files into one compact dataset. A React and Vite app computes everythin else in the browser and ships as a single HTML file that works offline, deployed on Vercel.
We followed the guide's data rules throughout: ratios of sums rat than averages of daily ratios, 06:00 to 06:00 gaming days (including the 23-hour daylight-saving day), dropping the 1,018 rows for machines that weren't on the floor, and treating a missing traffic count as an offline counter, not zero.
**Luck vs leak. For each machine we compare what it kept with w its settings say it should keep:
$$ \text{gap} = \frac{\sum_d (\text{win}d - \text{theo}_d)}{\sum_d \text{coin-in}_d} $$
Slot results are lumpy, so the standard error is clustered by wee ($k$ weeks with play):
$$ \widehat{SE} = \frac{1}{\sum_d
c_d}\sqrt{\frac{k}{k-1}\sum{w}\Big(\sum_{d \in w}\big(\text{win}d - \text{theo}_d - \widehat{\text{gap}}\,c_d\big)\Big)^2}
$$
With about 300 machines, some will look extreme by chance. We control false alarms with Benjamini–Hochberg $q$-values and requi the gap to persist in both halves of the period. M-1158 was below its configured hold in 23 of 27 weeks ($q < 0.001$). A second test checks how often it pays out at all:
$$ z = \frac{\hat p - p_0}{\sqrt{p_0(1-p_0)/n}}
$$
It came out far above its published hit rate, while the other 309 cabinets looked like pure chance.
Weak vs unlucky. The adjusted ranking compares each machine's expected win per available hour with same-game peers in its own zone ($r$), then pulls machines with little history toward average usi a credibility weight:
$$ \text{score} = w\,r + (1-w)\cdot 1, \qquad w = \frac{h}{h + k},
\quad k = 629 \text{ hours (fitted from the data)} $$
Forecasting. We trained on January to April and scored on 61 held-out days in May and June. Simple weekday averages missed by an average of \$68,699 a day, against \$82,070 for "same day last week" and \$218,258 for a constant mean:
$$ \text{MAE} = \frac{1}{n}\sum{t=1}^{n}\lvert y_t - \hat y_t \rver $$
At the \$1.5m staffing cutoff, the weekday forecast caught 18 of 19 peak days.
Costing actions. Every option uses the guide's formula, where $q$ is quantity, $u$ the unit cost, $r$ the daily recurring cost and $\ell$ the lead time in days:
$$
\text{cost} = q\,\big(u + r\cdot\max(0,\ 30-\ell)\big) $$
and benefit is counted only for July days after the lead time.
## Challenges we ran into
- Telling luck from a real problem. A machine with a bad mont isn't broken. We needed clustered errors, false-alarm control, a check that the gap persists, and a placebo across every other
cabinet before we would call anything a lead. Even then, we frame M-1158 as something to inspect, never an accusation. - Moves that look good but aren't. All four historical moves helped the destination bank, but only two gained across both bank
Play mostly shifted rather than grew, so the proposed relocation stays deferred.
- Keeping numbers honest as the analysis grew. Figures typed into the text go stale quickly. We replaced them with computed values and wrote a check that recomputes 266 quoted figures across the README, appendix, write-up and dashboard, and fails if any drift.
- Fitting it all in one offline page. Everything is aggregated in Python first so the single HTML file stays usable.
- Null results. Heat, comp-driven return visits, food-and-drink substitution and several other hunches didn't hold up. We kept them in the record anyway, because a clean null is still evidence.
Accomplishments that we're proud of
- A recommendation that is cheaper and better supported than the original request: one \$1,200 inspection instead of ten replacements.
- Every claim on the page links to its table, its result, the alternative we tested, and its limitations.
- An honest look at player outcomes, with a responsible-gaming note instead of ideas that target heavy losers.
What we learned
- The question "which machines are worst?" hides several different problems, and each one needs a different fix.
- A simple model with an honest holdout and a strong baseline beats a complex one nobody can check.
- The most useful result is often the one that tells you not to spend money yet.
- Writing down what we ruled out made the findings we kept far more convincing.
What's next
- Run the M-1158 inspection and confirm the fix within about a day by watching its hit rate.
- Pilot any relocation with matched comparison banks before moving machines floor-wide.
- Re-run the full analysis when the challenge data reaches its 1.0 release; the claims check will flag anything that changes.
AI use: built with help from ChatGPT (OpenAI Codex) and Anthropic Claude Code. Every number is computed from the official files and verified by npm run check, and a human reviewed the recommendations. The casino is fictional.
Before you paste it:
- Rendering: Devpost uses $$…$$ for display math and $…$ inline. The dollar amounts are written as \$ so they aren't read as math; check the preview in case Devpost renders them differently.
- "We": it's written in the first person plural. Switch to "I" if you're submitting solo.
- The last line repeats the AI-use disclosure from your README and appendix. Keep it if Devpost has no separate field for the disclosure.
- Must be on a non-school-related Wi-Fi connection when opening up the link(i.e. hotspot)
