-
-
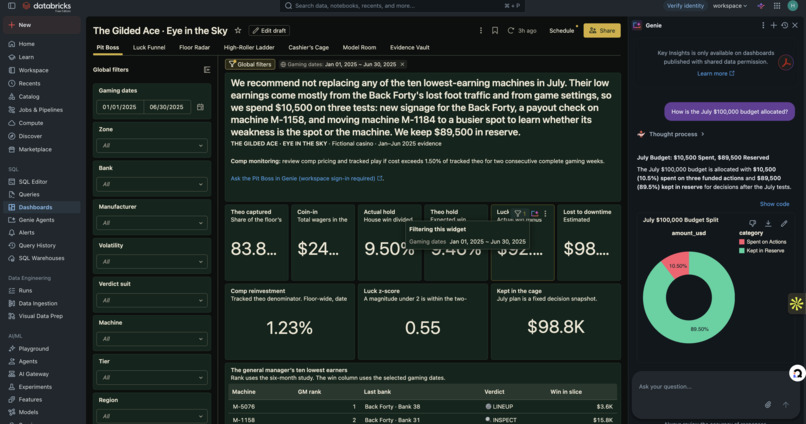
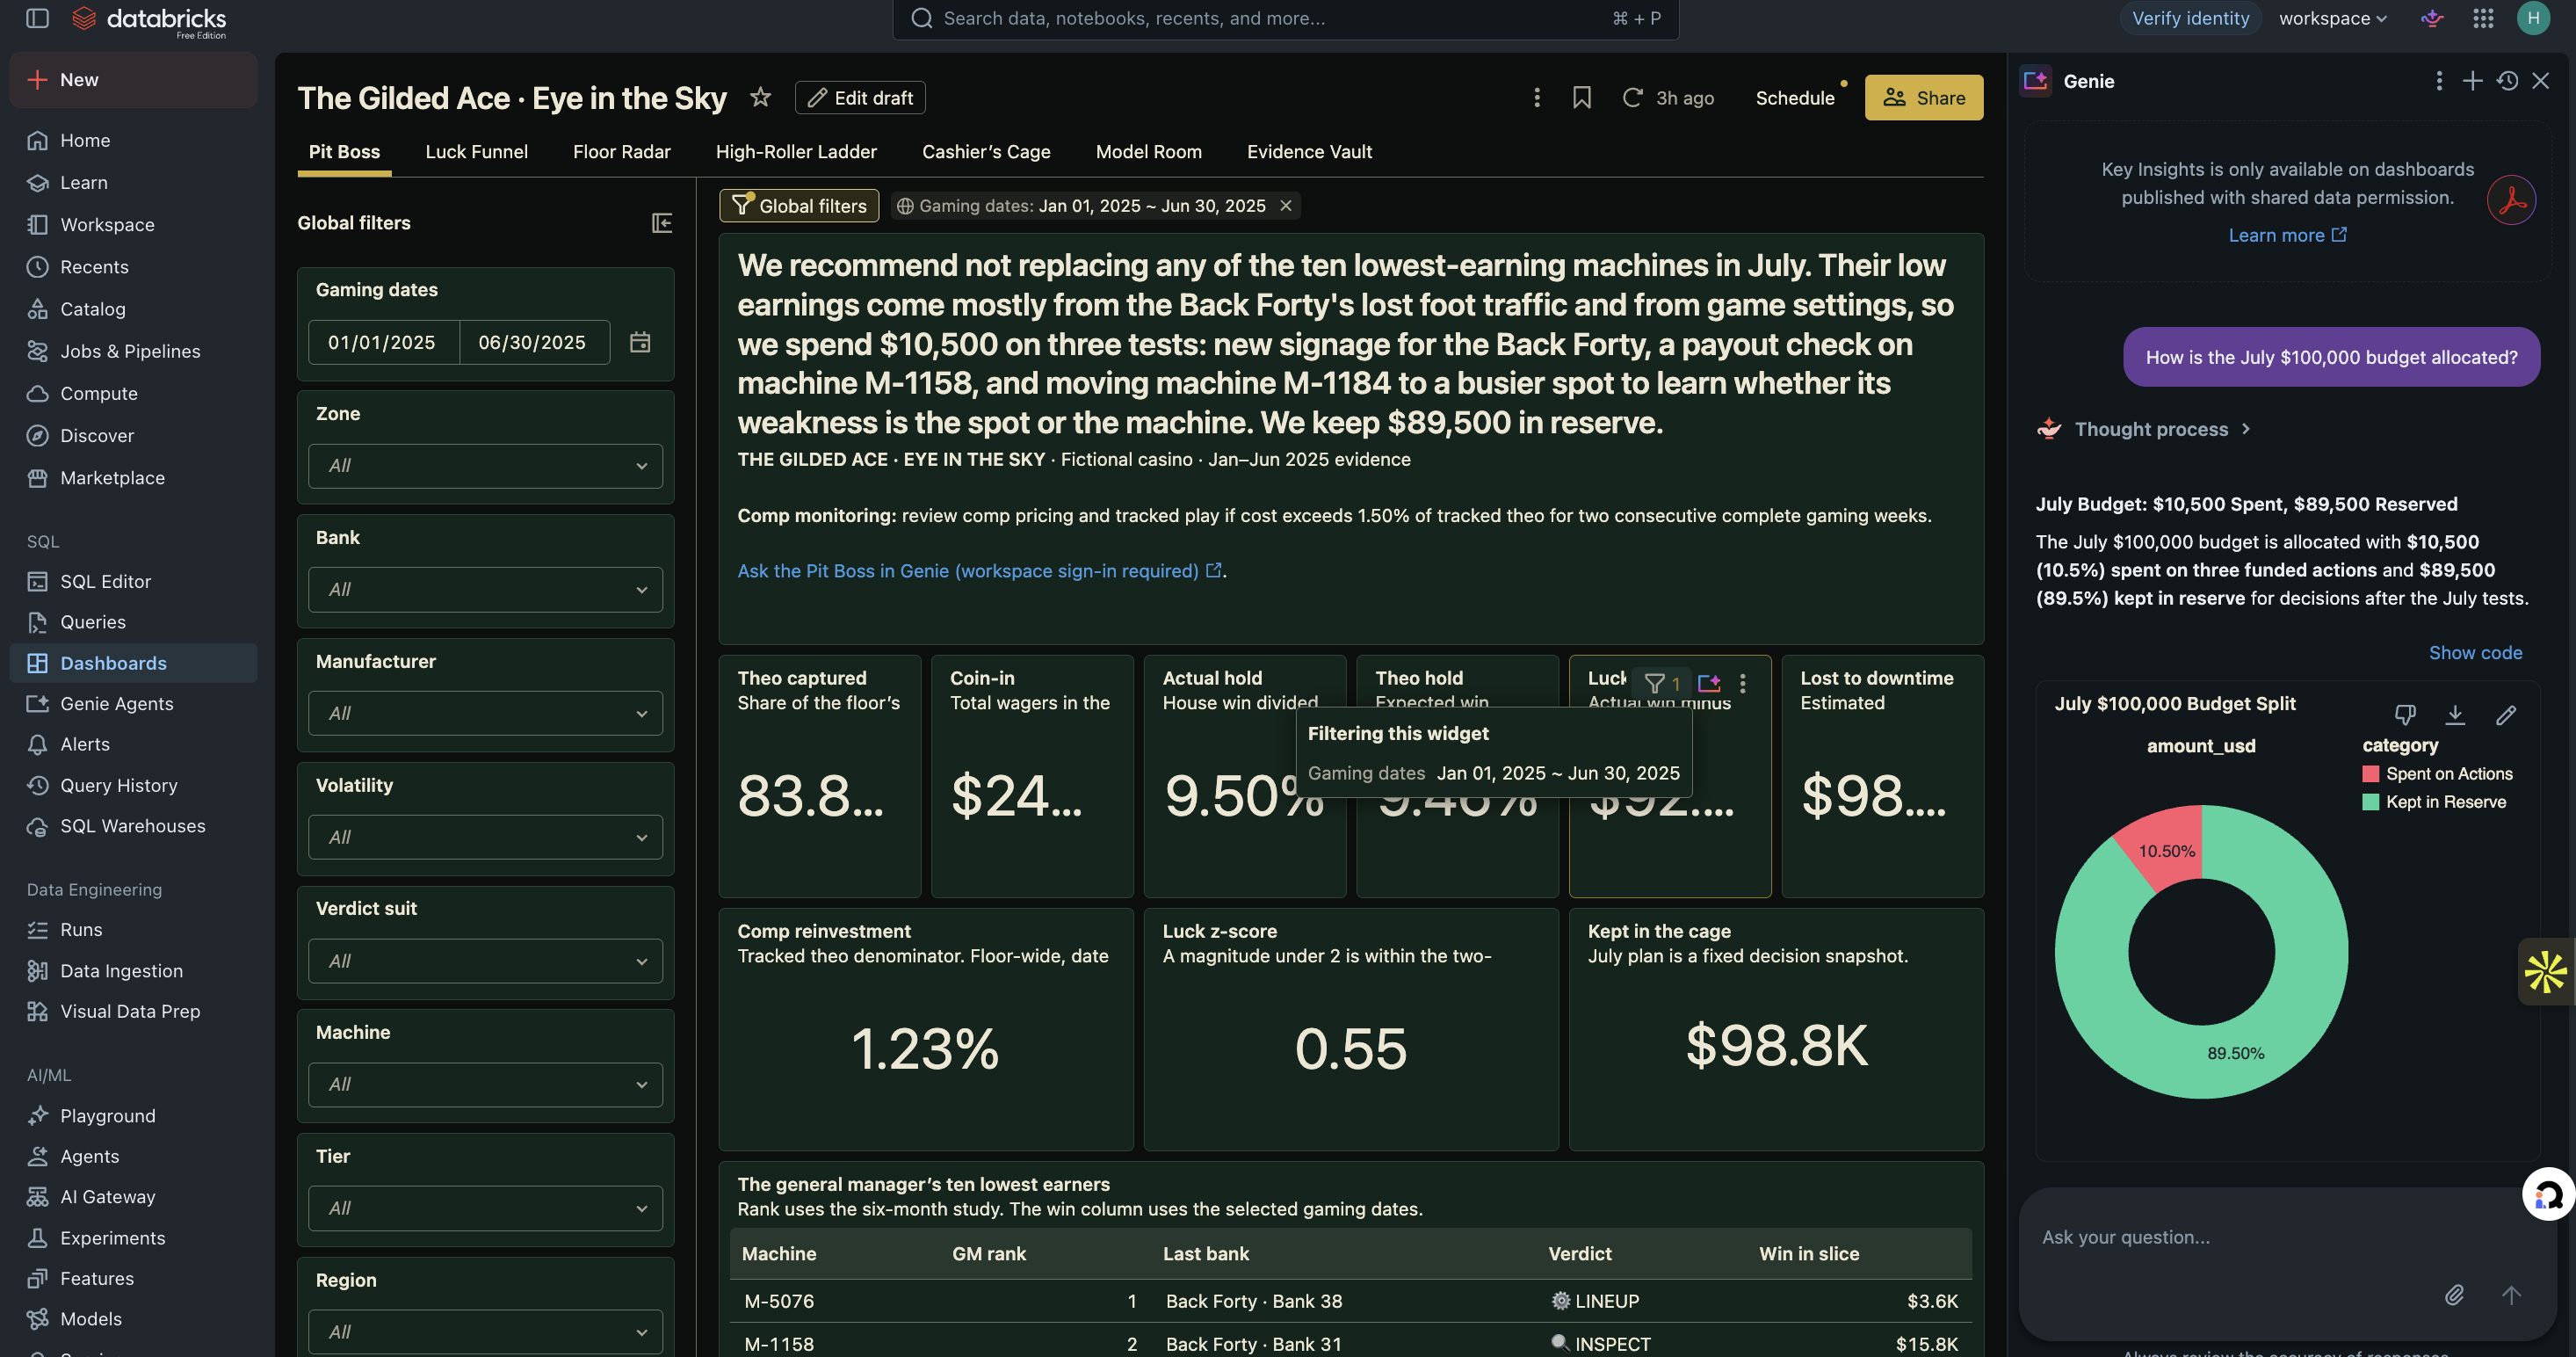
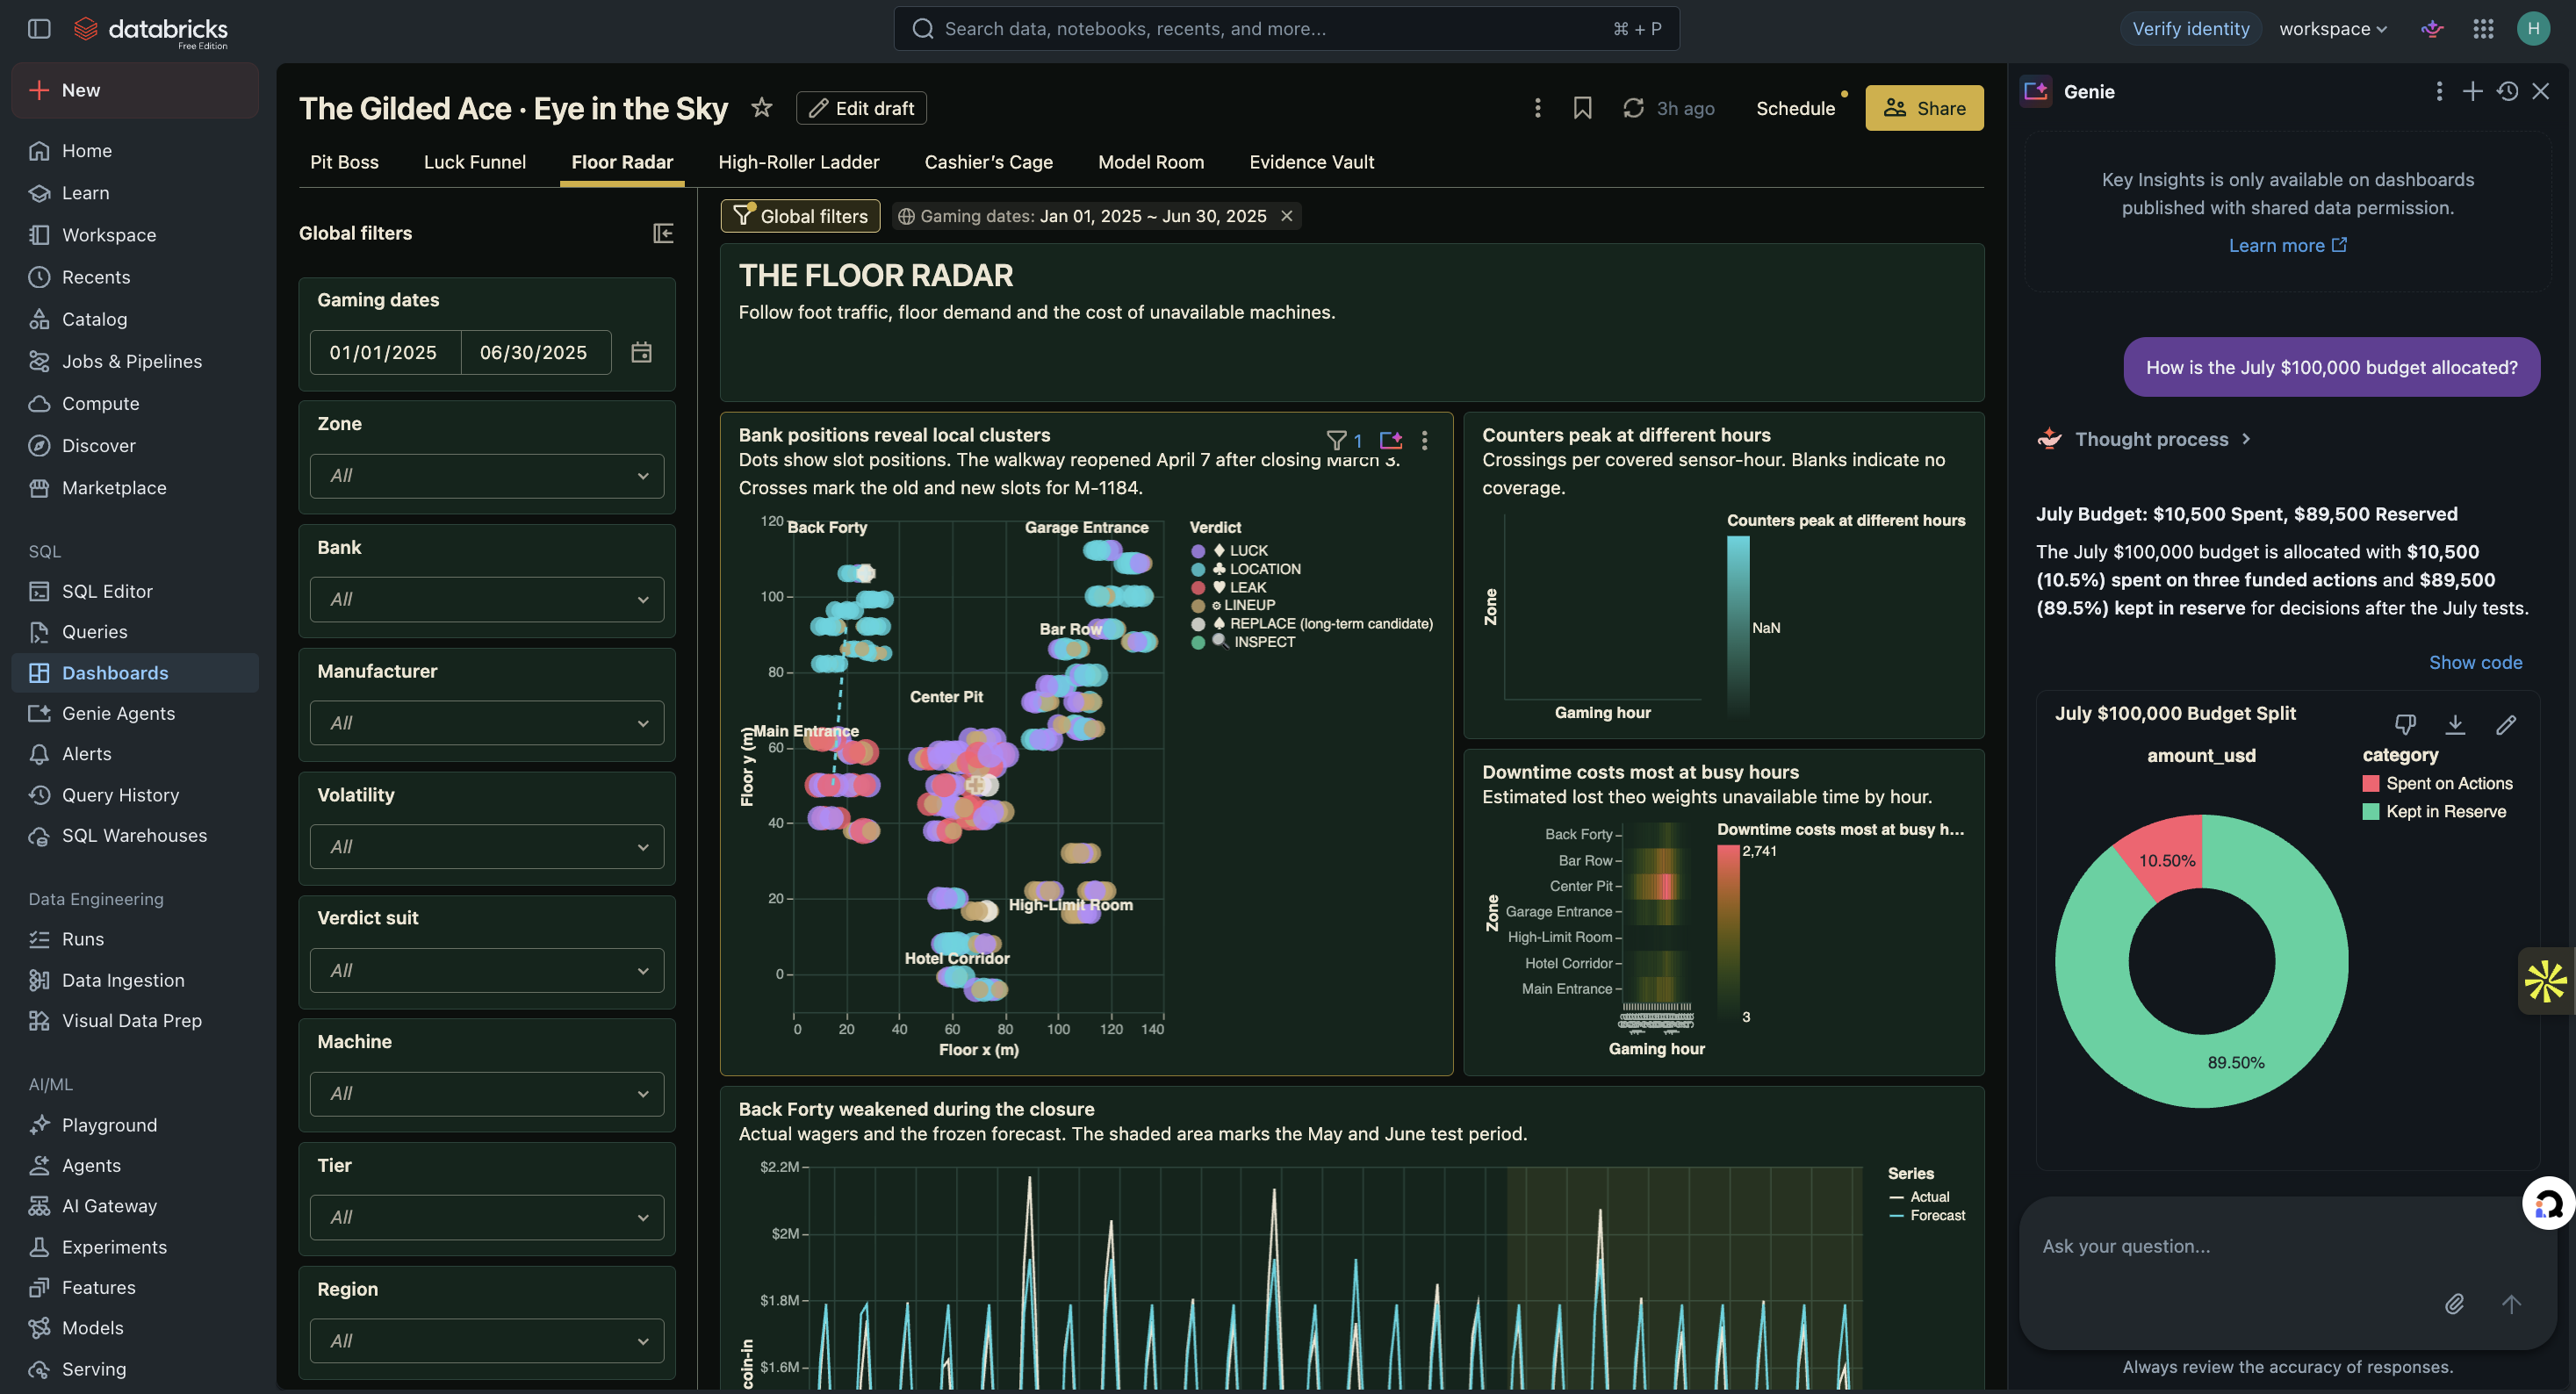
Genie AI is answering the questions in Databricks dahsboard
-
-
Inspiration
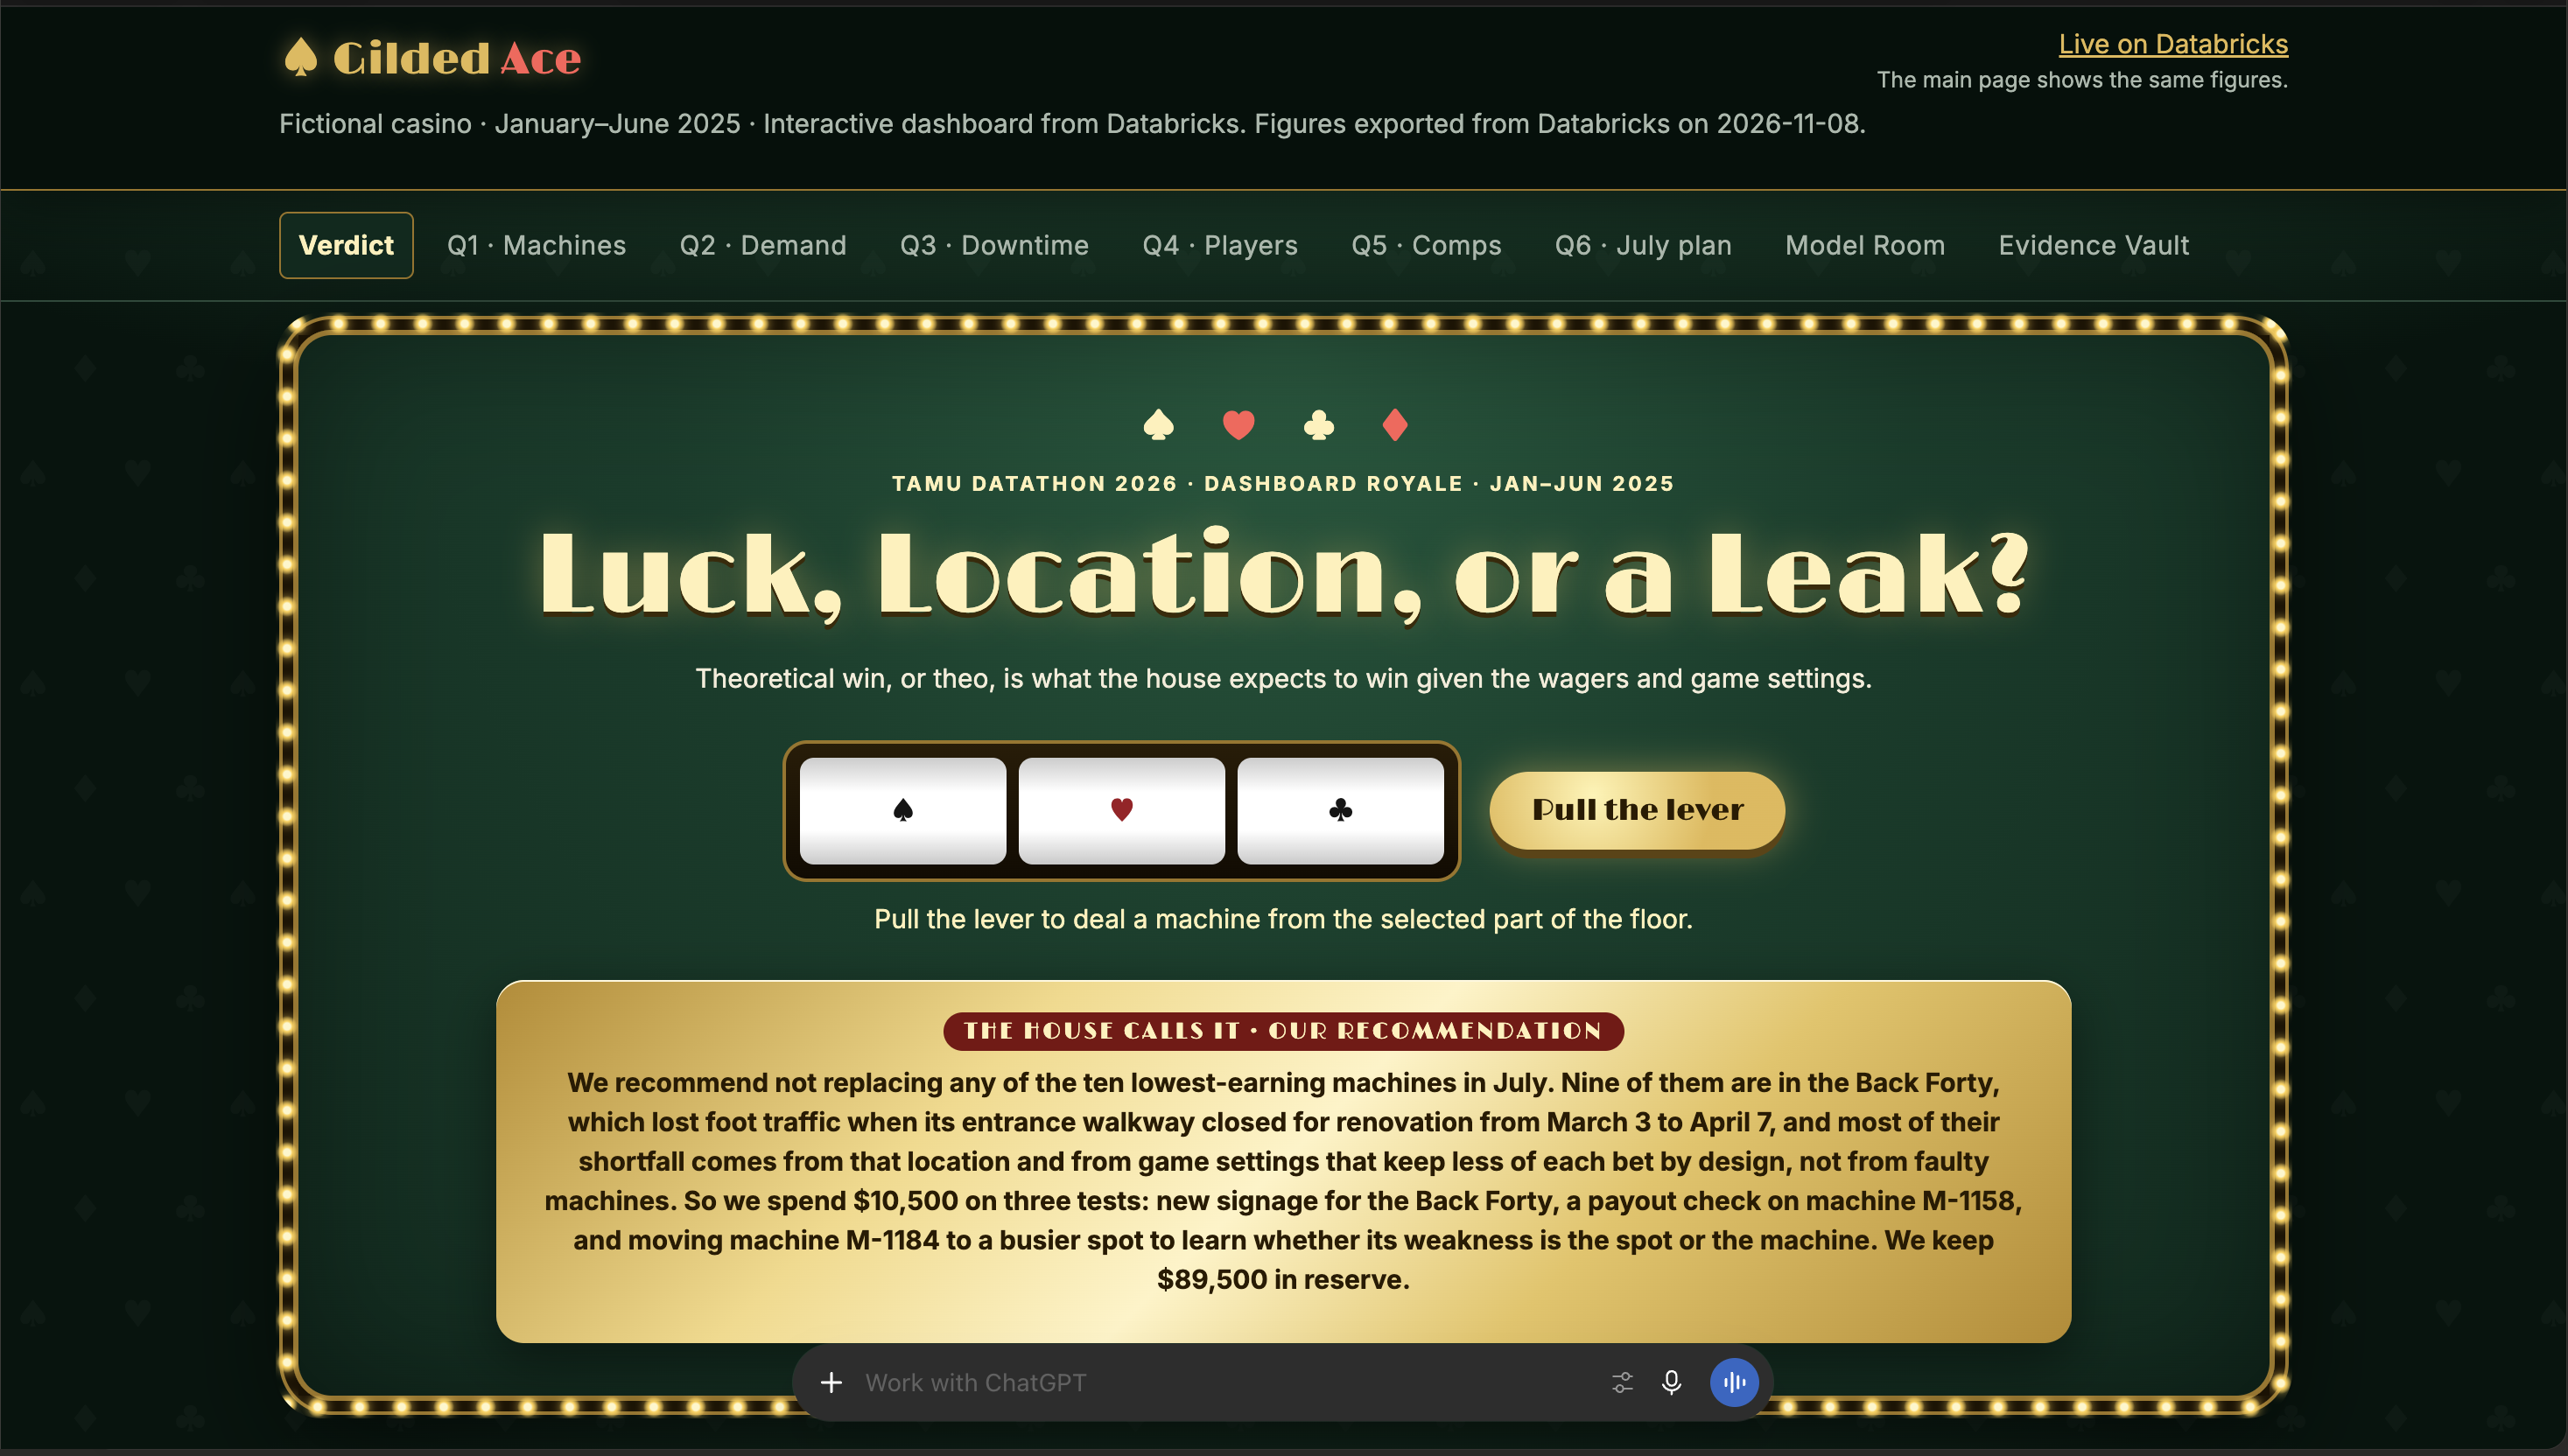
The general manager of The Gilded Ace, a fictional 300-machine casino, wants to replace the ten slot machines that earned the least from January to June 2025. Replacing a machine only helps if the machine is the problem. A machine can earn little because it was unlucky, sat in a quiet spot, was often broken, or runs a game setting that keeps less of each bet by design. We built a dashboard that tests all of these before anyone spends money.
What it does
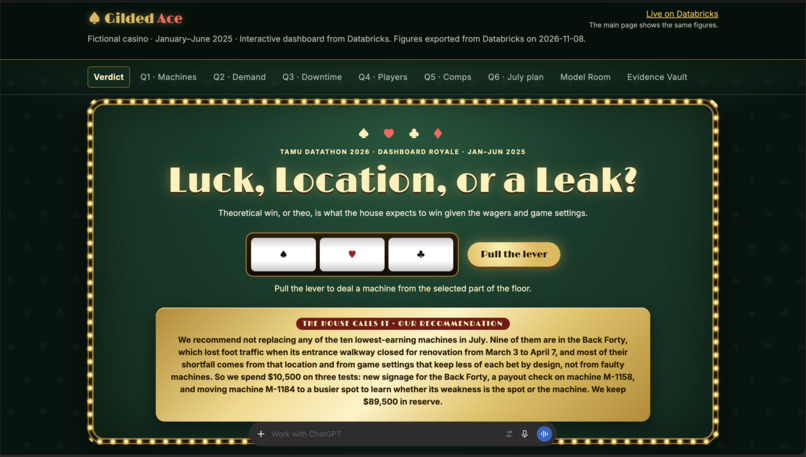
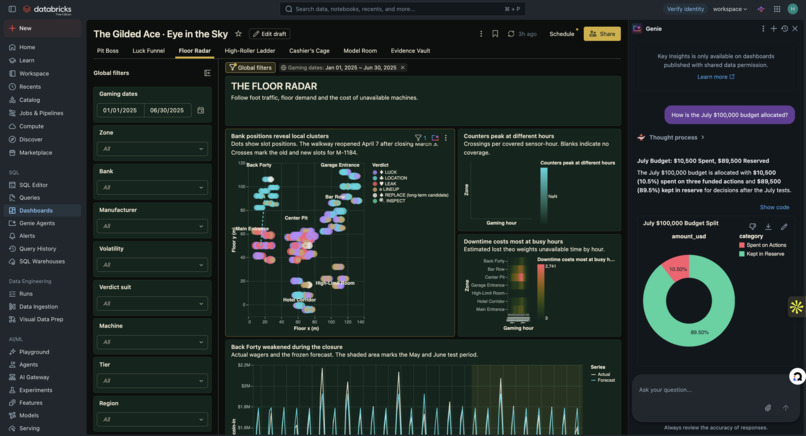
The dashboard opens with one recommendation: do not replace any of the ten in July. Nine of them sit in the Back Forty, which lost foot traffic when its entrance walkway closed for renovation from March 3 to April 7. Most of their shortfall comes from that location and from game settings, not from faulty machines.
It answers the six challenge questions, one view each:
- Q1 Machines: splits each machine's shortfall into downtime, location, game settings, the machine itself and luck. Only M-1158 falls outside normal luck (p = 0.0015 after multiple-comparison adjustment).
- Q2 Demand: how wagers changed by month and zone, and why: weekday mix, events, the walkway closure, playing time and bet size.
- Q3 Downtime: about $98,064 in expected win lost to downtime, peaking around 9 p.m., with Ridgeline machines losing the most.
- Q4 Players: what tracked players wagered, got back and netted. The top 10% produced two-thirds of tracked expected win and netted −$10.5M.
- Q5 Comps: on May 1, rewards became cheaper in points (12.50 to 5.85 points per dollar), adding $3.3M to the economic value of unspent points.
- Q6 July plan: the $100,000 decision, with every option priced.
Plus a Model Room for forecast validation and an Evidence Vault that traces every claim to its gold table, the alternative we tested, and its limits. Date, zone, bank, tier, region and age filters update the views.
The $100,000 July plan
We fund three tests ($10,500) and keep $89,500 in reserve:
| Action | Cost | Expected effect | Uncertainty | How we measure it |
|---|---|---|---|---|
| Signage refresh, Back Forty | $7,500 | About +$86.3K over 12 months if the gap persists | No effect means a $7,500 loss | Back Forty traffic and expected win vs the rest of the floor; extend if it closes at least 25% of the gap by end of August |
| Payout check, M-1158 | $1,200 | +$785 modeled net value | −$682 to +$2,275 | Verify meter, settings and accounting; correct only a confirmed discrepancy |
| Move M-1184 to Center Pit | $1,800 | About +$18.4K over 12 months | −$1,813 to +$1,306 in July | Compare with same-setting Center Pit peers for 28 days; if it catches up, the spot was the problem |
We evaluated and rejected the rest with numbers: replacing the GM's ten (about −$220,655 in July), extra technician shifts (they recover about $131 to $381 of expected win against an $11,520 cost), a bank move, promotions, and a comp pilot that could only detect a 5.77% change against a 2.5% bar.
How we built it
Everything runs on Databricks: the challenge files load into a Unity Catalog volume, then a Delta bronze, silver, and gold pipeline deployed with Databricks Asset Bundles. Gold totals reconcile to the property totals to the cent across multiple date ranges. Luck uses game-math variance; machine effects use day-bootstrap 90% intervals. The forecast is logged in MLflow, the main dashboard is a Databricks AI/BI dashboard, and a Genie space answers questions from the gold tables. Because Databricks dashboards require a sign-in, a Databricks job exports the gold tables to a public, no-login site (HTML, CSS, and JavaScript on Vercel) that shows the same numbers.
The model
A ridge forecast of daily floor coin-in, using weekday, holidays and only events announced by April 30. Trained on January to April, frozen, and scored once on 61 days in May and June: $51,129 average daily error (3.84%) versus $218,258 (16.43%) for a constant baseline. A weekday-mean baseline added later led on April validation but trailed in May and June ($68,699), so events and holidays add modest accuracy. A trend version was tested and rejected. The forecast decides when to do the work: the inspection and move are scheduled in quiet hours, and it showed that extra technician shifts cannot pay for themselves.
Challenges we ran into
- We found a leak in our own model. One event, Locals Appreciation Week, was announced on May 26, after our forecast date. We removed it, refit, and rescored once. Error improved from $55,271 to $51,129, and we disclose both.
- Statistically weaker is not the same as worth replacing. Several machines are measurably below their peers, but by less than one month's lease.
- Making Databricks public. Judges cannot sign in, so we added a public site fed by a Databricks export.
- Resisting the urge to spend. Every big-ticket option lost money in July. Spending to look busy was the expensive mistake. ## Accomplishments that we're proud of
- Using uncarded play as a natural control group for the comp change: carded wagers rose 2.59% relative to uncarded, and an apparent drop in player value disappeared.
- Every number on the site traces back to a gold table and a SQL file.
- A casino-themed design (marquee lights, a slot lever, suit-coded verdicts, playing-card budget) that stays readable for a general manager. ## What we learned Separating luck from performance changes the answer. A floor that won within half a standard deviation of expectations does not need new machines; it needs foot traffic back in the Back Forty. ## What's next for The Gilded Ace Read both tests at the end of August and extend the signage if the Back Forty closes at least 25% of its traffic and expected-win gaps, and replace M-1184 only if it stays below its Center Pit peers.
Built With
- ai/bi-dashboards
- claude
- css
- databricks
- databricks-asset-bundles
- databricks-sql
- delta-lake
- genie
- github
- html
- javascript
- mlflow
- playwright
- python
- scikit-learn
- sql
- unity-catalog
- vercel
