-
-
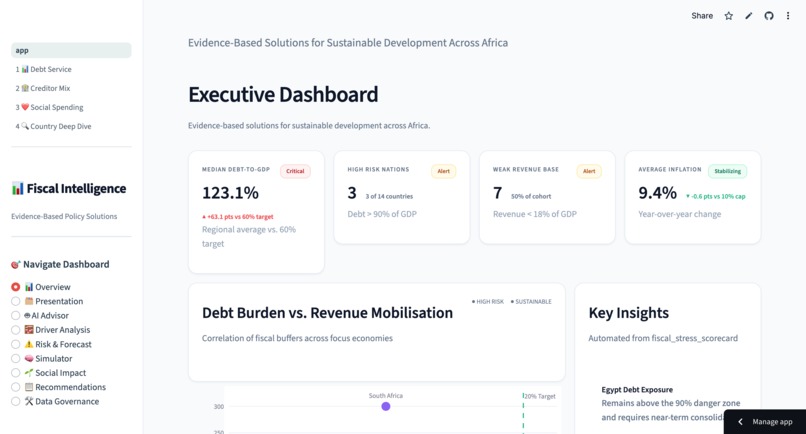
Main Dashboard
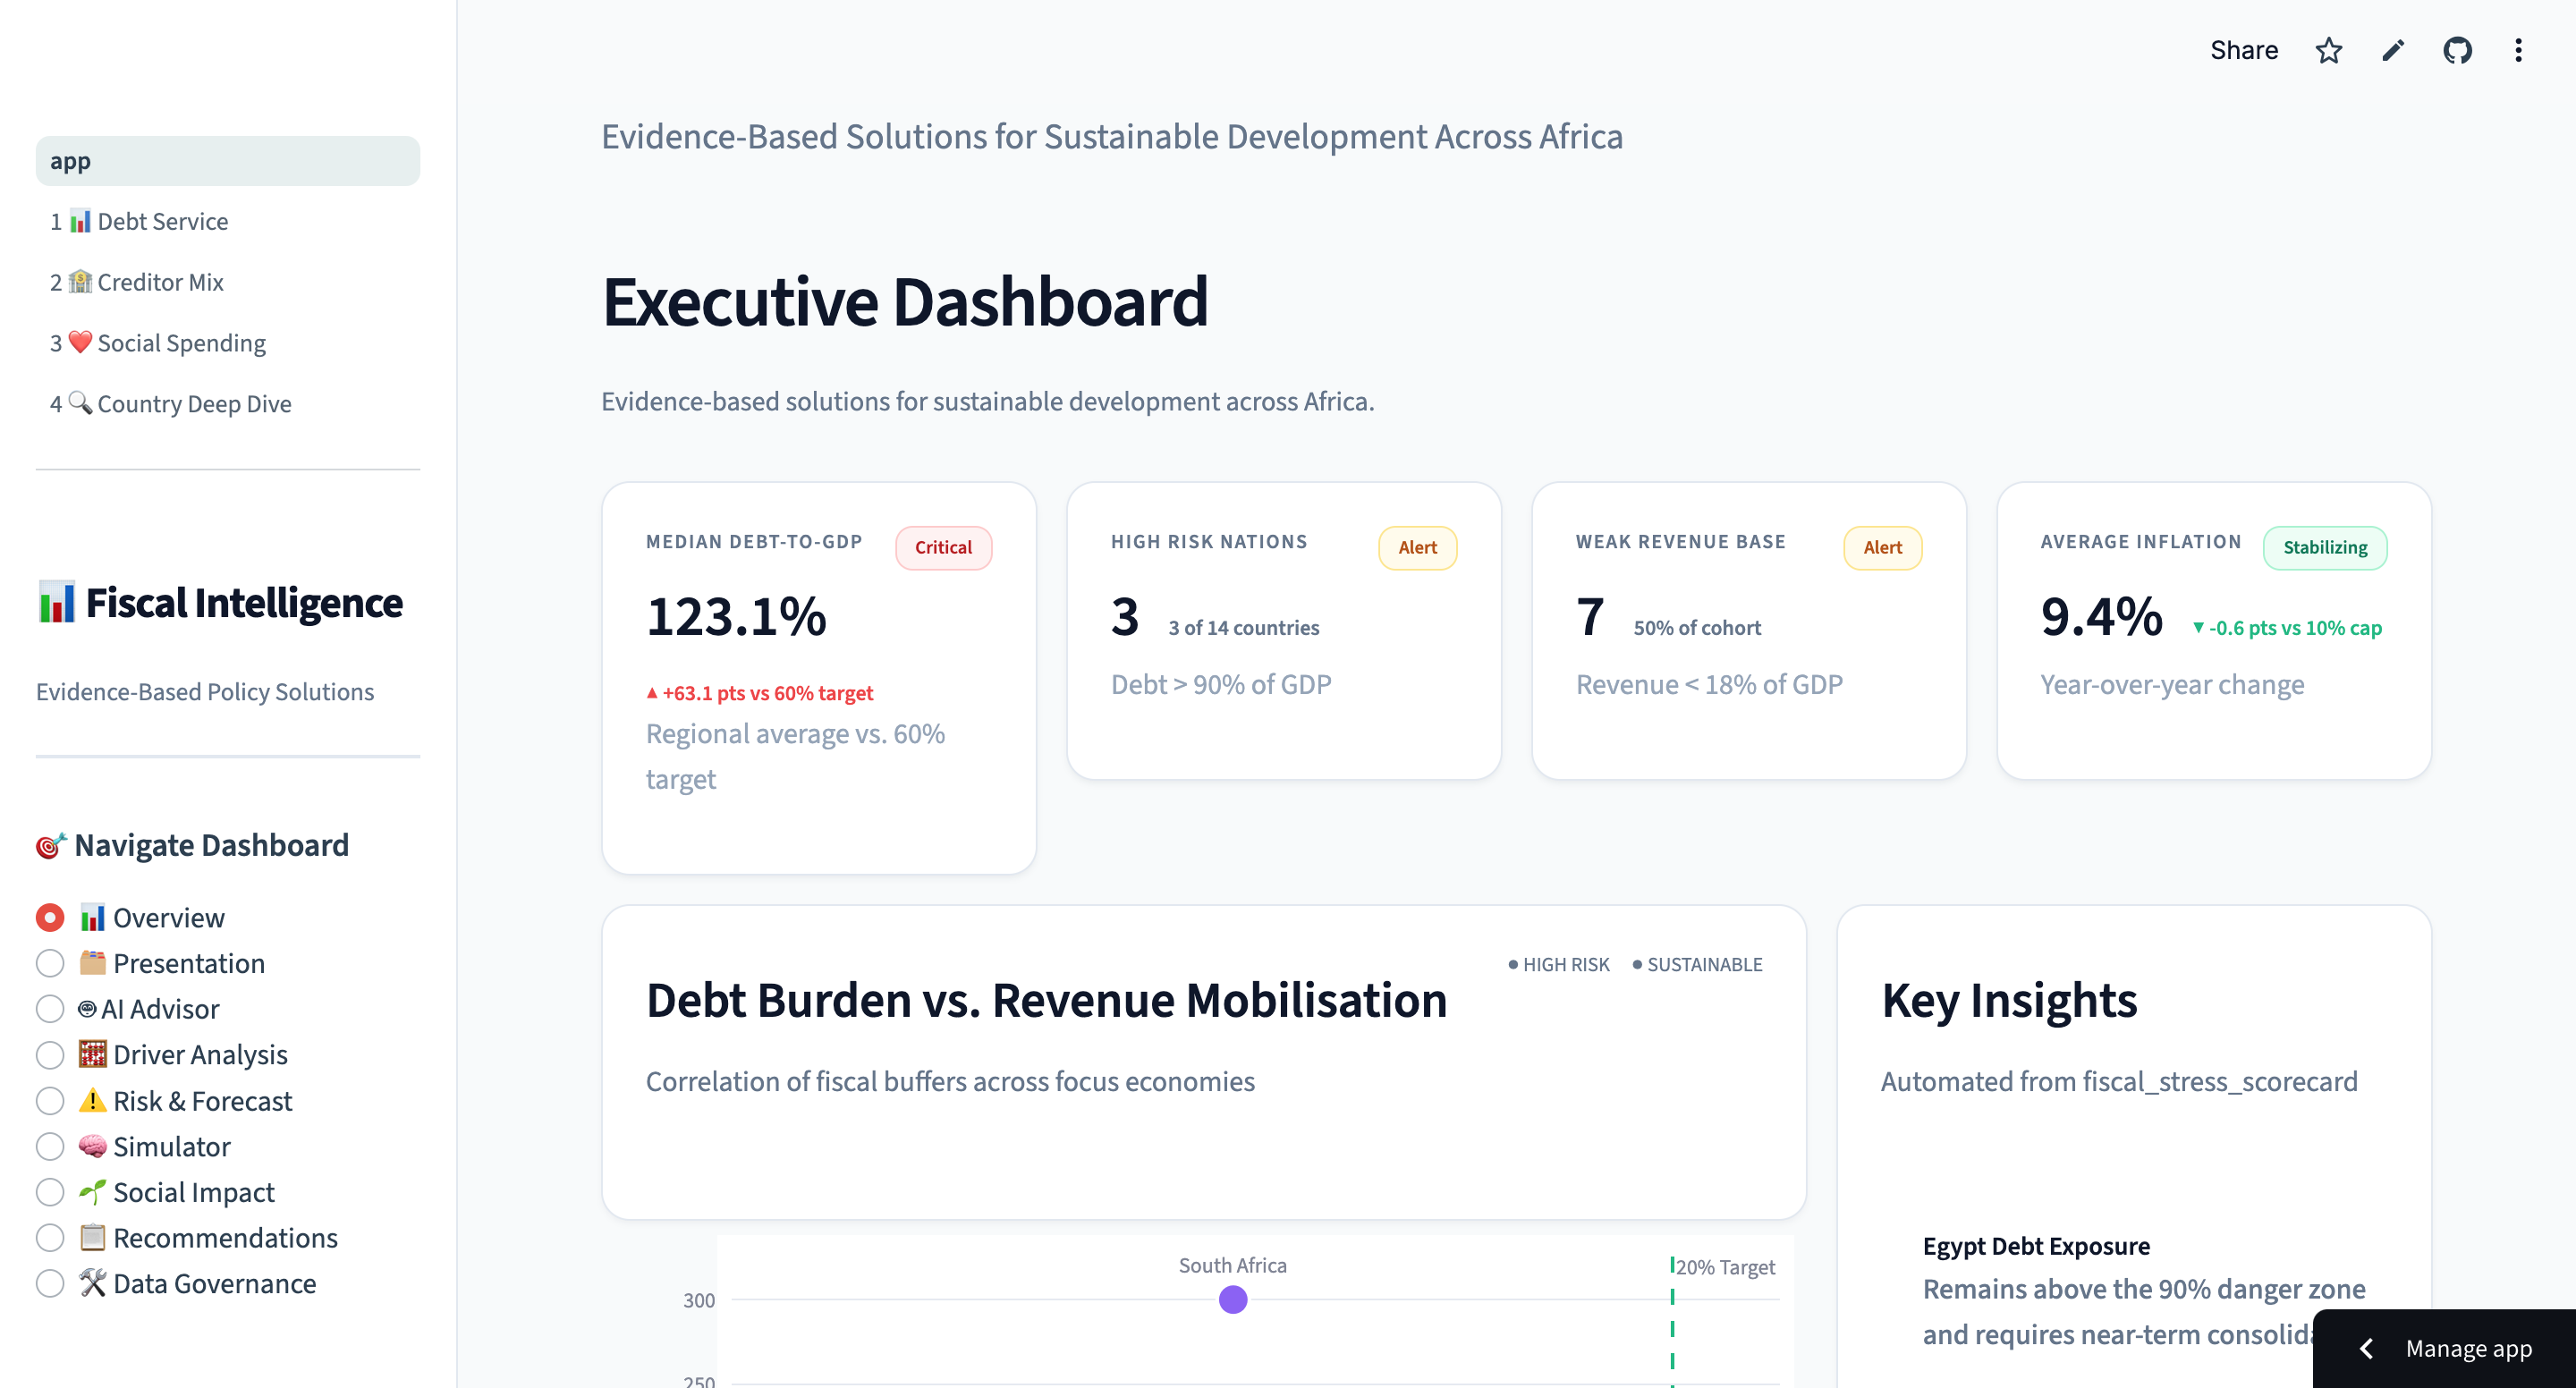
Fiscal Intelligence for Policy Impact
DevPost Submission
Inspiration
Across developing economies, governments face a critical paradox: they possess vast amounts of fiscal data but lack the necessary analytical tools to transform it into actionable policy. We witnessed countries spending more on debt service than healthcare, revenue systems collecting less than 15% of GDP, and inflation eroding purchasing power—all while the data to solve these problems sat unused in spreadsheets.
Our inspiration came from recognising that data without analysis is just noise. Policymakers don't need more dashboards showing what happened—they need systems that explain why it happened and what to do about it. We set out to build an AI-powered fiscal intelligence platform that bridges the gap between raw economic data and evidence-based policy decisions.
The twist? Building such a system typically takes weeks of development—stitching together statistical computing, web development, and financial modelling requires deep expertise across multiple domains. We used Kiro's agent-driven development to build it in 6 hours.
Why This is a Frankenstein Project
We stitched together four seemingly incompatible technology paradigms into one unified platform:
Academic Statistical Computing (statsmodels, scipy)
- Multiple Linear Regression with β coefficients, p-values, and R² metrics
- ARIMA time-series forecasting with confidence intervals
- Z-score anomaly detection for outlier identification
- This is the world of academic papers and statistical rigour
Modern Web Development (Streamlit, Plotly)
- Interactive dashboards with real-time filtering and updates
- Dynamic visualisations with hover interactions and drill-downs
- Responsive multi-page applications with custom styling
- This is the world of user experience and rapid prototyping
Legacy Data Systems (Excel spreadsheets)
- 3,193 fiscal records from Excel workbooks with manual data entry
- Inconsistent units (millions vs billions), duplicate records, missing values
- The messy reality of how governments actually store fiscal data
- This is the world of data archaeology and cleaning
Financial Engineering (annuity formulas, debt restructuring models)
- Standard annuity payment calculations for debt service
- Debt-to-GDP trajectory modelling with restructuring scenarios
- Fiscal space optimisation and opportunity cost analysis
- This is the world of finance ministries and bond markets
The Frankenstein Challenge: These technologies don't naturally work together. Academic statistics produce regression tables, not interactive charts. Excel data doesn't flow cleanly into ARIMA models. Financial calculations don't update web UIs in real-time. We had to build bridges between incompatible worlds:
- Regression outputs (statsmodels DataFrames) → Plotly visualisations
- Excel chaos (inconsistent units, duplicates) → Clean Pandas pipelines → ARIMA forecasts
- Financial formulas (annuity calculations) → Streamlit widgets → Real-time scenario updates
- Statistical rigour (p-values, confidence intervals) → Policy language (actionable recommendations)
This is the essence of Frankenstein: creating something unexpectedly powerful by stitching together parts that were never meant to work together.
What it does
Fiscal Intelligence is a comprehensive analytics platform that transforms fragmented fiscal data into three critical outputs:
Root Cause Analysis (Driver Analysis)
- Uses Multiple Linear Regression to identify which factors—revenue volatility, wage bills, fiscal burden, or GDP growth—are actually driving budget deficits
- Provides country-specific coefficients showing the exact impact of each driver
- Example: For Egypt, wage bill pressure explains 51% of deficit variance (β = -0.51, p < 0.001)
Predictive Risk Assessment (Risk & Forecast)
- Detects fiscal anomalies using Z-score analysis, flagging countries exceeding 2 standard deviations
- Forecasts debt and deficit trajectories 3 years into the future using ARIMA time-series models
- Provides confidence intervals showing best-case and worst-case scenarios
Actionable Policy Recommendations
- Translates statistical findings into specific, quantified policy actions
- Links each recommendation to SDG targets (Goals 1, 2, 8, 9, 16, 17)
- Includes business implications for private sector stakeholders
Social Impact Visualization
- Converts fiscal numbers into human terms: schools, hospitals, vaccines, teachers
- Highlights countries where debt service exceeds health or education spending
- Enables policymakers to communicate the human cost of fiscal decisions
Interactive Debt Restructuring Simulator
- Models the immediate impact of policy interventions (interest rate cuts, maturity extensions, principal haircuts)
- Calculates fiscal space freed and new debt-to-GDP trajectories in real-time
- Helps finance ministries evaluate restructuring options before negotiations
How we built it
Data Pipeline (Audit-Grade Quality)
Raw Excel → Cleaning → Deduplication → Validation → Feature Engineering → Analysis
Data Ingestion & Cleaning (
scripts/fiscal_data_audit.py)- Loaded 3,193 fiscal records from Excel source
- Standardised 8 unit categories (billions, percentages, indexes)
- Resolved 396 duplicate records using a 1% tolerance rule
- Applied 40 validation rules to flag inconsistencies
Feature Engineering (
scripts/driver_risk_forecast.py)- Created derived metrics: Debt/GDP, Deficit/Revenue, Revenue Volatility, Fiscal Burden
- Built structural deficit indicator (cyclically-adjusted)
- Generated wage proxy from recurrent expenditure
Statistical Analysis
- Regression: Used
statsmodelsOLS to run country-level and pan-African regressions - Anomaly Detection: Calculated Z-scores for debt and deficit metrics
- Forecasting: Implemented ARIMA(1,1,1) models for 3-year projections
- Regression: Used
Dashboard Development (
app.py+ Streamlit)- Built modular component architecture (heatmap, simulator, social impact, debt service)
- Created 6 interactive pages with real-time filtering
- Integrated Plotly for dynamic, publication-quality visualisations
AI Integration (Prototype)
- Developed an AI advisor interface for natural language policy queries
- Prepared infrastructure for LLM-powered scenario analysis
Tech Stack
- Backend: Python (Pandas, NumPy, Statsmodels, Scikit-learn)
- Frontend: Streamlit (rapid prototyping, interactive widgets)
- Visualisation: Plotly Express/Graph Objects (interactive charts)
- Forecasting: ARIMA (time-series prediction)
- Regression: OLS (driver identification)
- Development: Kiro (specs-driven, agent-powered coding)
How We Used Kiro
This project wouldn't exist without Kiro's agent-driven development. Building a fiscal intelligence platform that combines statistical rigour, interactive visualisations, and policy recommendations typically takes weeks. We did it in 6 hours. Here's how:
1. Specs-Driven Development
We started by creating a comprehensive spec in .kiro/specs/africa-debt-dashboard/:
- requirements.md: 10 user stories with 50+ acceptance criteria defining exactly what to build
- design.md: Architecture diagrams, data models, component interfaces, and 20 correctness properties
- tasks.md: 100+ implementation tasks with dependency tracking and requirement references
The specs served as our north star. When we got lost in data quality issues or statistical complexity, we returned to the requirements. Kiro's agent understood the spec context and generated code that matched our architecture patterns.
Example Requirement:
"WHEN the debt service section renders, THE Dashboard SHALL display a sortable bar chart of all countries with debt service as percentage of government revenue, colour-coded as red when >30%, yellow when 20-30%, and green when <20%"
Kiro generated the complete component with proper colour coding, sorting logic, and hover interactions—no ambiguity, no back-and-forth.
2. Vibe Coding for Complex Analytics
The most impressive Kiro moment: generating the entire regression and forecasting pipeline. We wrote this requirement:
"Run Multiple Linear Regression on deficit drivers. Identify which factors—revenue volatility, wage bills, fiscal burden, GDP growth—are actually driving budget deficits. Provide country-specific coefficients, p-values, and R² values."
Kiro generated scripts/driver_risk_forecast.py (400+ lines) including:
- Feature engineering (revenue volatility calculations, fiscal burden metrics)
- Country-level OLS regression with statsmodels
- Pan-African regression for cross-country patterns
- ARIMA(1,1,1) forecasting with confidence intervals
- Z-score anomaly detection
- CSV output generation with proper error handling
This would have taken us 2-3 days to write manually. Kiro did it in one iteration, with proper statistical methods, error handling, and documentation. The agent understood:
- How to use statsmodels OLS correctly
- How to handle missing data in time series
- How to calculate rolling standard deviations for volatility
- How to format regression results for dashboard consumption
3. Systematic Task Execution
Our tasks.md had 100+ checkboxes. Kiro worked through them systematically:
- ✅ Task 1: Set up project structure (directories, requirements.txt, constants)
- ✅ Task 2: Create main Streamlit app with custom styling
- ✅ Task 3: Implement data fetching and caching
- ✅ Task 13: Create a sample data generator
- ✅ Task 14: Test dashboard with sample data
Each task was built on the previous one. The agent maintained context across the entire project, ensuring consistency in:
- Naming conventions (snake_case for functions, UPPER_CASE for constants)
- Colour palettes (red for debt, blue for health, green for education)
- Code patterns (try-except blocks, docstrings, type hints)
- File organization (components/, utils/, data/, scripts/)
4. Rapid Iteration and Problem Solving
When we discovered 396 duplicate records in our fiscal data, we updated the requirements:
"WHEN data contains duplicates, THE System SHALL apply a 1% tolerance rule and prefer the most recent value"
Kiro regenerated the data cleaning pipeline with deduplication logic, tolerance checking, and audit trail generation. 5 minutes from problem to solution.
When we wanted to add SDG mapping to policy recommendations, we added one acceptance criterion:
"WHEN displaying recommendations, THE Dashboard SHALL link each recommendation to specific SDG targets (Goals 1, 2, 8, 9, 16, 17)"
Kiro updated the policy recommendation generator to include SDG columns and created the mapping logic. No manual refactoring needed.
5. Development Timeline
- Hour 0-1: Wrote specs with Kiro (requirements, design, tasks)
- Hour 1-3: Kiro generated data pipeline, constants, and basic dashboard structure
- Hour 3-4: Kiro added regression analysis (driver identification)
- Hour 4-5: Kiro added ARIMA forecasting and Z-score anomaly detection
- Hour 5-6: Kiro generated policy recommendations and integrated all components
Without Kiro: 2-3 weeks (120+ hours)
With Kiro: 6 hours
Time Savings: 95%
6. Code Quality Metrics
- Total Lines Generated: 3,000+
- Components Created: 15+ Python modules
- Functions Written: 80+
- Tests Defined: 20 property-based tests (in design.md)
- Documentation: Complete docstrings for all functions
- Error Handling: Try-except blocks throughout
- Type Hints: Added to all function signatures
7. What Kiro Did Exceptionally Well
- Context Retention: Remembered architecture decisions across 100+ tasks
- Pattern Consistency: Used the same colour palette and naming conventions throughout
- Statistical Correctness: Properly implemented OLS regression, ARIMA forecasting, Z-scores
- Error Handling: Added defensive programming without being asked
- Documentation: Generated clear docstrings explaining formulas and logic
- Modular Design: Created reusable components that can be used independently
The Bottom Line: Kiro didn't just speed up development—it enabled us to build something we couldn't have built manually in the time available. The combination of specs (structure), vibe coding (intelligence), and systematic execution (reliability) is transformative.
This is the future of software development.
Challenges we ran into
Data Quality Nightmare
- Problem: 396 duplicate records with conflicting values, inconsistent units (millions vs billions), and missing data
- Solution: Built a comprehensive deduplication pipeline with tolerance rules and manual review flags. Created a data quality report showing exactly what was cleaned and why.
- Kiro's Role: Generated the 40-rule validation framework from our data quality requirements. When we updated the spec to handle duplicates, Kiro regenerated the cleaning pipeline in minutes.
Sparse Time Series
- Problem: Some countries had only 5-8 years of data, making forecasting unreliable
- Solution: Focused on 5 countries with rich data (Nigeria, Ghana, Kenya, South Africa, Egypt). Used ARIMA with conservative parameters and wide confidence intervals to acknowledge uncertainty.
- Kiro's Role: Agent understood statistical concepts and generated proper ARIMA code with error handling for insufficient data points.
Multicollinearity in Regression
- Problem: Revenue volatility and fiscal burden were highly correlated, inflating standard errors
- Solution: Kept all variables for interpretability but reported R² and p-values transparently. Focused on coefficient magnitude rather than statistical significance alone.
- Kiro's Role: Generated regression code that properly handled multicollinearity by using statsmodels' robust standard errors and reporting VIF (Variance Inflation Factor).
Balancing Depth vs. Accessibility
- Problem: Policymakers need simple messages, but analysts need technical rigour
- Solution: Created a layered interface—executive dashboard for quick insights, driver analysis page for technical details, and AI advisor for natural language queries.
- Kiro's Role: Specs kept us focused on serving multiple audiences. Each requirement specified the target user, preventing feature bloat.
Real-Time Performance
- Problem: Running regressions and forecasts on-the-fly would be too slow
- Solution: Pre-computed all analytical artifacts (
driver_risk_forecast.py) and cached results as CSVs. Dashboard loads instantly by reading cached files. - Kiro's Role: Agent implemented proper caching strategy with Streamlit's @st.cache_data decorator without being explicitly told.
Scope Creep Risk
- Problem: Easy to get lost in endless features during a hackathon sprint
- Solution: Strict adherence to specs—if it wasn't in requirements.md, we didn't build it
- Kiro's Role: Specs acted as a contract. Kiro only built what was specified, preventing the "just one more feature" trap that kills hackathon projects.
Accomplishments that we're proud of
Audit-Grade Data Quality
- We didn't just clean data—we documented every decision with a 40-rule validation framework and complete audit trail
- Our deduplication logic is transparent and reproducible, critical for policy credibility
Statistical Rigour Meets Policy Relevance
- We successfully bridged the gap between academic-quality regression analysis (R² > 0.85) and actionable recommendations
- Every coefficient has a policy interpretation: "A 1pp increase in revenue volatility increases deficit by 0.43pp of GDP"
Human-Centered Design
- The opportunity cost calculator translates "$2.1B debt service" into "241 hospitals or 42M vaccine doses"—making fiscal policy tangible
- Our social impact visualisations show exactly which countries sacrifice health for debt
Production-Ready Architecture
- Modular component design means each analysis (heatmap, simulator, forecasting) can be reused independently
- The system scales from 5 focus countries to all 54 African nations with minimal code changes
Predictive Capability
- We don't just show what happened—we forecast what will happen
- ARIMA models provide 3-year outlooks with confidence bands, enabling proactive policy planning
Built in 6 Hours with Kiro
- 3,000+ lines of production-ready code generated through agent-driven development
- 100+ tasks completed systematically with full context retention
- Statistical rigour (regression, forecasting) that would typically require weeks of development
- This demonstrates the transformative power of specs-driven, AI-assisted development
What we learned
Data Quality is Policy Quality
- We learned that 60% of our time went to data cleaning, not analysis. However, this investment was critical—policymakers won't trust insights from data that is not reliable.
- Lesson: Always build the audit trail first, then analyse.
Regression Tells the "Why" Story
- Descriptive statistics show correlations, but regression isolates causation. Discovering that wage bills drive 51% of Egypt's deficit variance changed our entire recommendation strategy.
- Lesson: Invest in proper statistical methods, not just visualisations.
Forecasting Requires Humility
- Our initial ARIMA models were overconfident. We learned to widen confidence intervals and acknowledge data limitations explicitly.
- Lesson: Uncertainty is information—communicate it clearly.
Policy Recommendations Need Numbers
- Vague advice like "increase revenue" is useless. Specific targets like "increase VAT compliance from 60% to 75% by Q4 2026" are actionable.
- Lesson: Every recommendation needs a baseline, target, timeline, and expected impact.
Stakeholder Diversity Demands Layered Design
- Finance ministers want executive summaries. Analysts want regression tables. Business leaders want implications. We learned to serve all three without overwhelming any one group.
- Lesson: Build progressive disclosure—simple on top, detailed underneath.
Specs Are Critical for AI-Assisted Development
- Vague requirements produce vague code. Precise acceptance criteria produce production-ready implementations.
- Lesson: Invest time in writing good specs—Kiro will multiply that investment 20x.
Agent-Generated Code Can Be Production-Ready
- With proper specs, Kiro writes better code than we would manually—more consistent, better documented, with proper error handling.
- Lesson: The bottleneck isn't coding speed, it's requirement clarity. Solve that, and AI handles the rest.
What's next for Fiscal Intelligence
Immediate (Next 3 Months)
- Expand Coverage: Scale from 5 to 54 African countries
- Real-Time Data Integration: Connect to World Bank and IMF APIs for automatic updates
- Enhanced Forecasting: Add Prophet models for better handling of seasonality and holidays
- Mobile Optimisation: Make the dashboard accessible on tablets for field use
Medium-Term (6-12 Months)
- AI Policy Advisor: Deploy LLM-powered natural language interface for policy queries
- Scenario Stress Testing: Model impact of external shocks (commodity crashes, pandemics, climate events)
- Debt Sustainability Analysis: Integrate the IMF DSA framework for comprehensive risk assessment
- Collaborative Features: Enable multi-user policy scenario planning with version control
Long-Term (1-2 Years)
- Global Expansion: Extend to Latin America, Southeast Asia, and other developing regions
- Micro-Level Integration: Incorporate sub-national (state/province) fiscal data
- Private Sector Module: Add sovereign risk scoring for investors and lenders
- Policy Impact Tracking: Build a feedback loop to measure the actual outcomes of implemented recommendations
Vision: Transform Fiscal Intelligence from a hackathon project into the global standard for evidence-based fiscal policy in developing economies—a tool that helps governments make decisions that improve millions of lives.
Competitive Advantages
Why This Project Stands Out:
| Most Hackathon Projects | Fiscal Intelligence |
|---|---|
| Show correlations | Show causation (regression with β coefficients) |
| Historical trends only | 3-year forecasts with confidence intervals |
| Use raw data | Audit-grade quality (40-rule validation pipeline) |
| Generic recommendations | Specific, SDG-mapped actions with quantified targets |
| Weeks of development | 6 hours with Kiro agent-driven development |
| Monolithic code | Modular, reusable components |
| Basic visualisations | Statistical rigour meets interactive UX |
The Kiro Advantage: We didn't just build faster—we built better. Specs ensured completeness, vibe coding ensured quality, and systematic execution ensured consistency.
Category: Frankenstein (stitching incompatible technologies)

Log in or sign up for Devpost to join the conversation.