-
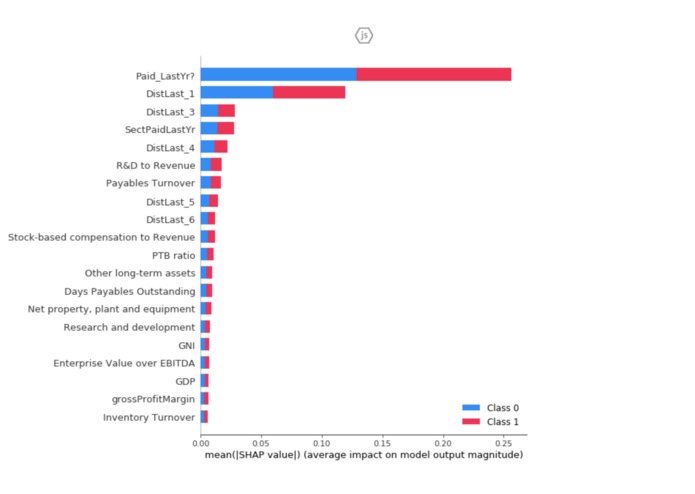
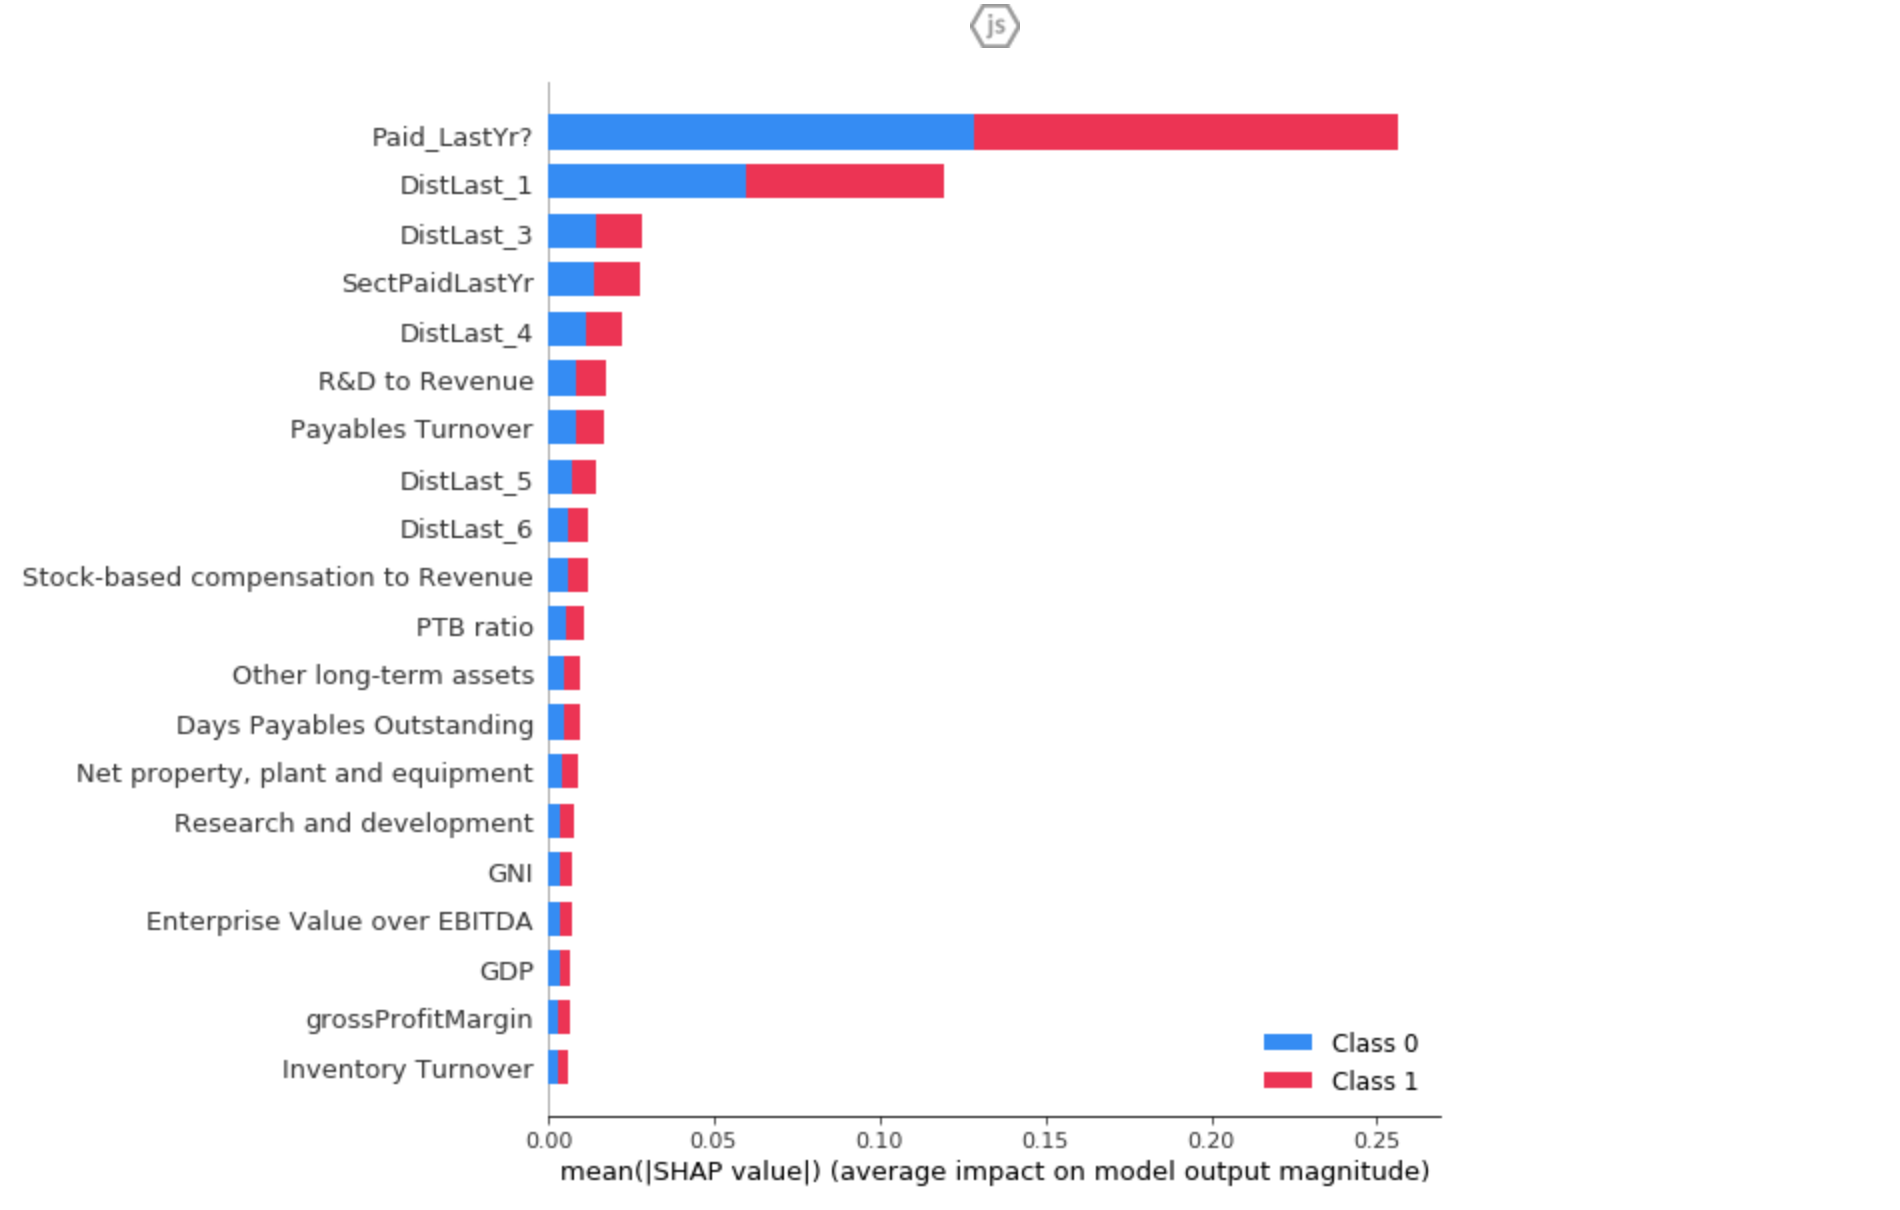
Classifier Model Feature Analysis (SHAP)
-
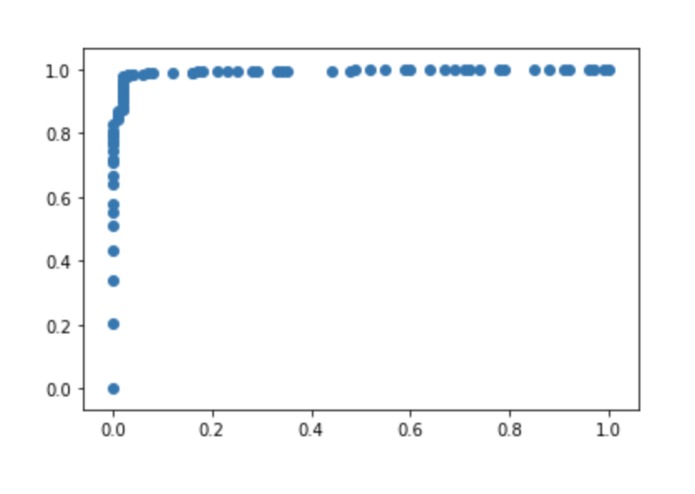
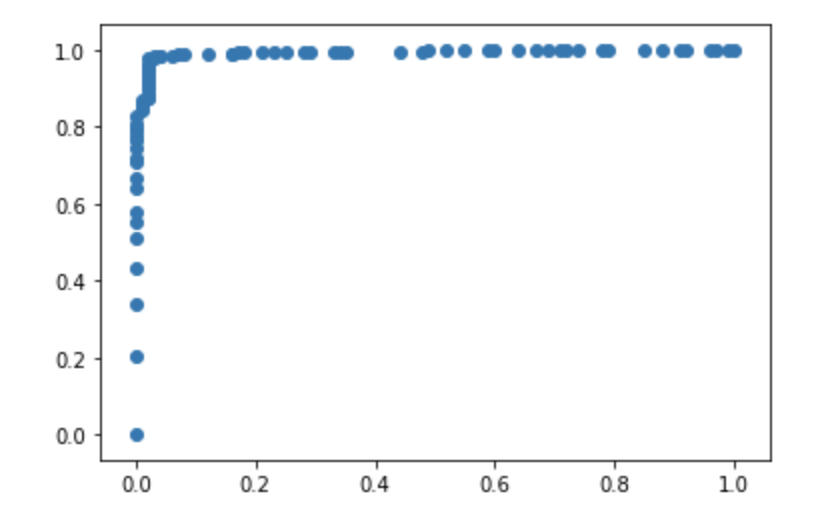
Receiver Operating Characteristic (ROC) Curve - Classification Model
There exists a massive information asymmetry in the financial space, due to the lack of access to market insights that effectively link current market outcomes to future outlooks. The efficient market hypothesis suggests that a market encompasses all cumulative knowledge to present for any security, but how can that information be effectively leveraged to yield substantial predictive value for the future? While there exist technologies to predict short-term returns by holding long-and-short stock positions, there is a deficiency in long-term value investment analysis.
This elemental issue gave birth to the Dividend Dichotomy. Our project builds a customary data pipeline through data preprocessing, cleaning and feature engineering to make two Scikit-learn models - a classifier to predict the probability of a dividend payment and a Regressor to predict the dividend amount in case one is declared. Using these models, the user has access to informed estimates for dividend payouts for each stock over a 10-year (decade-long) period.
For model development, financial information was retrieved from Quandl and ModellingPrep APIs, and extensively processed to output unique year-firm rows representing company financials at different points in time. We proceeded to leverage data science libraries including pandas, numpy and scipy to conduct missing value imputation and feature engineering of dynamic variables. Then, the processed data was ordinal- and one-hot-encoded, and trained on a RandomForest and AdaBoost for a comparison on performance. The RandomForestClassifier and Regressors were selected and pickle-ized. Finally, a Monte Carlo Simulation was conducted over 10 years and 1000 parallel scenarios to track the varied paths in the future for a single stock. To ease the process for the user, only five generic growth rates are taken from the user, and all 92 variables for the model are approximately engineered from the same, keeping in mind the trade-off between convenience and accuracy. The primary software stack included a front-end for user input, controlled dynamically by extensive Javascript that would process input data into Firebase. Subsequently, a Flask server would pass the company growth rates into the Monte Carlo simulation file explained above, and return a 10-element array for each stock representing yearly dividend estimates for a decade into the future.
There were several challenges we experienced, mainly incomplete and incoherent data from APIs that required extensive imputation and engineering, which can distort underlying fundamental relationships between the features and the response variable. Moreover, we experienced difficulties in appropriately handling our dynamic variable updates in the Monte Carlo simulations and certain technical issues in effectively implementing Flask and Firebase connections.
As first-year students, we were really proud of our ability to design a coherent stack, effectively passing data from the front-end to the back-end and so forth. Moreover, our classifier algorithm for dividends had an accuracy of 97.9%, a recall of 99.3% and a F1 of 98.7%. The project was also an immense learning experience, exposing us to the dynamics of effective data manipulation and model development (including feature selection and variance analysis amongst others) in order to develop accurate and predictive systems. It also helped us refine our skills in full-stack management, and the integration responsibilities that accompany therewith.
In the future, we aim to improve Dividend Dichotomy's simulation code to effectively handle dynamic variables, and also improve run times to get faster predictions from the model (by exploring techniques like Kubernetes for deployment). Also, we plan to work extensively on the interface to make it more interactive, user-friendly and intuitive, and present graphical analysis from the model's outputs to provide more valuable insights to the end-user.


Log in or sign up for Devpost to join the conversation.