-
-

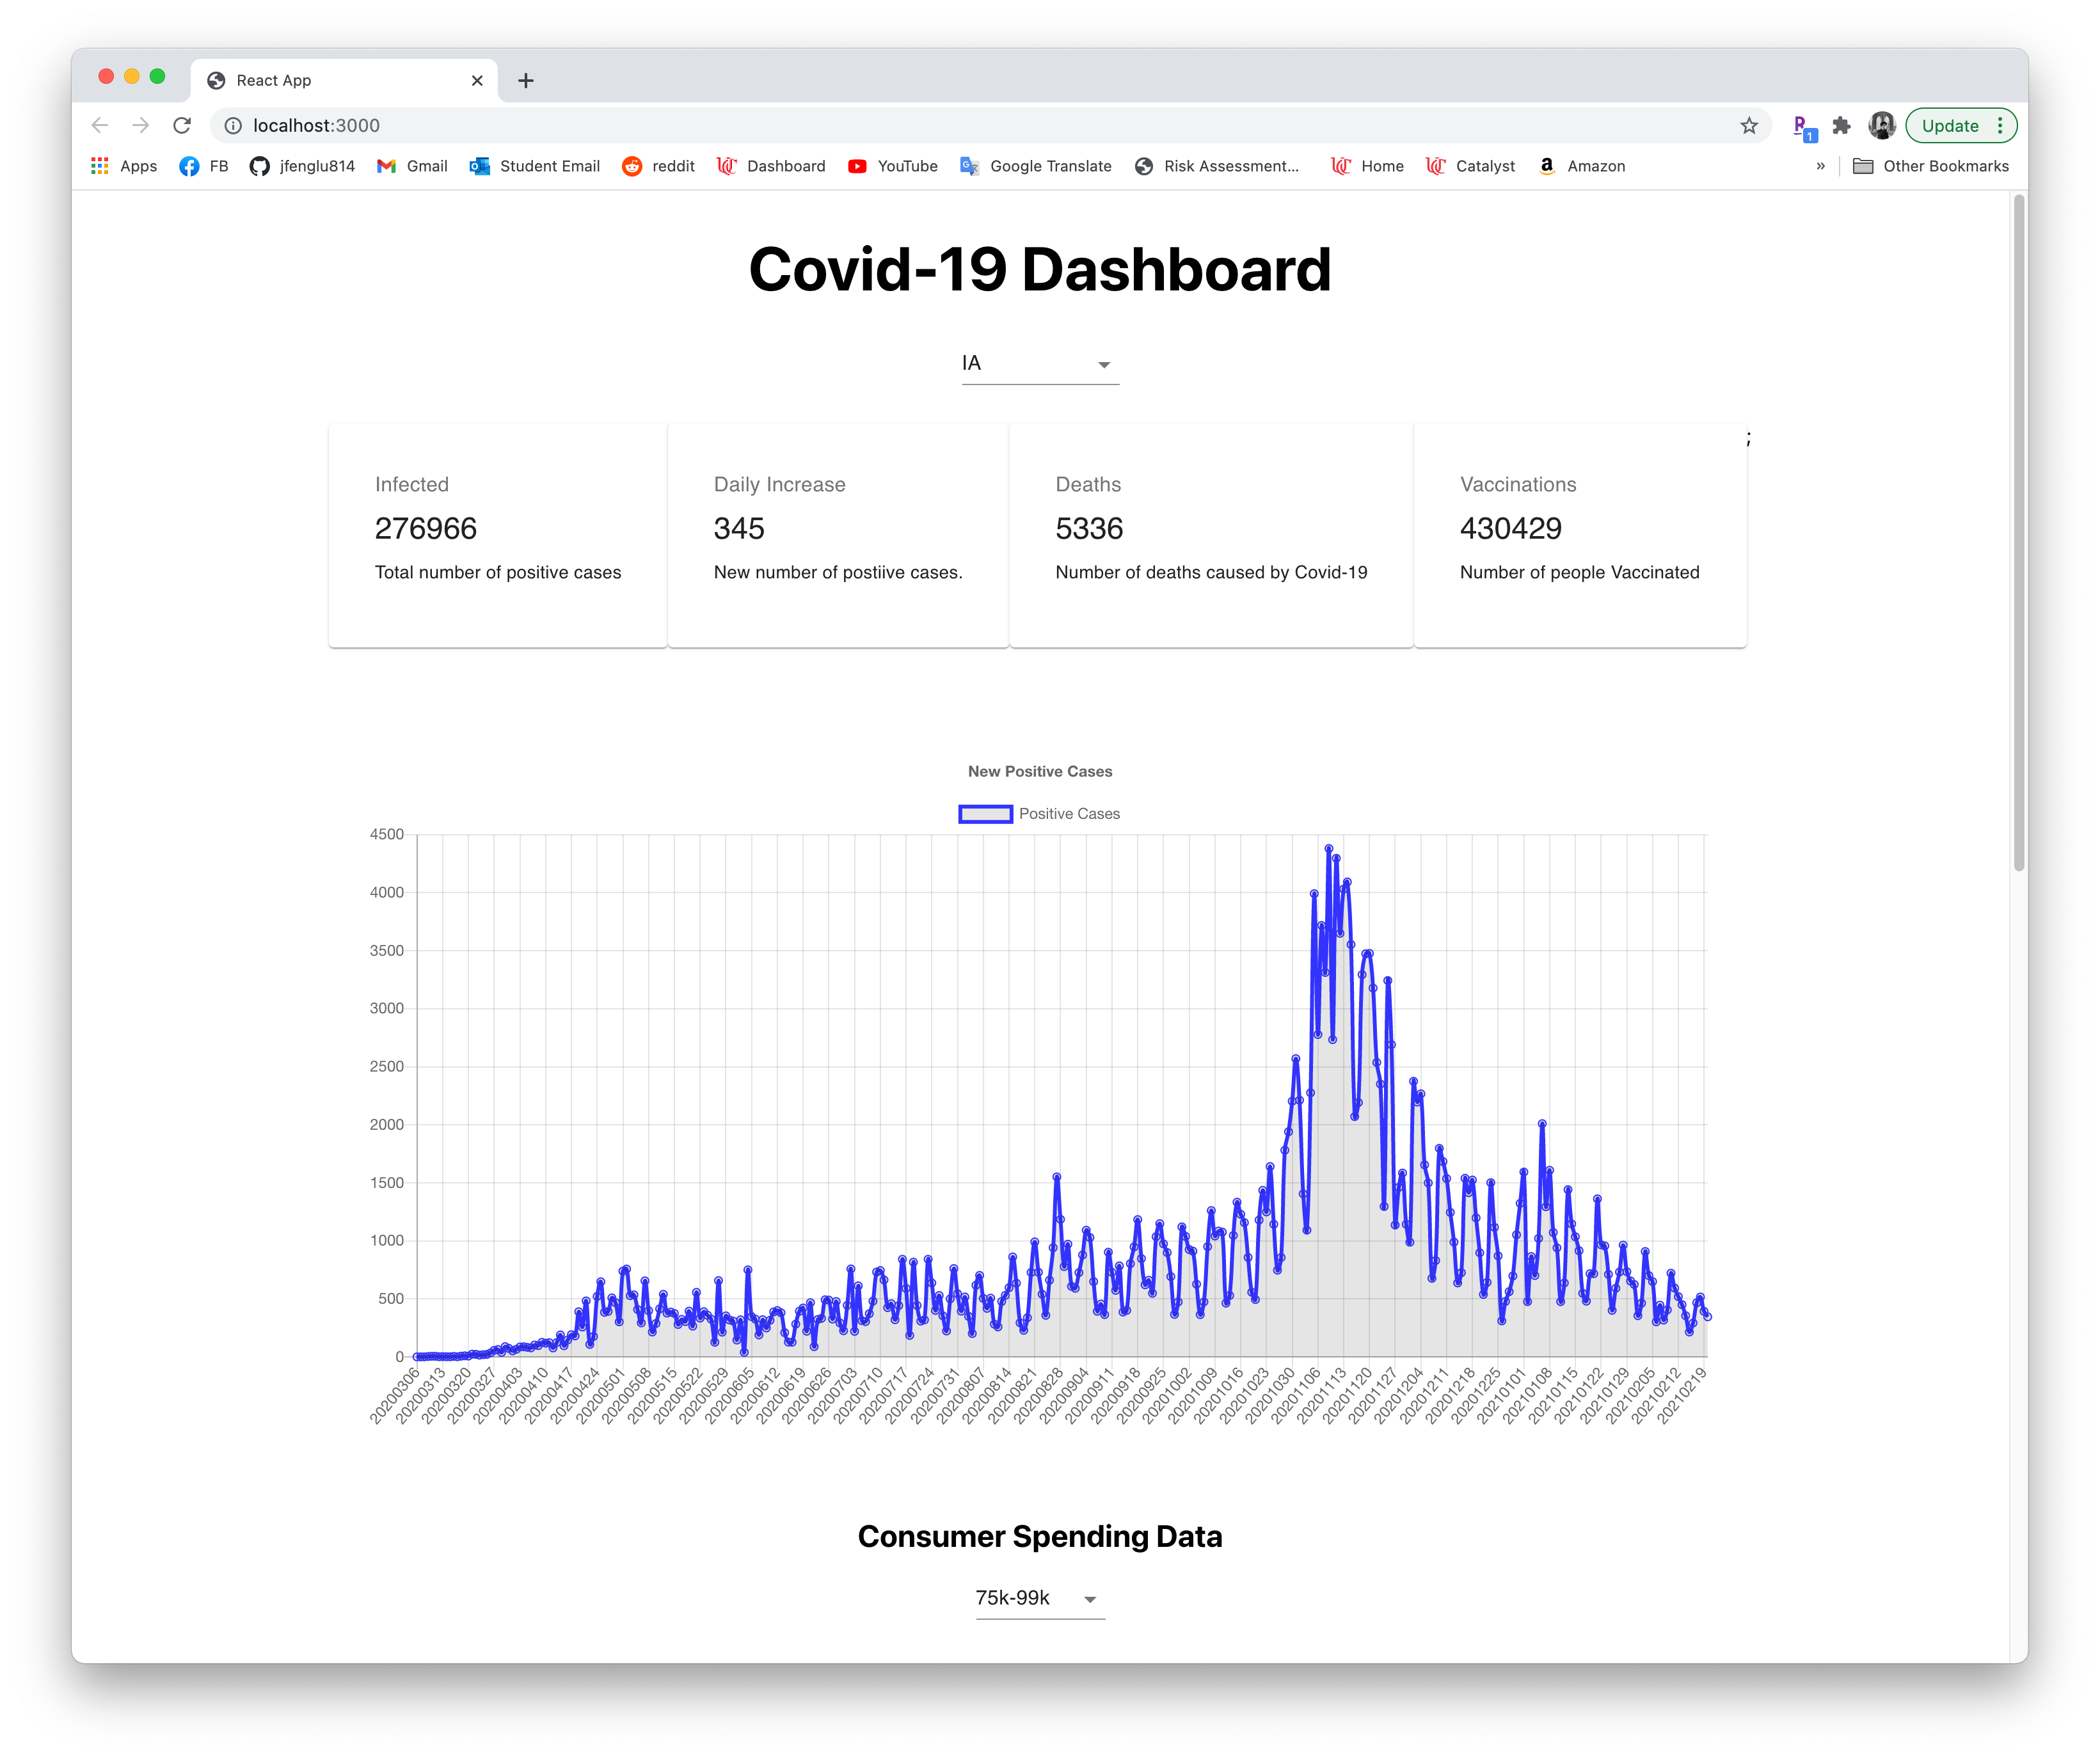
Dashboard
-

Can choose data between states
-

Total spending based on income bracket
-

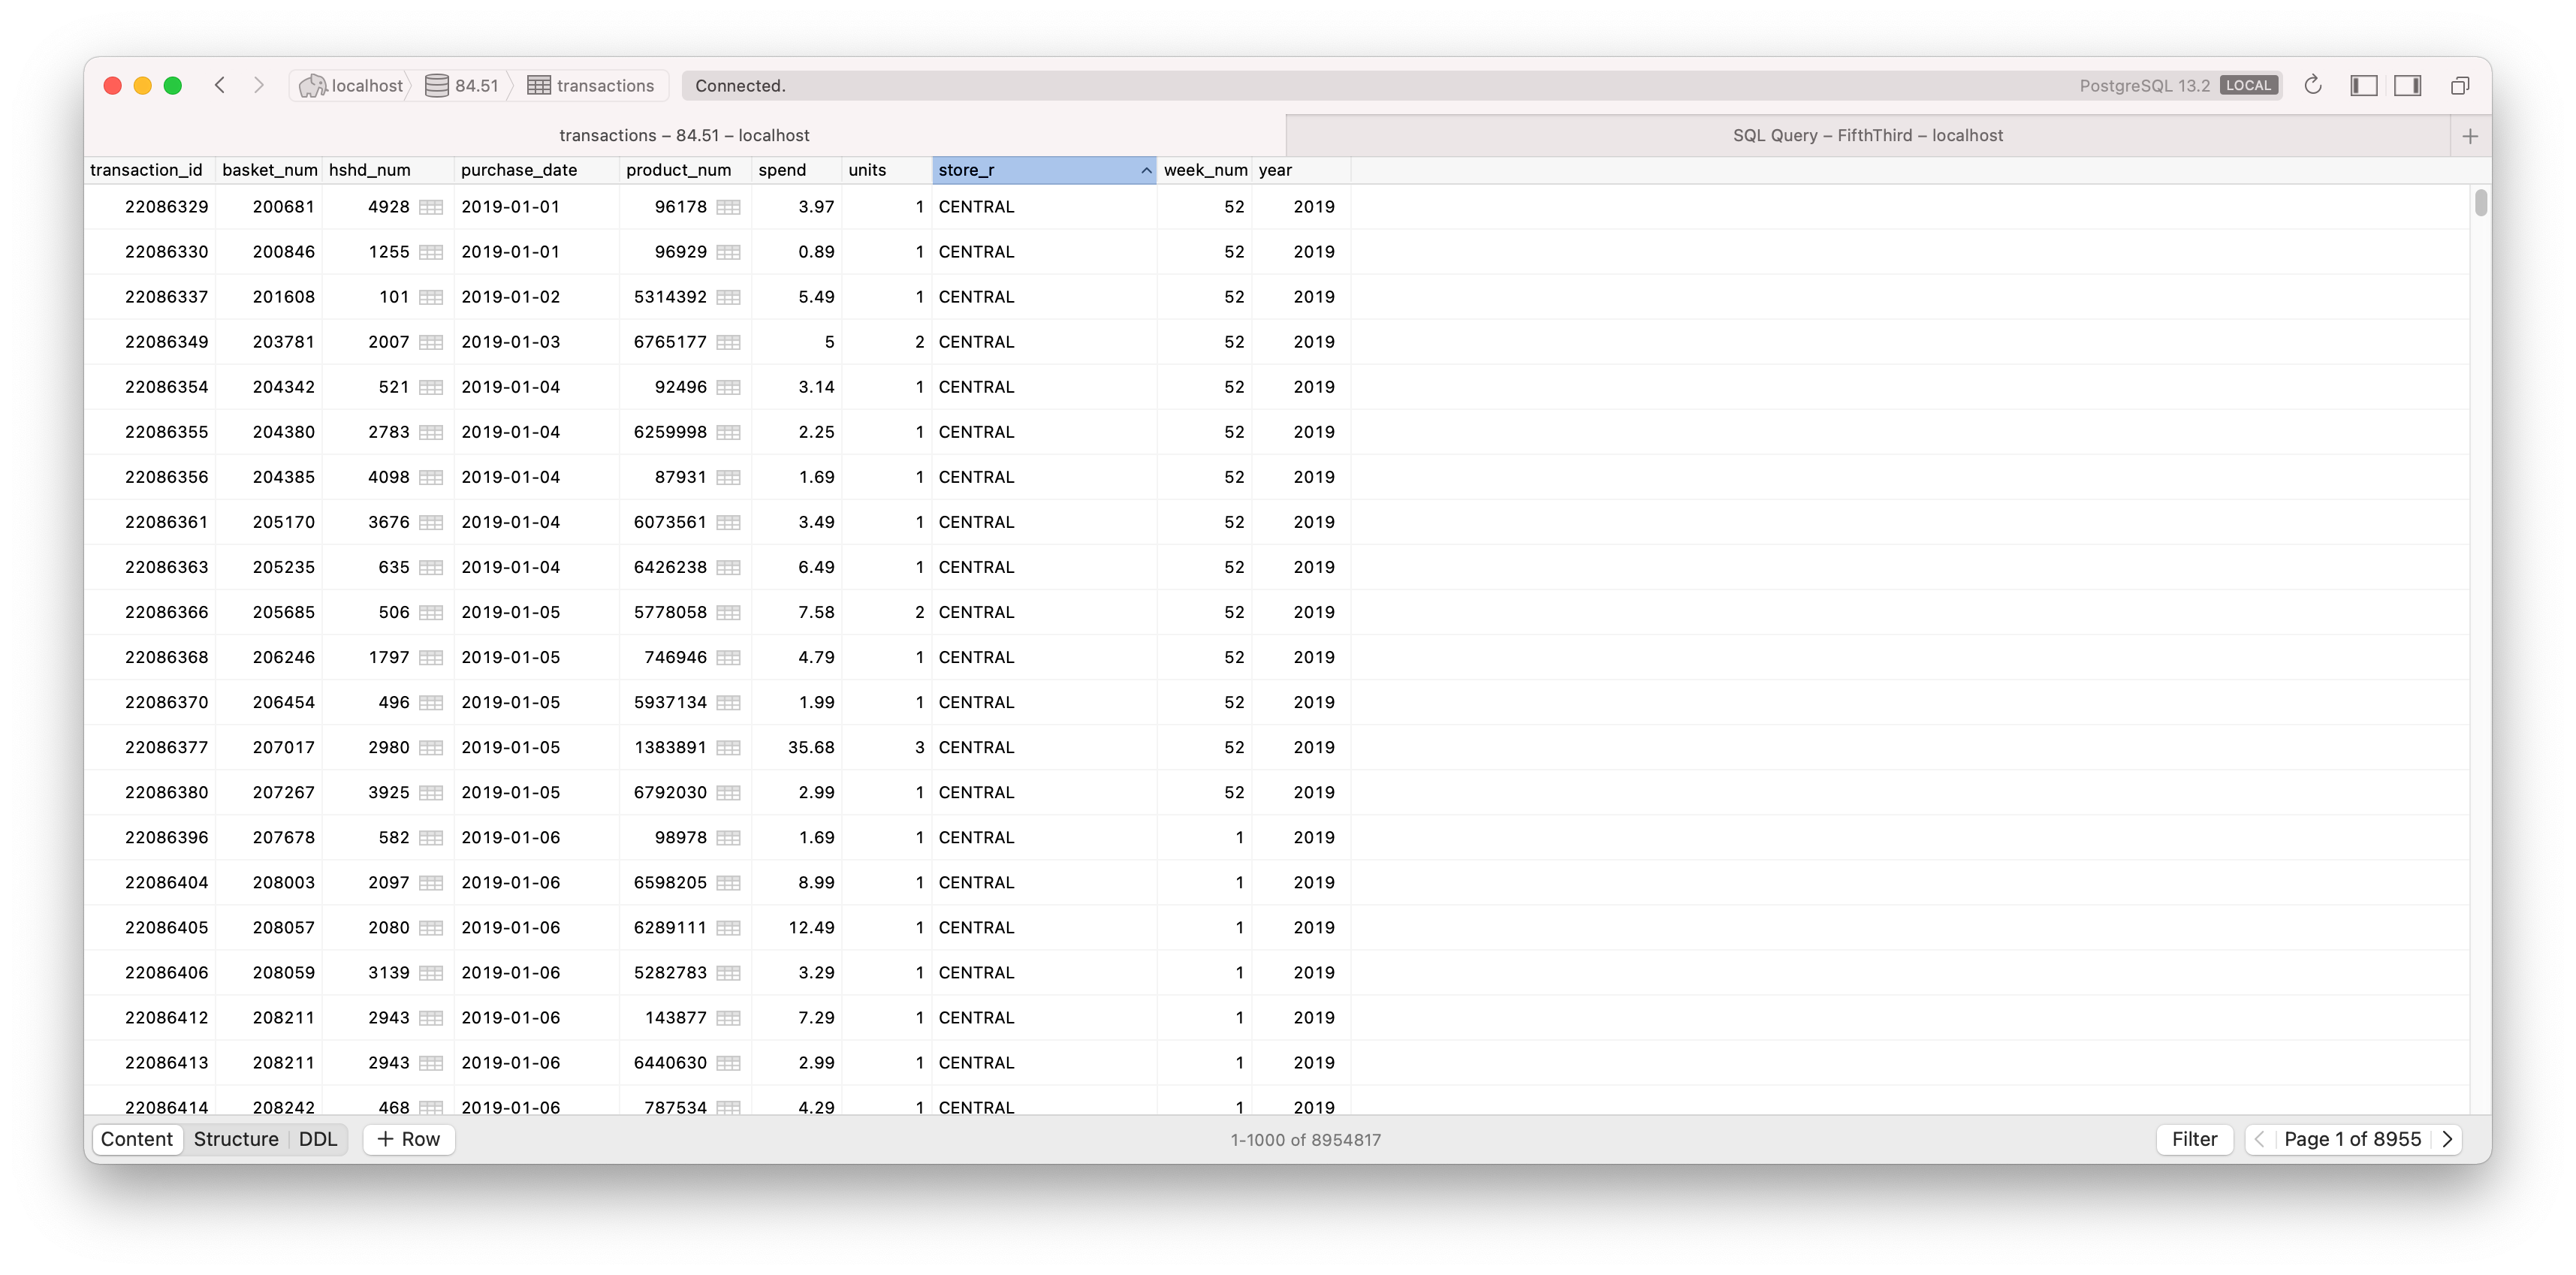
Consumer products bought at kroger
-

data base example
-


Inspiration
I find it very cumbersome to access relevant covid data from popular resources. Websites like the CDC website provide too much data. I think most of us want to see a few data points. How many new cases are there, how many vaccinations, and what the trend is currently, and how does it affect me economically.
What it does do
This dashboard displays covid data, vaccinations, and economic insights. Provides visual data and can provide information on each state.
How we built it
This is a full-stack project built using React.js, Node.js, and PostgreSQL. My API connects to Covid's Project API database that provides daily updates in JSON. Unfortunately, this API does not provide vaccination data. I had to create my own API for vaccination data to populate the dashboard with. I also created a database with sample data provided by 84.51 and 5/3 banking to get economic insights into how covid has affected the economy. I used express.js to construct the server. The front end queries the server for information such as aggregate sales in a particular category, etc.
Challenges we ran into
I learned how important it is to clean data. Some of the csv's had trailing spaces which made it very difficult to identify why the queries were not working. I ran into massive time constraints for this project and had to resort to very bad coding practices and file structures.
Accomplishments that we're proud of
Built a full-stack web application in one day that also provides data analytics into consumer data provided by 5/3 banking and 84.51. In just one day, I had to track down an API that is both accurate and up to date. I had to track down vaccine data in a CSV format and create a PostgreSQL database to perform queries on. I created an API, complete with endpoints, to link all the data together and provide a service to my front-end react dashboard. The project is version controlled and the source code can be found on GitHub in the link provided before.
What we learned
I learned how to set up a RESTful API in node.js by scratch using express.js. I learned that it takes 90% of the time to figure out 10% of the problems. I discovered the importance of reading documentation, searching google, and asking mentors for advice. The product can be messy, the product can be badly designed, but put the product out. Iterate and iterate and iterate.
What's next for The Covid Dashboard
Currently, I'm an intern for GE Aviation. I'm interested in how the increase in vaccinations will affect the confidence of people in air travel. I would like to scrape TSA data using beautifulsoup to track the daily difference in flights between today and 2019. I'm also taking a machine learning class this semester. I would like to incorporate more advanced machine learning algorithms in my analytics. I'd also like to have more detailed insights, like how the data changes based on zip code. I' would also like users to choose what analytic conditions they would like to choose. The app will then predict expected future outcomes as well.


Log in or sign up for Devpost to join the conversation.