-
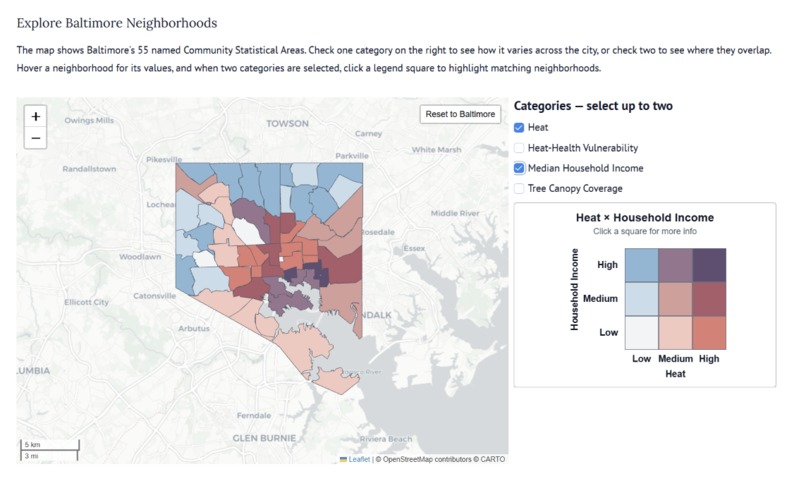
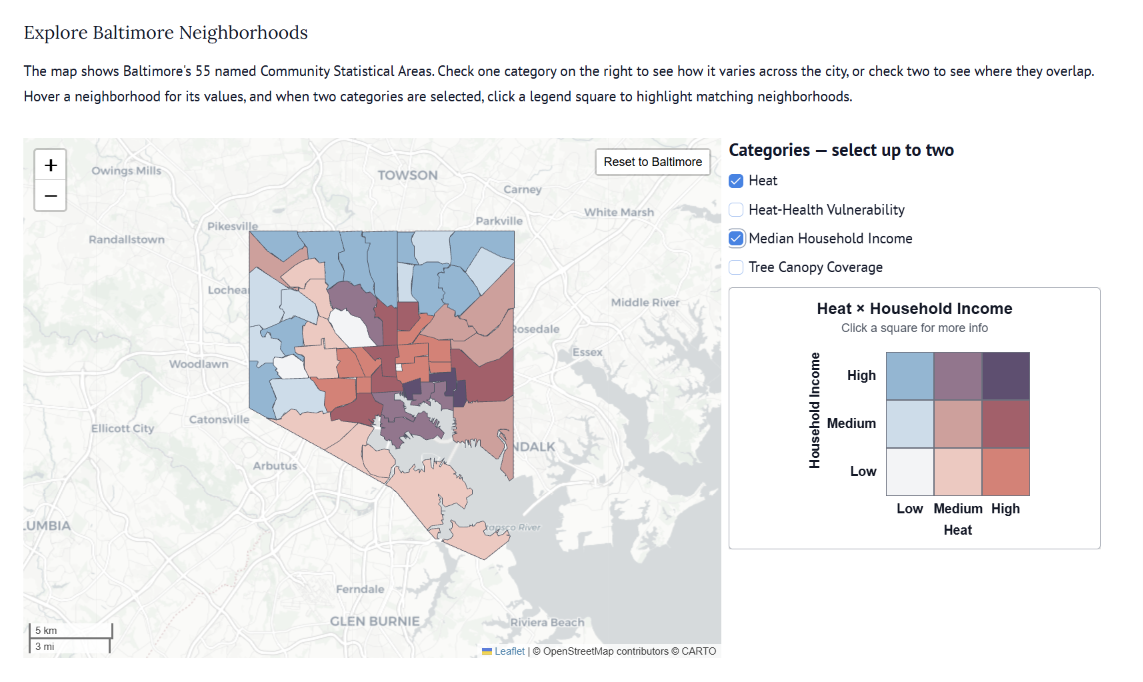
Bivariete Choropleth Map: Heat and Household Income
-
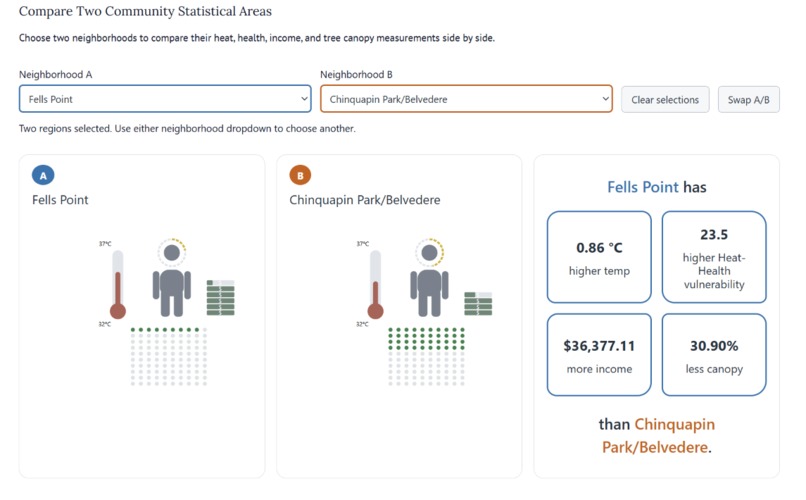
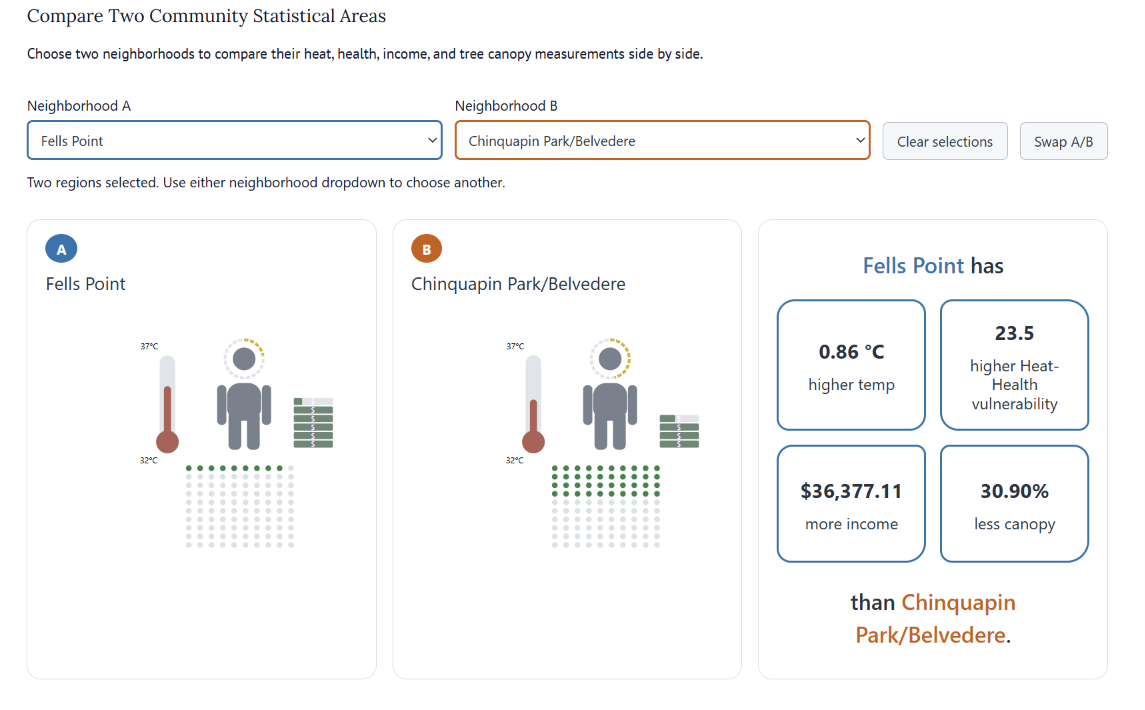
Comparison Between 2 Baltimore Neighborhoods
-
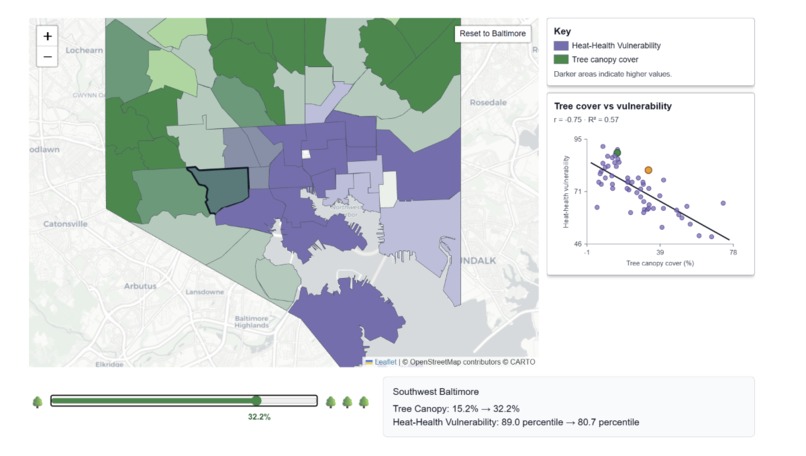
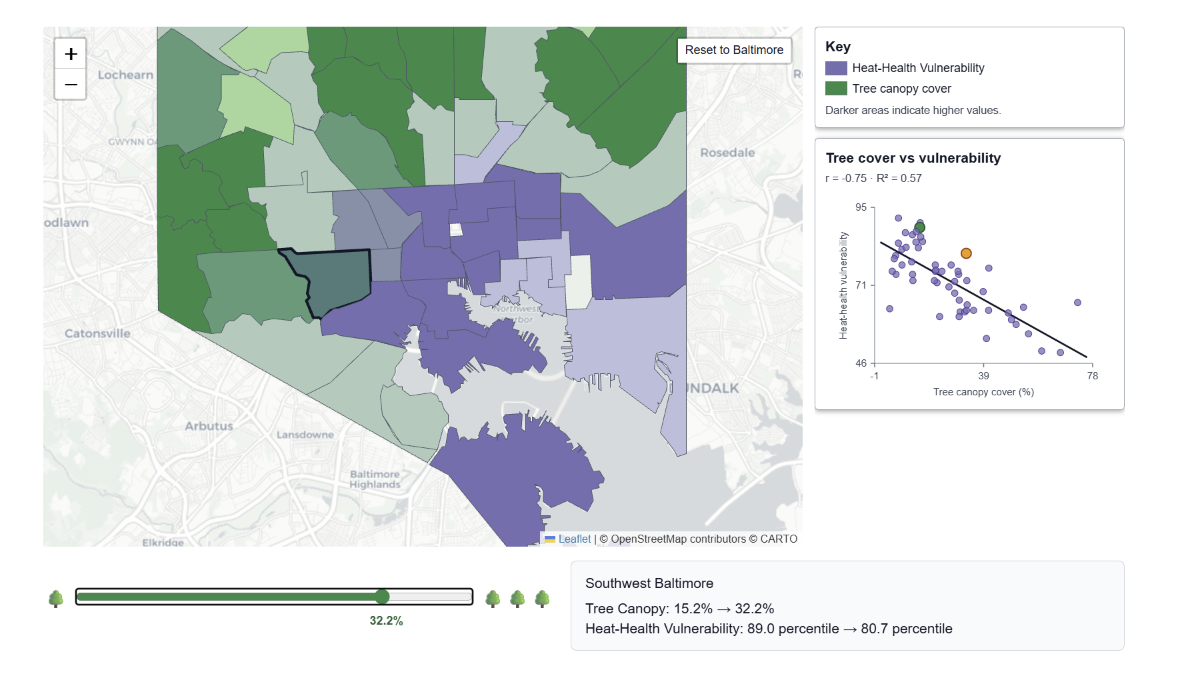
Predicted change in heat-health vulnternability
-
Donate to the city!
Inspiration
We read the 2019 Code Red series about how heat hits Baltimore unevenly, and we wanted to see whether the city's open data showed the same pattern. We also wanted people to be able to explore it themselves instead of just reading about it.
What it does
It's an interactive notebook that maps Baltimore's neighborhoods (CSAs) by tree cover, afternoon temperature, household income, and a heat-related illness ranking. You can look at one layer or pick two to see where they overlap. A what-if slider lets you add trees to a neighborhood and see how heat-health vulnerability might change.
How we built it
We used Python and marimo, with geopandas for the maps. Boundaries, tree cover, and income come from Baltimore's open data portal, temperature comes from OSF, and the illness ranking comes from ATSDR. We worked in a shared GitHub repo, planned the project with Claude, and used Grok in Cursor for a lot of the map and slider code.
Challenges we ran into
Setting up VS Code took us a while, and combining our pieces into one notebook caused a lot of conflicts. The AI-written code also needed fixing more than once, and we redesigned the map legends because the first ones were hard to read.
Accomplishments that we're proud of
We got one map that works for a single variable or a two-variable comparison, plus a slider that changes the map as you move it. We're also proud that it reads like a story and not just a pile of charts.
What we learned
marimo's reactivity is really nice: you move a slider and everything updates, with no extra code. We also learned how easy it is to overstate what a map shows. Correlation isn't causation, and a percentile rank isn't a count of sick people. And AI is fast at first drafts, but we had to check everything against our real data.
What's next for us
We'd like neighborhood-level illness counts from the city or state health department and a better model that accounts for income, pavement, and housing age. We'd also like to make the what-if tool more realistic by adding where trees can actually be planted, what it costs, and how long they take to grow.
https://molab.marimo.io/github/t1ffnyw/hophacks/blob/main/maps.py/wasm


Log in or sign up for Devpost to join the conversation.