-
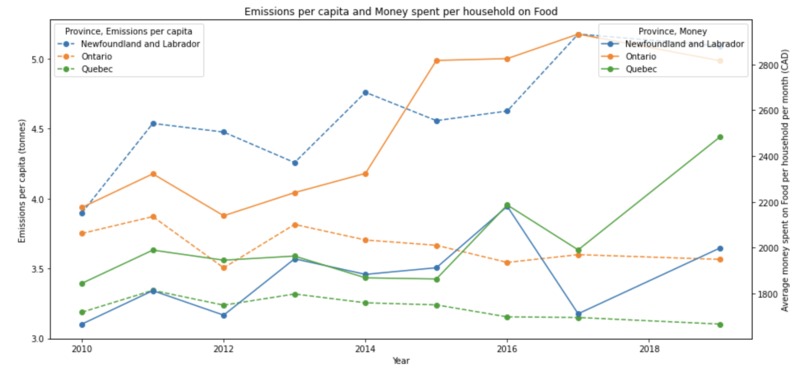
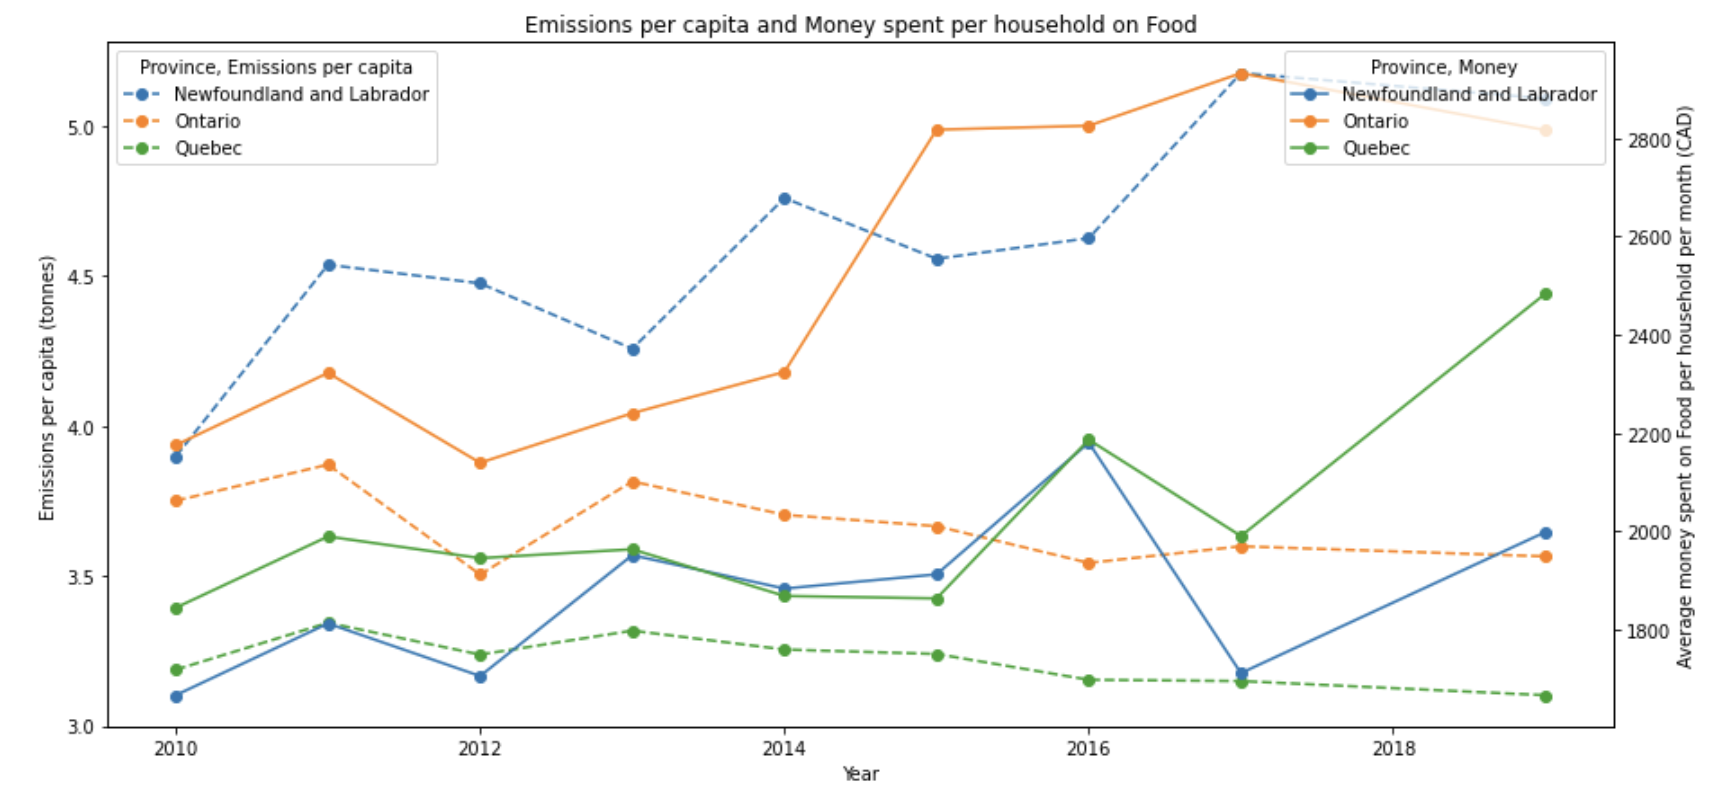
Emissions per capita alongside average household food spending per year for three provinces
The Cost of Eco-Consciousness
Our Inspiration We were inspired to analyze carbon emissions by the amount spent on restaurant food per household in different provinces of Canada. We hypothesized that our efforts to mitigate our carbon footprint could have been undermined by the excessive and wasteful recreational eating practices, especially by those privileged with a sizable disposable income. We predicted that there would be a clear positive correlation between the consumption of restaurant food and CO2. However, we were not ready to discover the other factors involved in our very unexpected results.
STORY
As seen in the data, carbon emissions per capita are actually decreasing relative to the amount spent on food per household. This negative correlation was surprising, as it subverted our expectations. It actually attests to many other societal factors that may have increased restaurant spending all while decreasing its impact on CO2 emissions, such as different attitudes that have made people more conscious of their eating habits’ impact on the environment. For instance, interest in veganism and vegetarianism piqued in the mid-2010s; this can be seen in our data, as there is a sudden increase in food spending all while greenhouse gas emissions decrease. Eco-Consciousness in one’s spending habits means buying food from sources that harm the environment less, which unfortunately increases the cost of food. Although rising food prices can be partially attributed to inflation, steep rises in restaurant food spending after 2014 in our table seem to suggest that other factors such as environmental awareness have a greater impact on each Canadian household’s spending habits. Ultimately, climate change awareness campaigns seem to be working somewhat, as citizens of Canada have been spending more on food in order to protect the environment, and this can be seen in an overall decrease in emissions per capita.
What are your data sources?
[Census families by total income, family type, and number of children] [hhttps://www150.statcan.gc.ca/t1/tbl1/en/tv.action?pid=1110001301]
[Annual greenhouse gas emissions (industries and households) by province] [https://www150.statcan.gc.ca/t1/tbl1/en/tv.action?pid=3810009701&cubeTimeFrame.startYear=2015&cubeTimeFrame.endYear=2020&referencePeriods=20150101%2C20200101]
What did you do with the data?
First, we compiled data for food expenditures per household and for greenhouse gas from 2010 to 2019. Then isolated and matched variables to get data that contained “total purchased” only. Since the range of years were originally defined as columns, we had to swap them to rows so that they can be on the x-axis. This data manipulation allowed
Merged the data for average money spent by industries and household and emissions per capita to create a
WHAT WE LEARNED: We learned how to work with pandas and matplotlib. We also learned how to clean data from our datasets and analyze our data better to find meaningful correlations. Certain techniques, such as pivoting and melting tables with pandas, helped raw data from Statistics Canada to better suit our analysis.
Graphical user interface, application
Description automatically generated
Add your visuals
Add link to Colab notebook https://colab.research.google.com/drive/135IVRiEa9jbG_2-08KZ__IfnbXLmNPXO?usp=sharing#scrollTo=h7sWu-_ZKWOb
Add any other link: e.g., presentation slides, github repo. https://docs.google.com/presentation/d/1LyzeFi-nsm22OHugz441b2ZJfc80bOnKKYLmYrtQ_Hw/edit?usp=sharing


Log in or sign up for Devpost to join the conversation.