Inspiration
The pandemic and disease in general has always been a great deterrent to societal growth. From the 2019-2023 period, most forms of travel, whether local, interstate, or long distance, were completely shut down or heavily limited. Businesses suffered with lack of customers, and people suffered with lack of face to face social interaction. During times of outbreak, quarantine is crucial to stopping the spread of disease as fast as possible. With this data, we hope to see which diseases cause an observable shift in trip frequency, and how businesses, health officials, and even you, can prepare and mitigate the social or economic losses as best as possible.
What it does
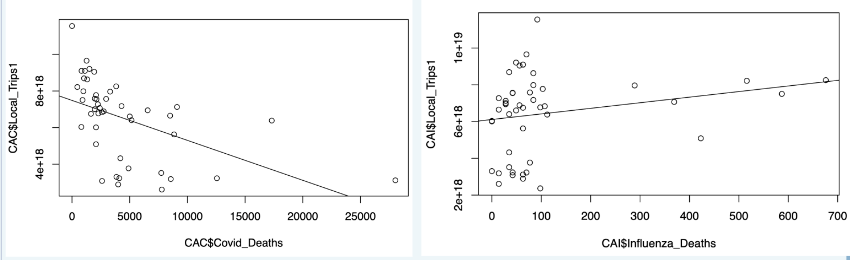
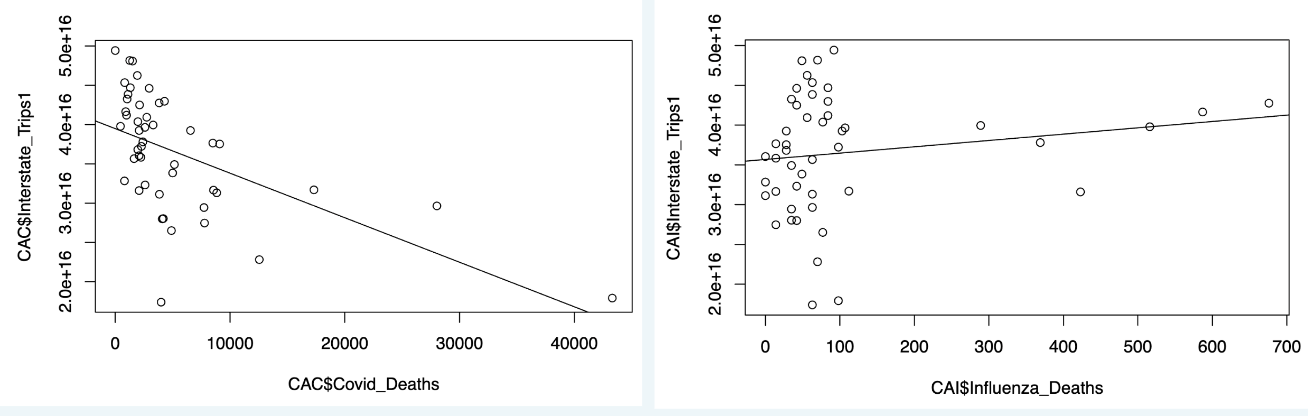
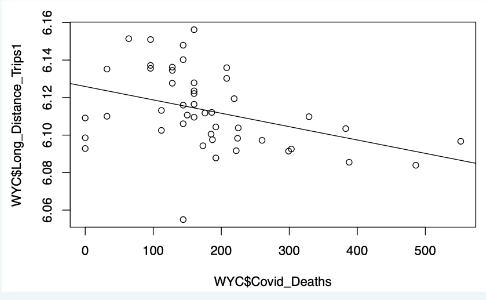
Our project analyzes data from the CDC disease statistics from 2019-2023 alongside data from the US Dep of Transportation on Trips by Distance. We sorted Trip Distance into 3 categories based on length (Local, Interstate, and Long Distance), and compared it to disease deaths in monthly intervals explore a correlation,
How we built it
- We used SQL to clean and sort our data, picking a select few states to compare and analyze based on their region in the US. Our 3 categories for Trip Distance were created based on the length of the trip, so we merged trip lengths from 0-25 for Local, 25-100 for Interstate, and 100-500+ for Long Distance trips.
- We used R to create visualizations of each statistic, comparing each disease with the relative impact it had on trip frequency.
- We ran linear regressions using R to explore the correlation between each disease and trip frequency in each state.
Challenges we ran into
- Learning SQL and merging Data
- Had a hard time determining the scope of our data, which caused us to reset our project. ## Accomplishments that we're proud of
- We were able to finish the project on time despite numerous resets.
- We were able to use SQL well for our first time.
- We were able to work well as a team to accomplish a goal by collaborating on tasks using individual skill sets.
What we learned
- Always have a laid out and solid plan. Consider what question you want to answer and how you will do it.
- Research and look at databases that are similar but don't completely match what you are looking for. Sometimes they may be a better fit or may work with your idea better.
- SQL and R
What's next?
- We want to look at how potential vaccination rates or other health policies can also affect or shorten the spread of disease.
- We want to explore a wider range of diseases with different modes of transmission and how they affect urban, suburban, and rural areas.

Log in or sign up for Devpost to join the conversation.