-
-
Cover page
Inspiration
What it does*Live:* https://controlroom-production-f82a.up.railway.app
Proof of the track requirement, in two links a judge can open right now:
- https://controlroom-production-f82a.up.railway.app/healthz returns
{"status":"ok","events_loaded":1000000,"transport":"mcp"} - https://controlroom-production-f82a.up.railway.app/api/mode names the live transport and model
Inspiration
During a live event, a quality alert says exactly one thing: rebuffering is up. It does not say which CDN, which region, which device class, or which of the four things that changed in the last hour caused it. On-call engineers pivot through dashboards for 20 to 40 minutes while viewers leave. For a 2-million-concurrent broadcast, every one of those minutes is measurable churn and forgone ad revenue.
The frustrating part is that the answer already exists. Billions of player heartbeats are sitting in a database. Nobody can query them fast enough under pressure.
What it does
The Control Room runs six agents in a fixed order, every time:
- Watcher - a z-score sweep over a per-minute rollup, then the same sweep per slice against each slice's own baseline. Incident, or normal variance?
- Diagnostician - explanatory-power attribution across six dimensions, then a drill into individual sessions inside the culprit slice.
- Eyewitness - Gemini looks at actual frames from the affected renditions, alongside the error-code profile for the whole slice. A clean picture with stalls means delivery. Macroblocking means encoder. A clean picture contained inside one player build means client. This is what decides who gets paged.
- Impact - sessions hit, abandons, watch-time lost, revenue at risk.
- Action - remediation an engineer can execute in two minutes, plus the viewer-facing post.
- Continuity - re-measures the culprit slice. An incident closes because the numbers came back, not because an agent wrote a plan.
Every step, including the exact SQL executed and the rows it scanned, is written back to ClickHouse, so any run replays by run_id.
How we built it
ClickHouse, via the official MCP server, on the critical path. Every read in the six-step pipeline is executed by mcp-clickhouse against ClickHouse Cloud. Not attached for chat, not named in a README - it is the transport the product runs on. controlroom/mcp_client.py holds the stdio session; controlroom/ch.py routes every run_template call through it.
Gemini decides what the evidence means. It never decides which evidence to collect. Every query the pipeline runs ships in the repo under sql/queries/. Which query runs, over which window, for which dimension, is fixed by pipeline.py before any model is asked anything. Re-run a run_id against the same window and you get the same queries and the same culprit.
Those two facts are the whole design and they are not in tension. The MCP server is the transport; sql/queries/ is the decision. A model is handed rows it did not select, while the thing actually talking to ClickHouse is ClickHouse's own integration.
Where a model output does reach SQL, it is contained. The culprit dimension comes back from Gemini and is about to be substituted into a statement, so it is checked against a six-value whitelist and every literal is escaped before anything reaches the server (ch.bind_params). A hallucinated dimension raises an error; it does not rewrite a query.
Two connections, each doing the half it can. Reads go through the MCP server. Writes - schema, the run log, the incident record - go over clickhouse-connect, because the MCP server is read-only by design.
The same MCP session is also exposed to a Google ADK agent for open-ended follow-up ("was BLR1 affected too?"), where a wrong query costs nothing and the pipeline's verdict is already recorded.
Stack: Gemini 2.5 Pro and Flash via google-genai, Google ADK, ClickHouse Cloud via mcp-clickhouse, FastAPI with server-sent events, Docker.
Data sources
Simulated player telemetry generated by data/generate_events.py - playback_events rows modelling a live broadcast across six dimensions (CDN, region, device type, ISP, player version, rendition), with a fault planted in one slice per scenario and a chronic-but-innocent confounder cohort planted alongside it. Schema in sql/01_schema.sql.
Six fault archetypes ship as ground truth: shield_eviction, isp_peering, encoder_corruption, packager_manifest, player_regression, regional_pop.
Accomplishments we're proud of
We measured it instead of claiming it. evals/run_eval.py scores the system against ground truth over 66 datasets:
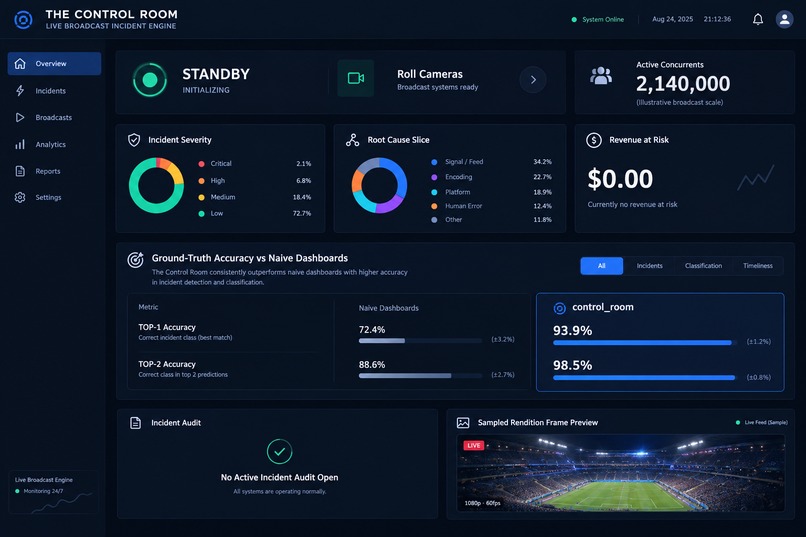
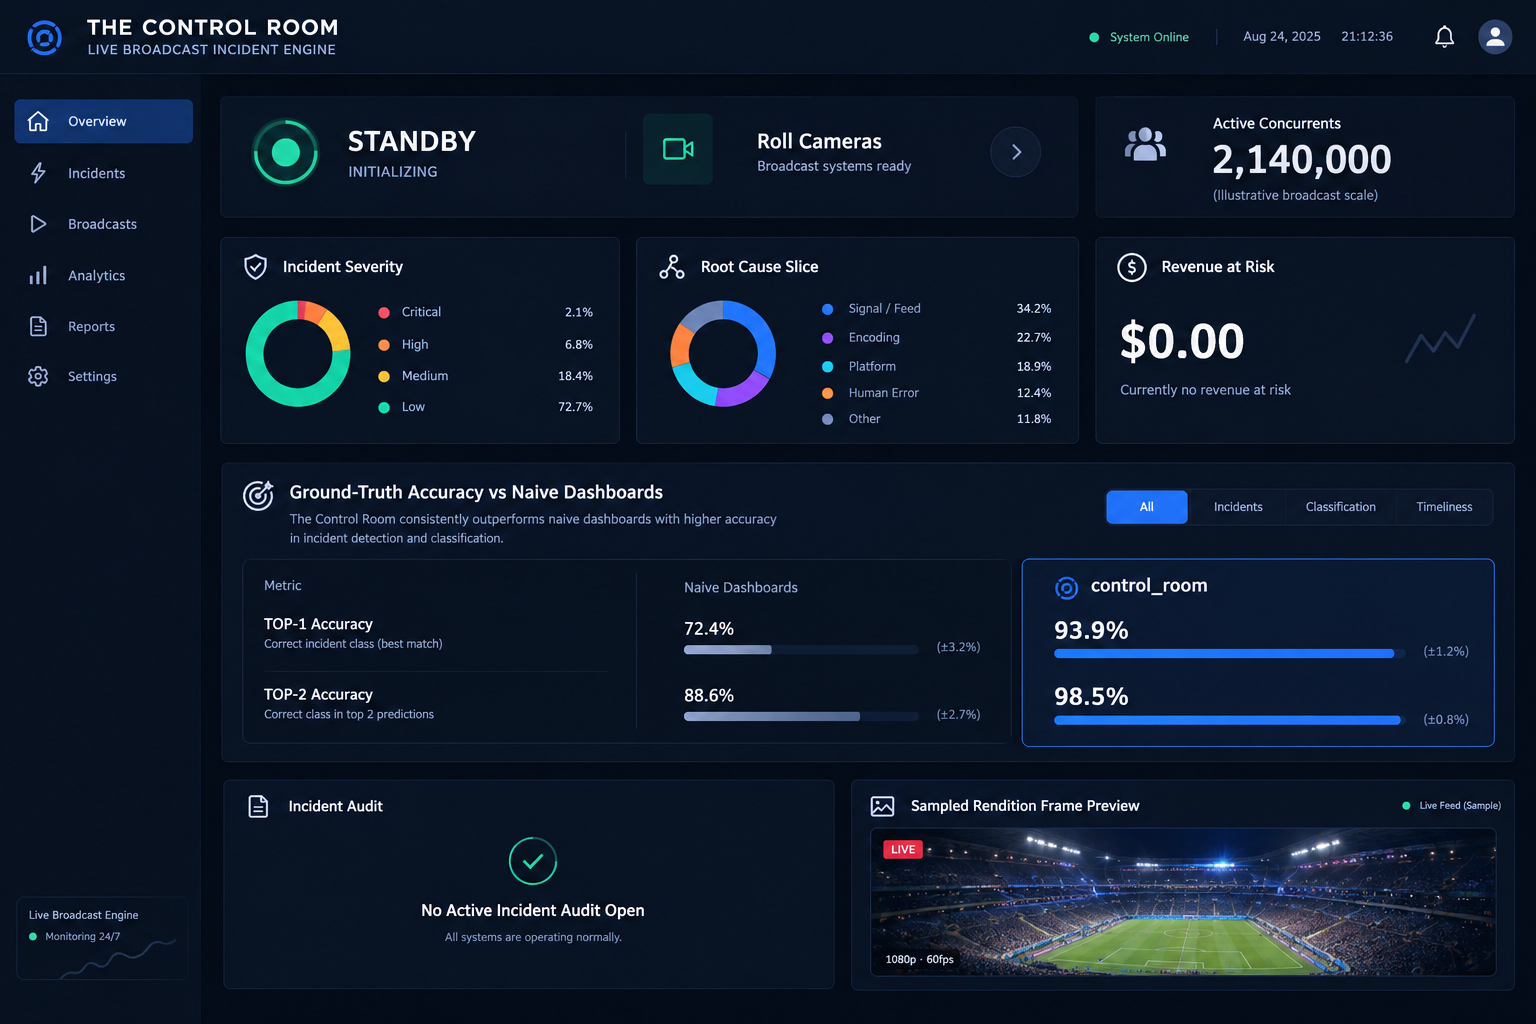
- 93.9% top-1, 98.5% top-2 attribution accuracy.
- 93.8% on the 48 held-out seeds the tiebreak weight was never fitted on. The fitted-versus-held-out gap is 0.6 points, and both columns are printed.
- Detection scored separately from attribution, because step one is a gate: 17/18.
- A fault-severity curve down to the noise floor, so the headline number has context.
The baselines fail the way real dashboards fail. Three naive QoE panels score 0.0%, 0.0% and 37.9% on the same data. Two of the three blame the chronic-but-innocent BSNL cohort on all 66 runs - exactly the mistake an on-call engineer makes at 2am with a severity-sorted table.
Challenges we ran into
The blind spot was in our own step one. The Watcher originally swept only the all-up average, which is what a global QoE panel does - and on encoder_corruption the all-up average sits inside normal variance while one rendition runs three sigma above its own baseline. The fix was to repeat the sweep per slice against each slice's own history. We found it by measuring, not by reading the code.
Separating the MCP transport from query selection also took a rewrite. The obvious build lets the model choose queries through MCP tools, which is fast to demo and impossible to trust on a live broadcast.
What we learned
Severity does not identify a root cause - containment does. Ranking slices by how much of the unforecast stall time they actually explain beats ranking them by how bad they look, and that single change is most of the gap between us and the baselines.
And an agent system is only as honest as its labels. Running with no credentials substitutes an embedded engine and rule-based stubs, and both substitutions are labelled in the header, in /api/mode, and in the model column of every logged step. Nothing pretends to be Gemini that isn't.
Known limitation, stated up front
regional_pop scores 8/11 top-1 and misses detection about one run in three, because region=DE-BE is the smallest slice any archetype plants a fault in. This is in the README too. We would rather a judge read it from us than find it themselves.
What's next
Streaming attribution during the incident rather than after the window closes; a feedback loop where a confirmed remediation adjusts the archetype priors; and real packager frames in place of the synthesised ones.
How we built it
Challenges we ran into
Accomplishments that we're proud of
What we learned
What's next for The Control Room
Built With
- chdb
- clickhouse
- clickhouse-cloud
- docker
- fastapi
- gemini
- google-adk
- google-cloud
- google-genai
- mcp
- mcp-clickhouse
- model-context-protocol
- python
- server-sent-events


Log in or sign up for Devpost to join the conversation.