-
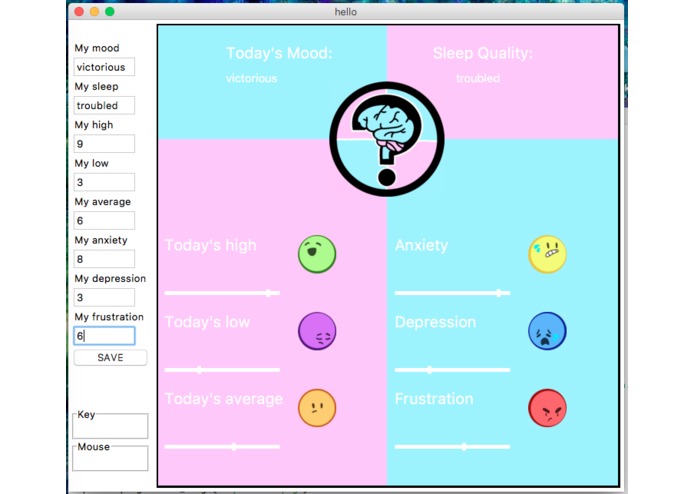
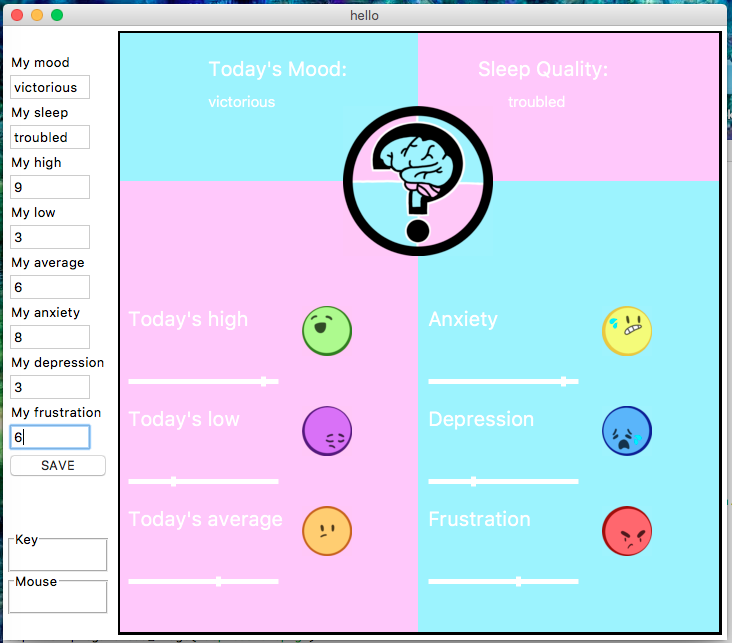
User Interface
-
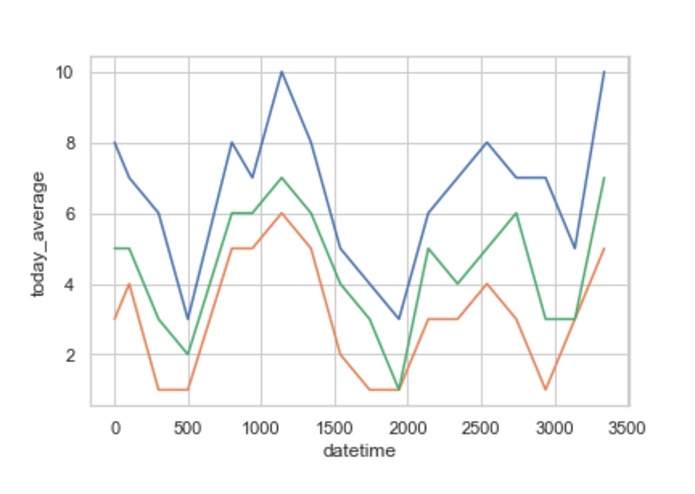
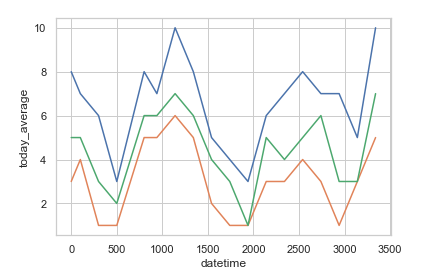
Mood Graph
-
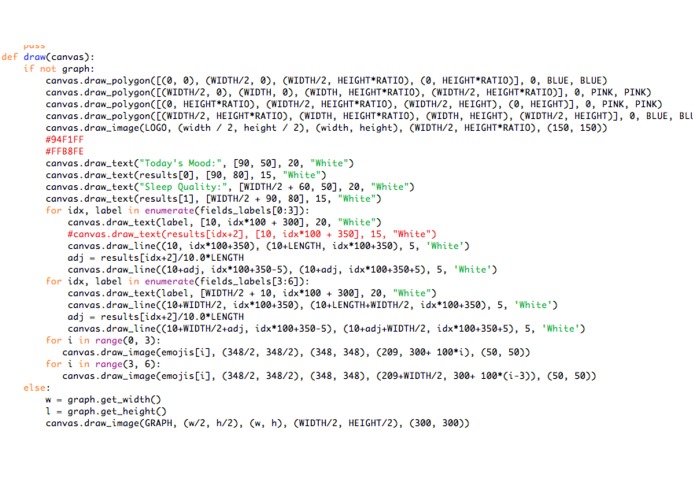
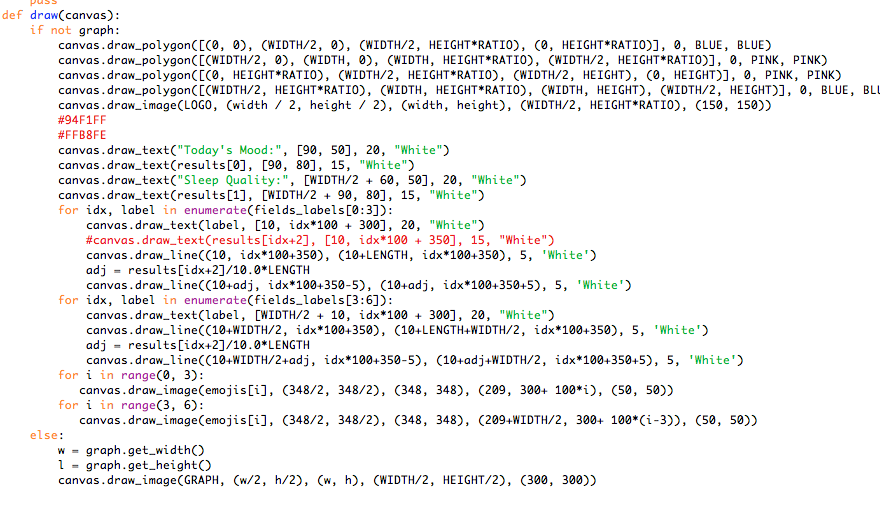
Snippet of Code
Inspiration
Generally, cognitive behavioral therapy can be something that can be difficult to keep track of personally, or at least is something that we tend to overlook in our day-to-day life. With this tool, the user will be able to not only log their current status (letting them be more cognizent of their own behaviors and moods), but also track trends over time, logging important dips and rises.
What it does
With our project, the user is brought to a screen in which they log their High, Mid, and Low moods for the day on a rank from 1 to 10, along with their depression, anxiety, and frustration levels daily (also on a scale of 1 to 10). This, in addition to a general mood sensor, is plugged into a generated graph, detailing trends and presents a visual representation of the mental state of the user over time.
How we built it
This project was built almost entirely in Python, with imagery generated in Clip Studio Paint and imported in as files.
Challenges we ran into
While the UI and visuals of our project is in good form, the actual generation of data and the graphs was quite tricky. Creating a project entirely in Python presents unique limitations, but for what we have been able to do with our time and program limitations we are quite proud of the outcome.
Accomplishments that we're proud of
Within our project, we have been able to record and track many points of data along a wide range of values, and presented the user interface to the subject in an easy to read, easy to understand format. For the amount of time we were given, we are quite proud indeed.
What we learned
This project has resulted in many new aspects of coding to all of us, as we have gone into this with not a huge amount of prior experience. In particular, using a process called Seaborn within Python has been a learning experience, necessary to produce the graphs from our inputted data.
What's next for The Cog(nitive) Log
For where we are, we are pretty happy with the current state of things. While it may not be quite what we planned, there is definite possibility for further development and growth of the project, as far as graphing goes


Log in or sign up for Devpost to join the conversation.