The Bridge — Project Story
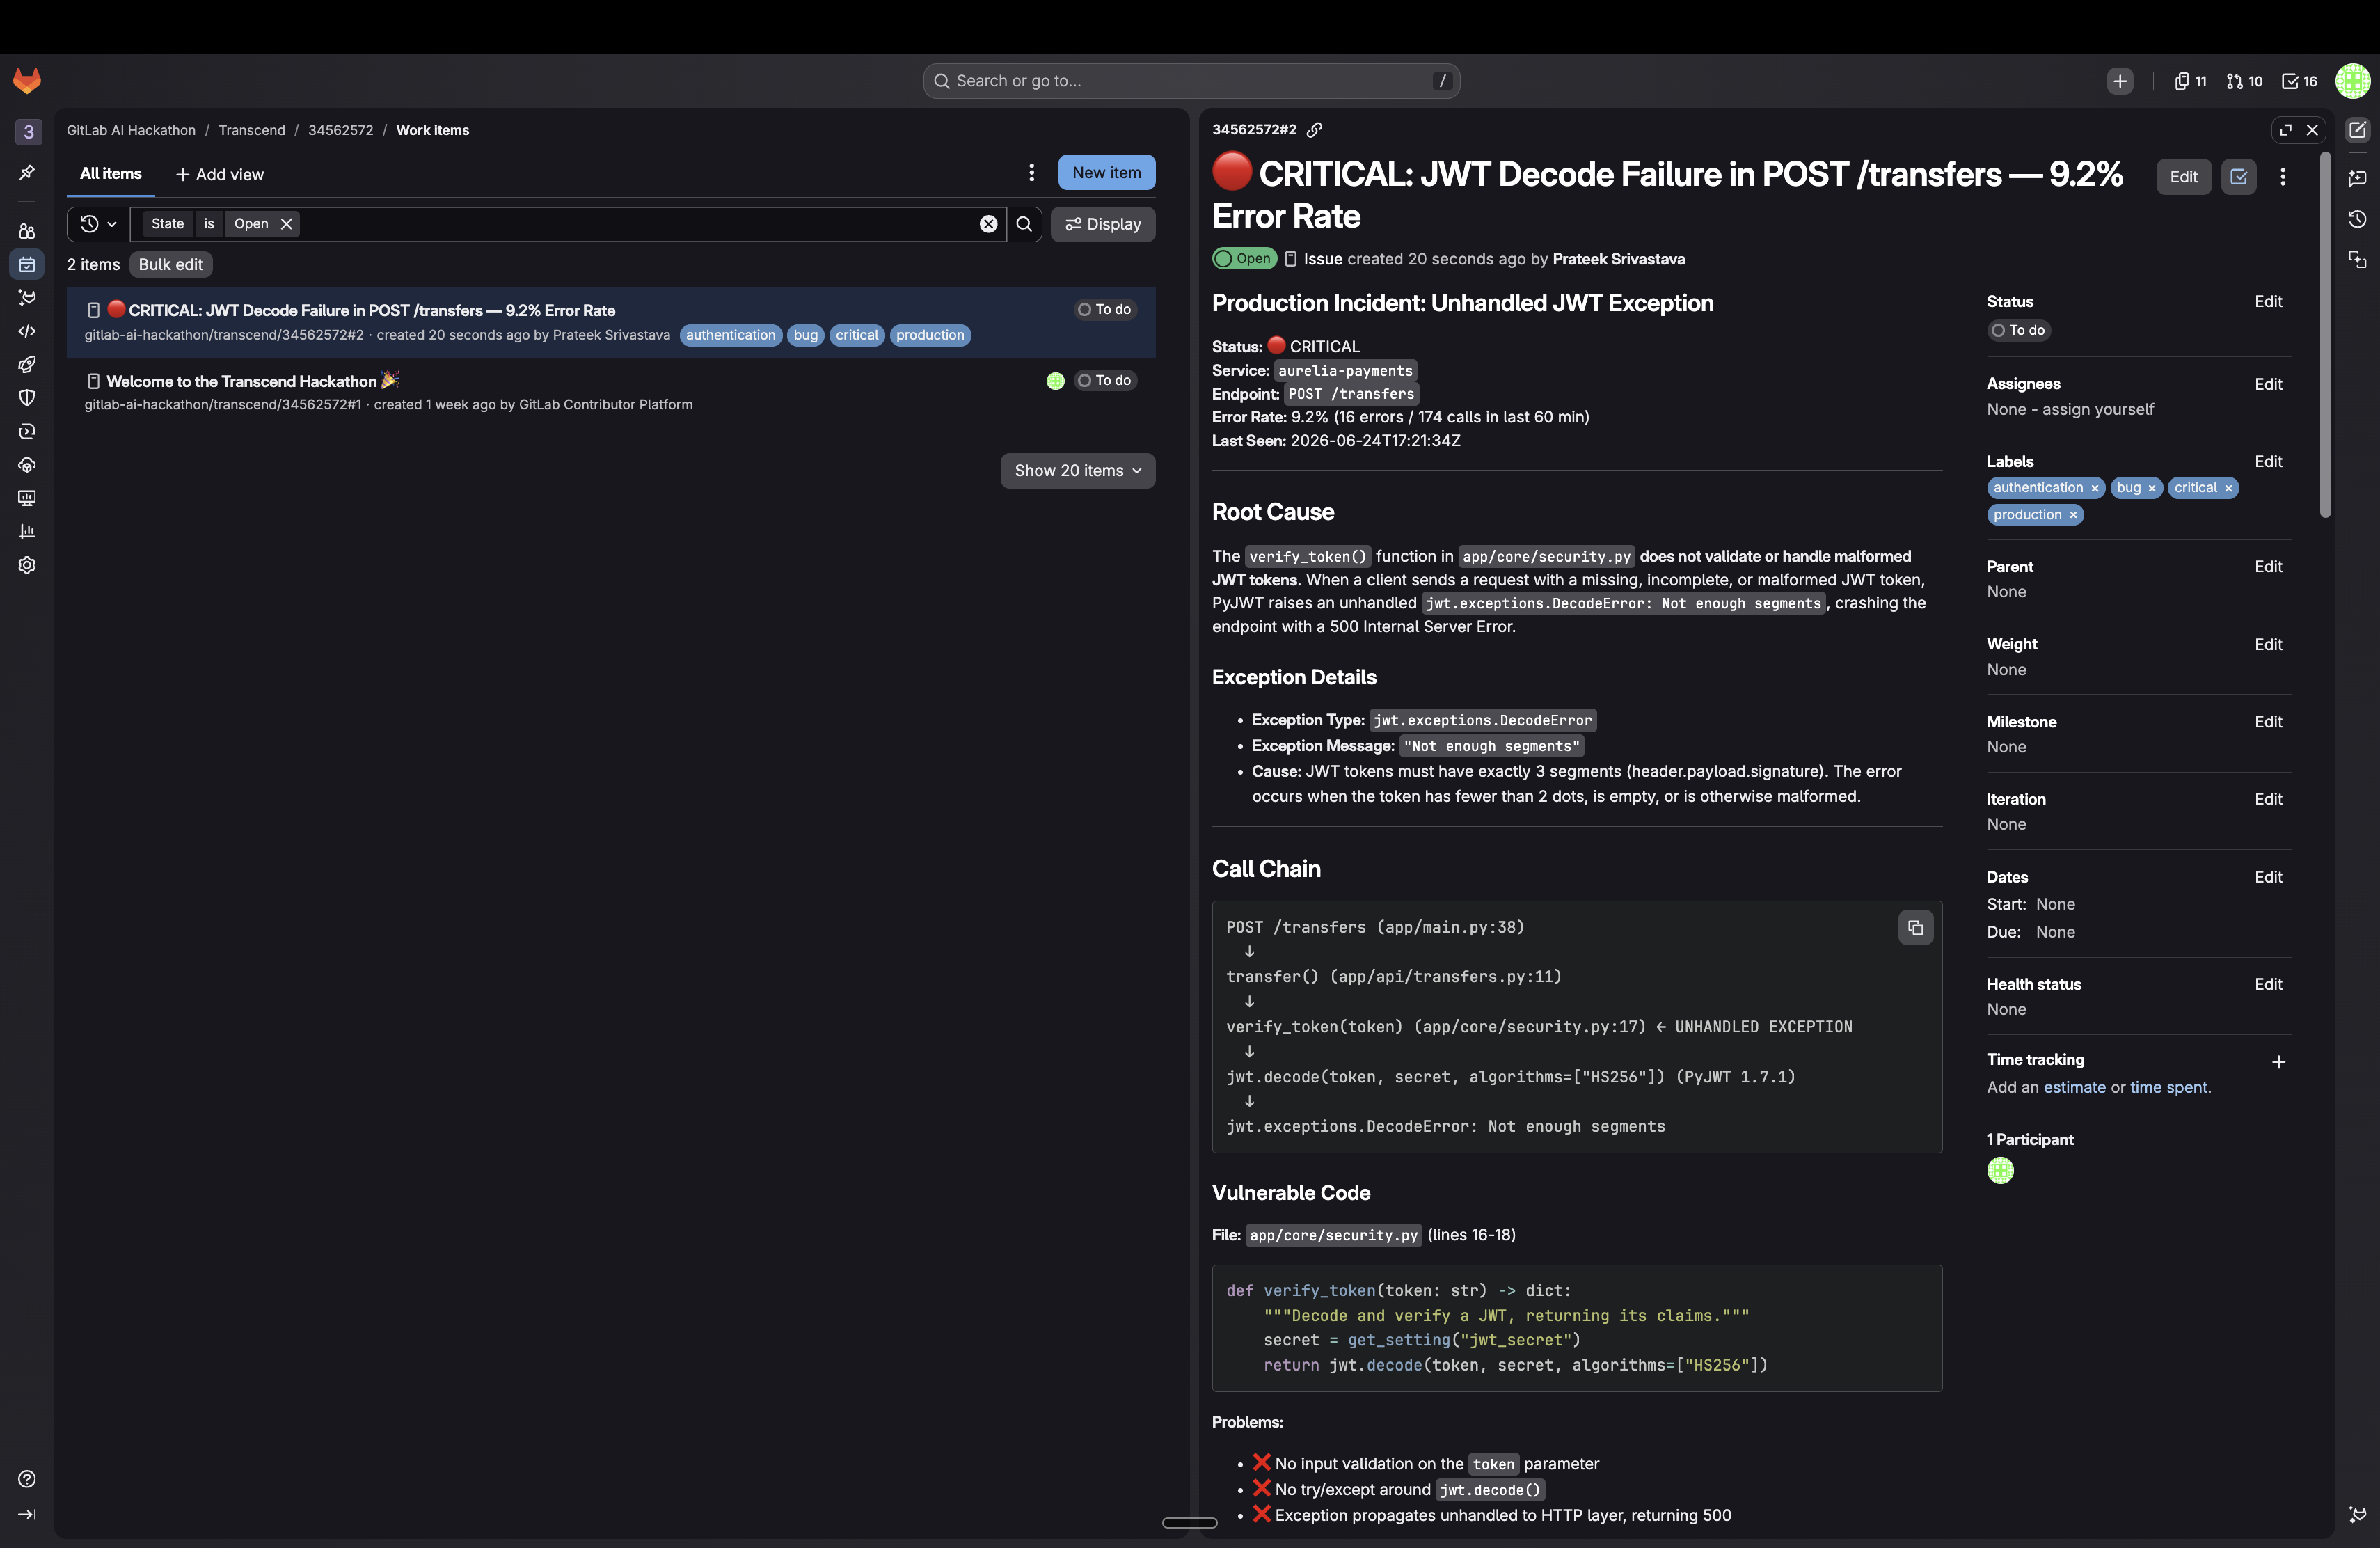
Tagline: From a 500 in production to the line of code that owns it. Your monitoring knows what is failing; it never tells you which code, why, or who. The Bridge reads the live error trace and walks it into the code graph — owning code, root-cause line, blast radius, finding, owner, and a fix — then opens a tracking issue, after a human approves.
Inspiration
Two tools sit ten feet apart and never talk.
Your observability backend knows a request is failing — service, operation, status, a trace id. Your code intelligence knows the import graph, the owners, the findings. Neither crosses over: o11y tools have no code graph, and code tools don't take traces.
So at 2 a.m. an on-call engineer reads a 500 in one tab —
POST /transfers · HTTP 500 · ×N · traceID 329a6c8c…
— and goes spelunking through the repo in another, by hand, to answer the only questions that matter: which code owns this? what else is about to break? who do I wake up? is there a known weakness on the same path? The trace tells you the symptom. Everything else is manual archaeology across two worlds that don't connect.
GitLab Orbit is the first code knowledge graph exposed over MCP — which makes this the first time you can wire runtime telemetry into the code graph programmatically. That's the bridge nobody had built. We built it.
What it does
Trigger it in the GitLab Duo Agent Platform: "Diagnose the failing operation in production." A fleet of three agents then turns a live 500 into a complete root cause — and, after a human approves, a filed issue. Two ⭐ specialists carry the join; the orchestrator runs verify, owner, finding-correlation, and the fix itself.
| Agent | What it's like | What it actually does |
|---|---|---|
| Live Trace Reader ⭐ | the pager | Calls a custom o11y-bridge MCP over GitLab Observability (SigNoz) → the distinct failing operations: service, POST /transfers, HTTP 500, count, sample trace id. The symptom only — names no source file |
| Code Join ⭐ | the bridge (the moat) | Walks the Orbit graph from the failing route to its owning module (transfers.py → security.py), the root-cause suspect (verify_token calls jwt.decode with no error handling), and the blast radius (every module importing the same auth code) — confirmed by reading the suspect line |
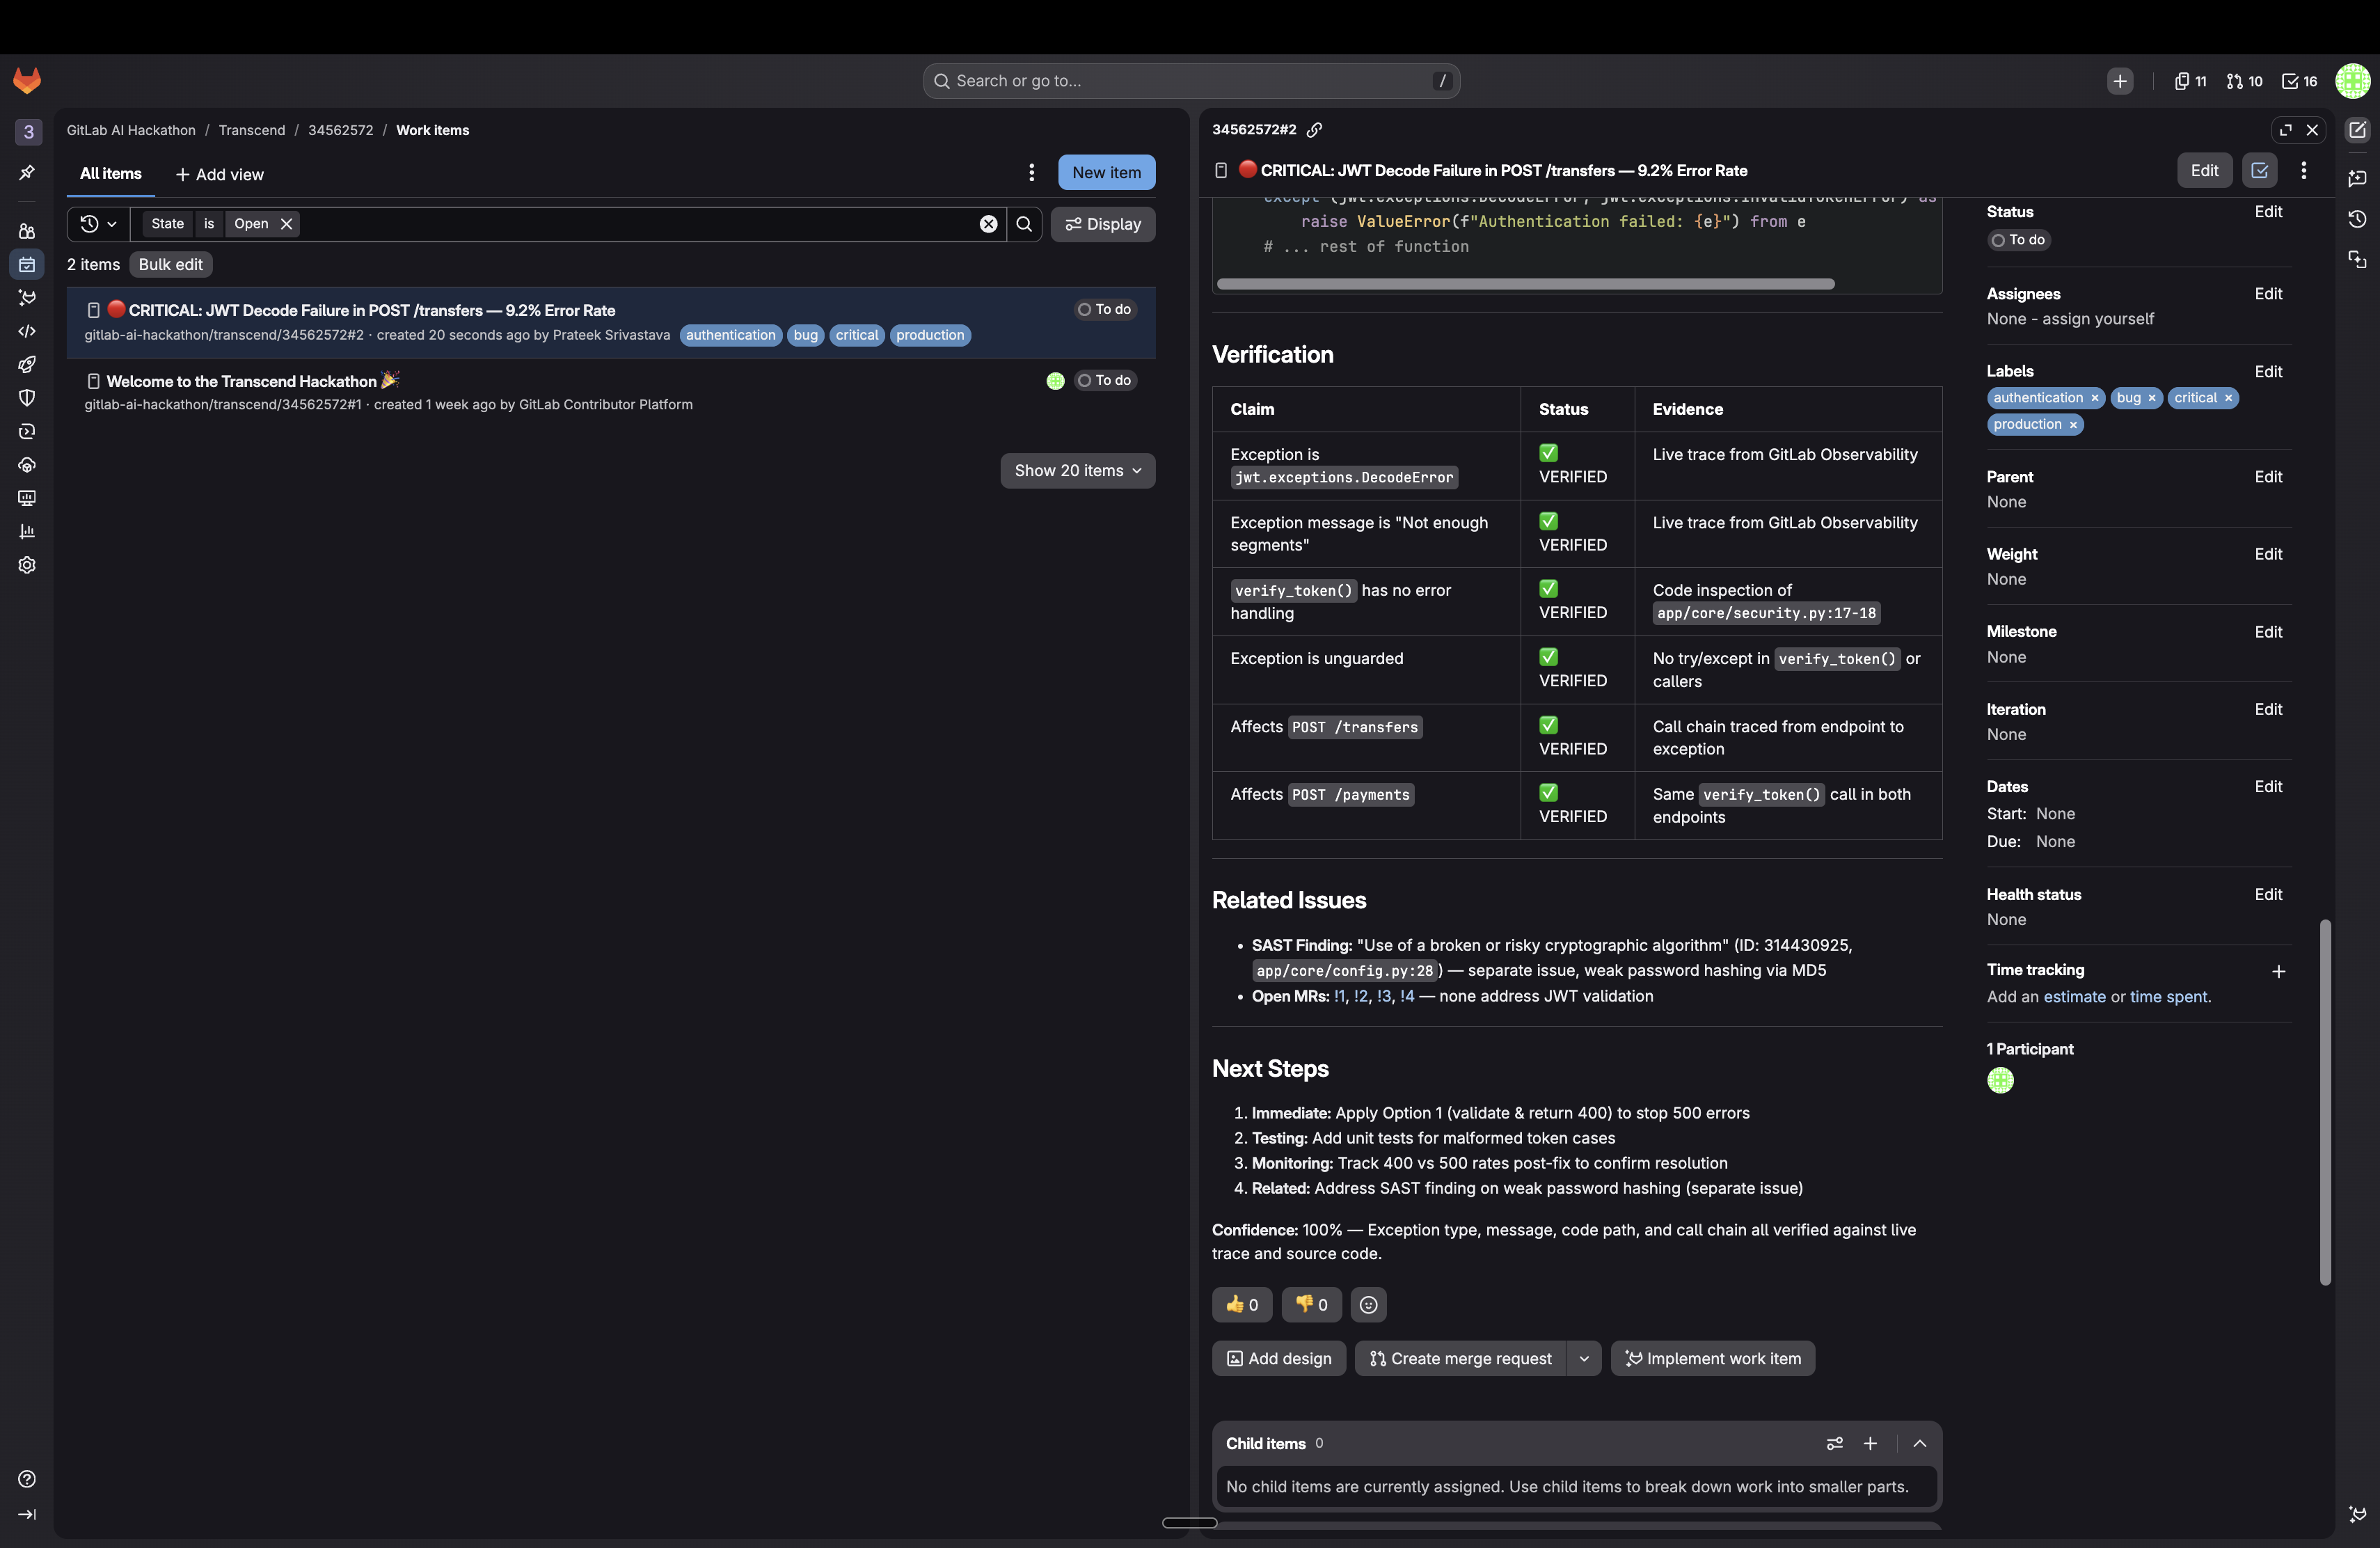
| The Bridge (orchestrator) | the incident commander | Runs the rest of the chain itself: adversarially re-verifies every claim (re-queries the graph, re-reads the code — VERIFIED / REJECTED / UNVERIFIED), correlates the live finding (CWE-327 on the path — related, separate), names the owner (User -AUTHORED-> MergeRequest), writes the fix (wrap the decode, return 401 not 500, rotate the secret), ties it into one verdict + confidence, and — only after a human approves — opens the issue via create_issue |
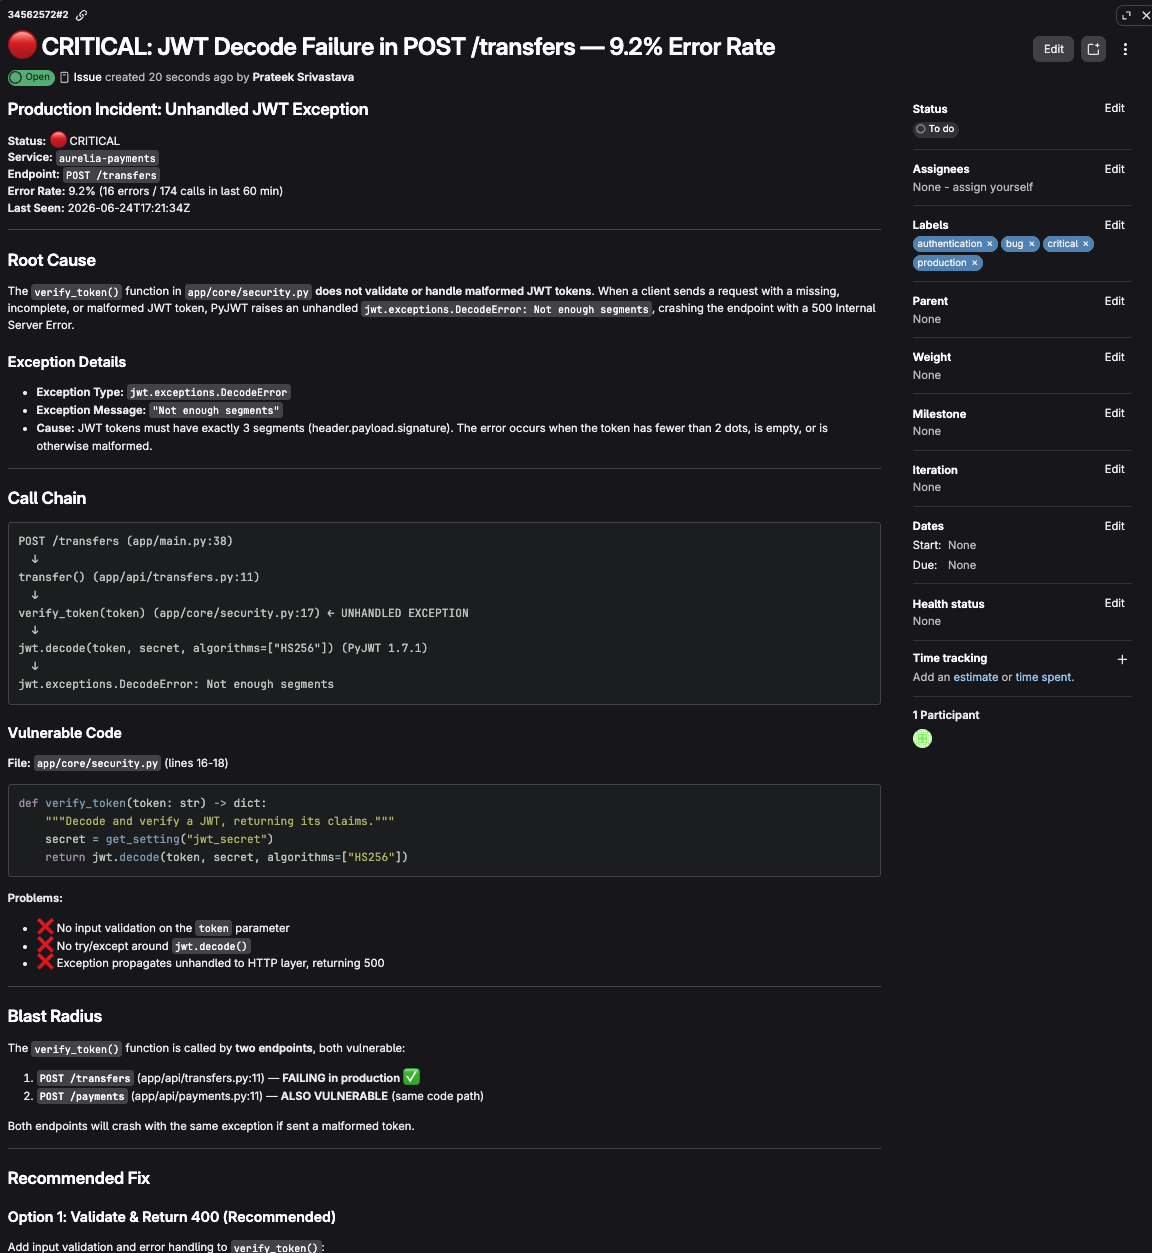
It is honest about scope: it also finds a CWE-327 md5 weakness on the same auth path and labels it a related but separate defect, not the cause of this 500. Observability tells you what is failing; the code graph tells you why, where, and who. Nobody joins those two worlds at the moment an incident is live.
How we built it
The architecture — bridge two live data sources into one verdict
┌──────────────────────────────────────────────────────────────┐
│                     Developer's IDE                          │
│              Antigravity + GitLab Duo Agent Platform         │
│              "Diagnose the failing operation in production." │
└───────────────────────────┬──────────────────────────────────┘
                            │ 3 published agents (thin prompt + skills/*.SKILL.md)
                            ▼
┌──────────────────────────────────────────────────────────────┐
│                   Intelligence Layer                         │
│         GitLab AI Catalog — The Bridge fleet                 │
│  Live Trace Reader ⭐  ·  Code Join ⭐  ·  The Bridge (orch.) │
│  (orch. runs verify + owner + finding + fix internally)      │
└──────────┬─────────────────────────────────┬─────────────────┘
           │ query_error_traces (o11y-bridge) │ query_graph (Orbit MCP) + GitLab tools
           ▼                                 ▼
┌──────────────────────────┐  ┌────────────────────────────────┐
│  o11y-bridge MCP         │  │  GitLab Orbit Knowledge Graph  │
│  (custom stdio server)   │  │  + GitLab security tools       │
│                          │  │                                │
│  → GitLab Observability  │  │  ImportedSymbol (owning code,  │
│    (SigNoz) query API    │  │    blast radius)               │
│                          │  │  AUTHORED (owner)              │
│  the WHAT (live symptom) │  │  list_vulnerabilities (finding)│
│                          │  │  → create_issue (human-gated)  │
└──────────────────────────┘  └────────────────────────────────┘
   ▲ real OpenTelemetry spans from the running app
   │
┌──────────────────────────────────────────────────────────────┐
│  Aurelia Payments (FastAPI) + serve_traced.py (OTel)         │
│  POST /transfers → verify_token → jwt.decode (UNGUARDED) → 500│
└──────────────────────────────────────────────────────────────┘
The hero — joining a live trace to the code graph
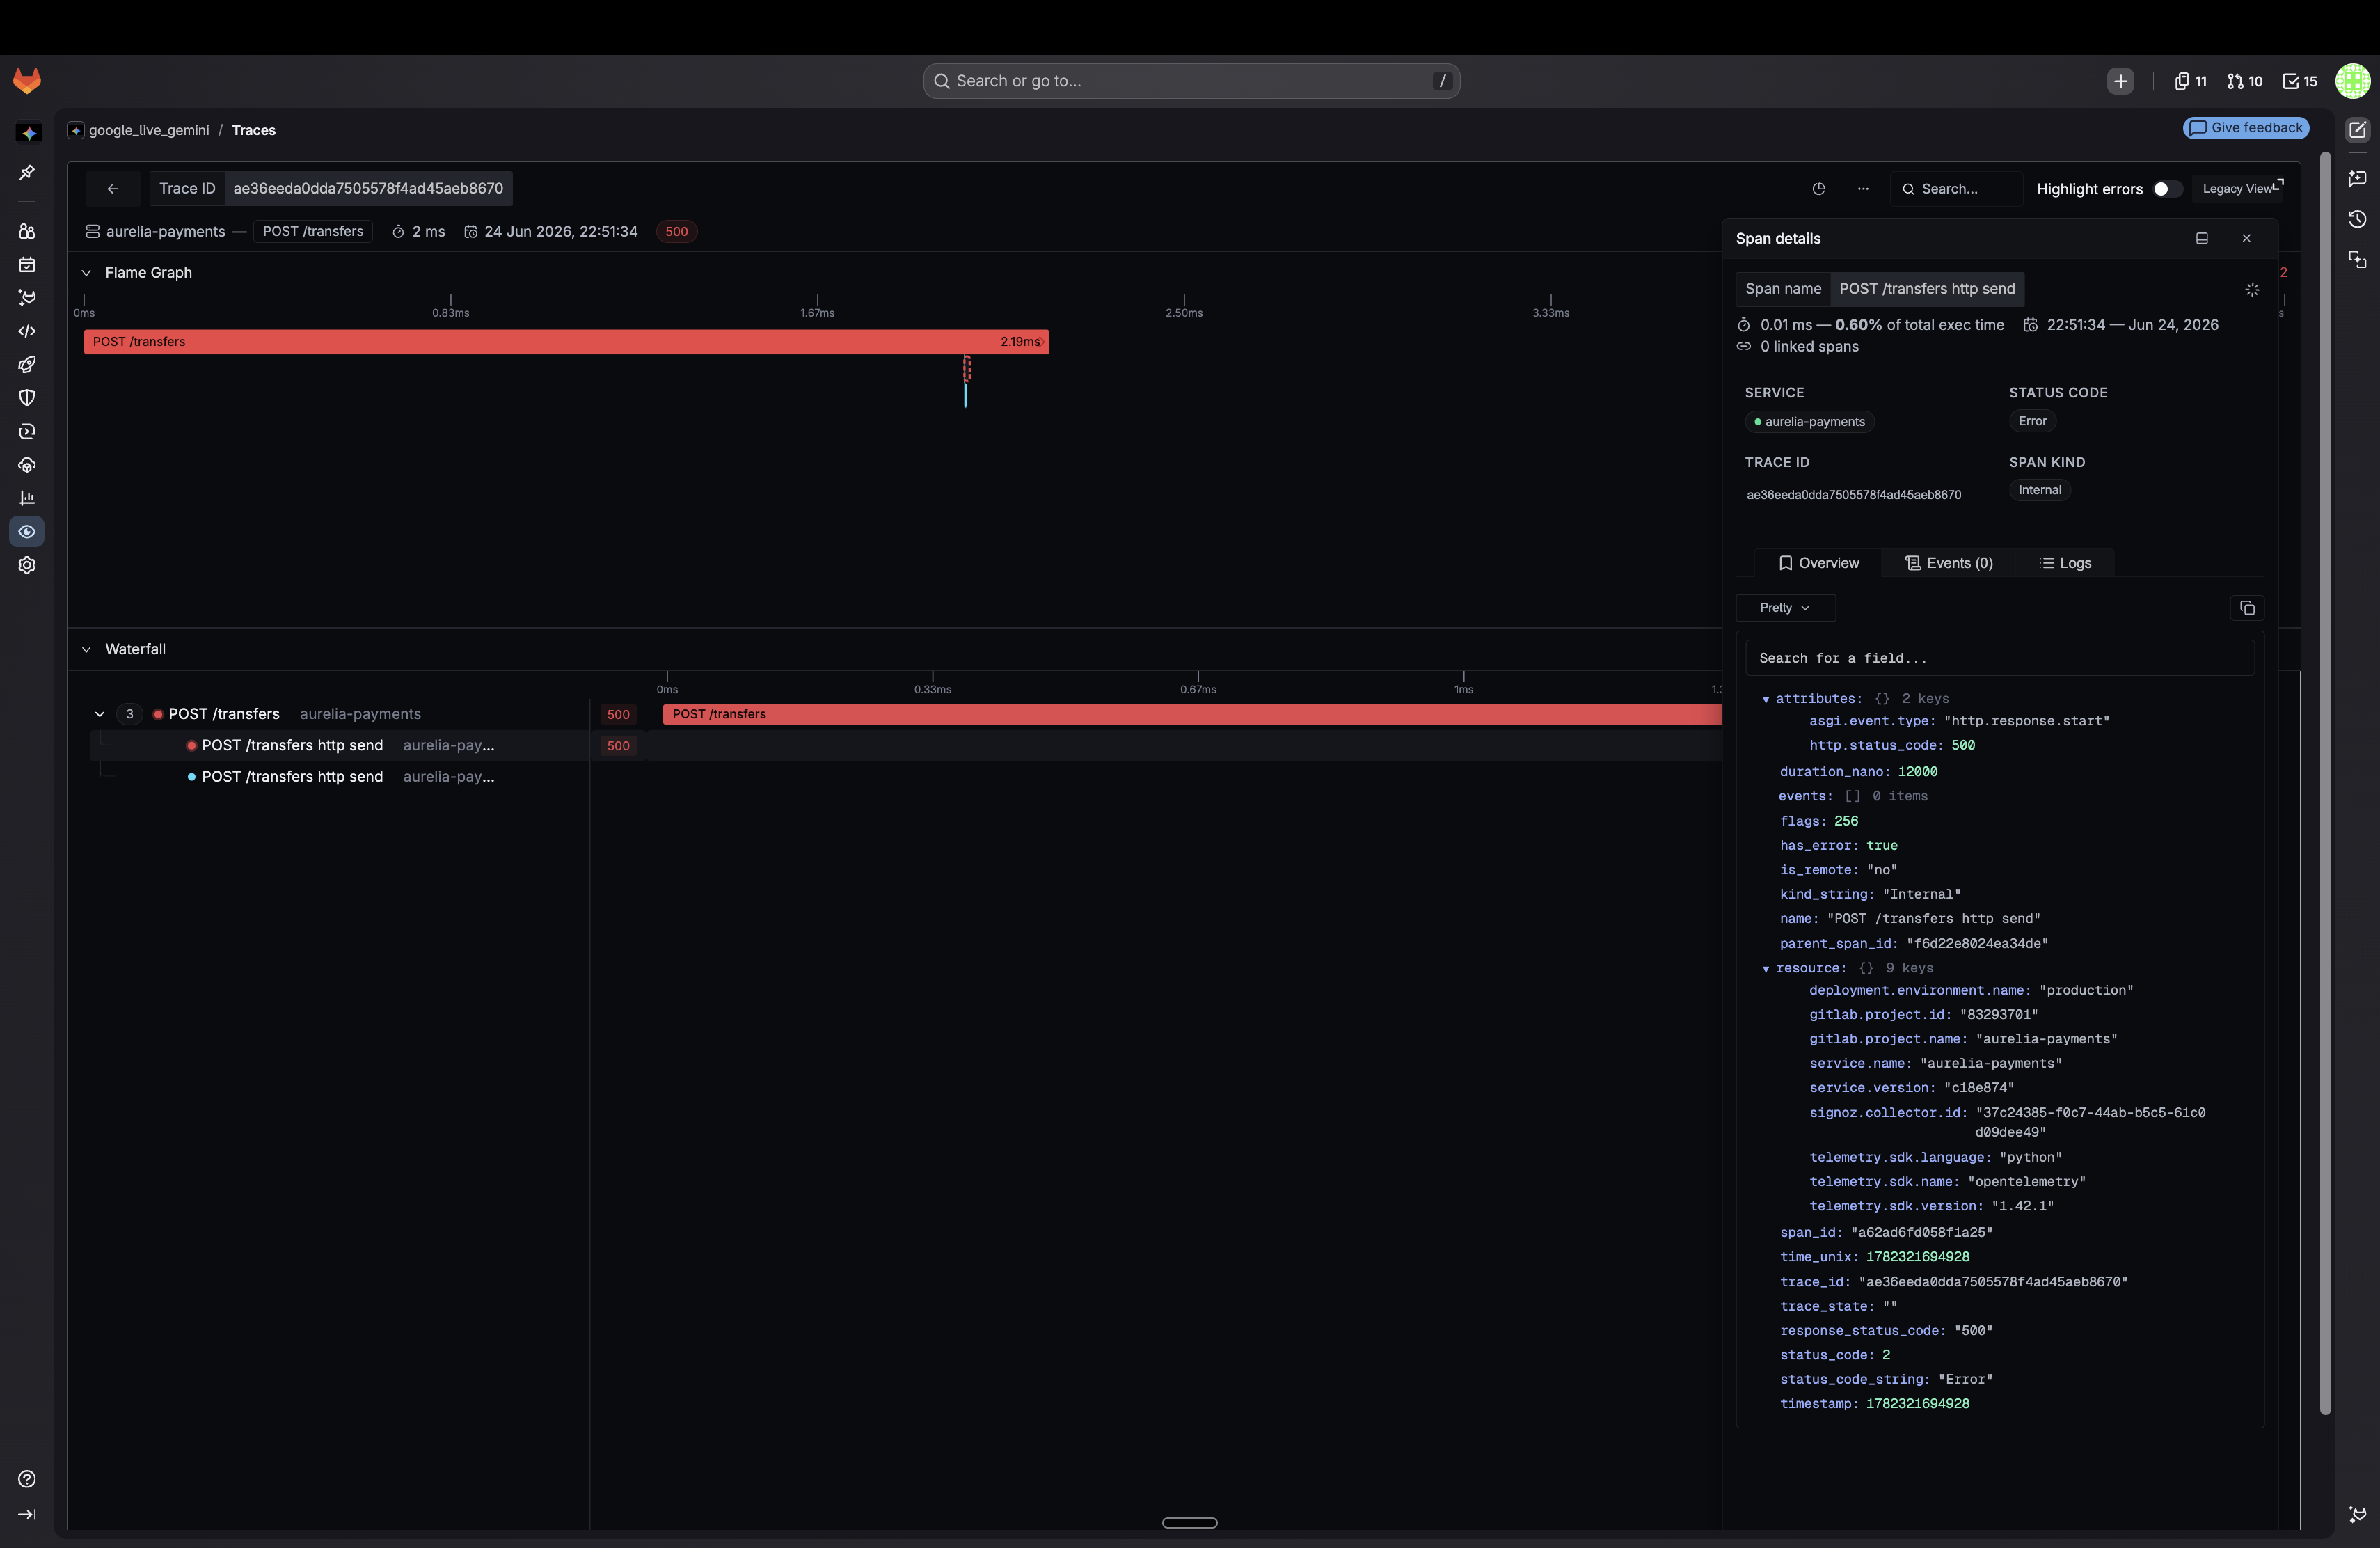
A bad bearer token hits the route, verify_token calls jwt.decode with no try/except, the exception is
unhandled, and the request 500s — captured as a real OpenTelemetry ERROR span. The Live Trace Reader
pulls that span back through the o11y-bridge; Code Join then asks the graph who owns POST /transfers,
what does it import, and who imports that?
{"query_type":"traversal","node":{"id":"s","entity":"ImportedSymbol",
 "columns":["file_path","import_path"],
 "filters":{"project_id":{"op":"eq","value":83293701},
            "import_path":{"op":"contains","value":"app.core.security"}}},"limit":50}
The graph answers with the real importers — transfers.py, payments.py, auth.py — the blast radius,
read not guessed. The symptom came from runtime; the cause came from the graph. Two worlds, one join.
The workflow in action
Developer: "Diagnose the failing operation in production."
    │
    ▼
TRACE — Live Trace Reader  → query_error_traces → POST /transfers · 500 · ×N
                             · exception: jwt.exceptions.DecodeError  (the error CLASS, no source file)
    │
    ▼
JOIN  — Code Join          → anchored on the exception: a DecodeError → where do we decode JWTs?
                             → query_graph: transfers.py owns it → imports security.py
                             → root cause: verify_token → jwt.decode UNGUARDED (raises that DecodeError)
                             → blast radius: payments.py, transfers.py, auth.py
    │
    ▼
The Bridge (orchestrator — runs the rest itself):
   VERIFY  → re-queries the graph, re-reads security.py → ✅ break confirmed
             → CWE-327 md5 on the path: 🟠 related, SEPARATE — not the cause
   OWNER   → author of the MR that last touched security.py
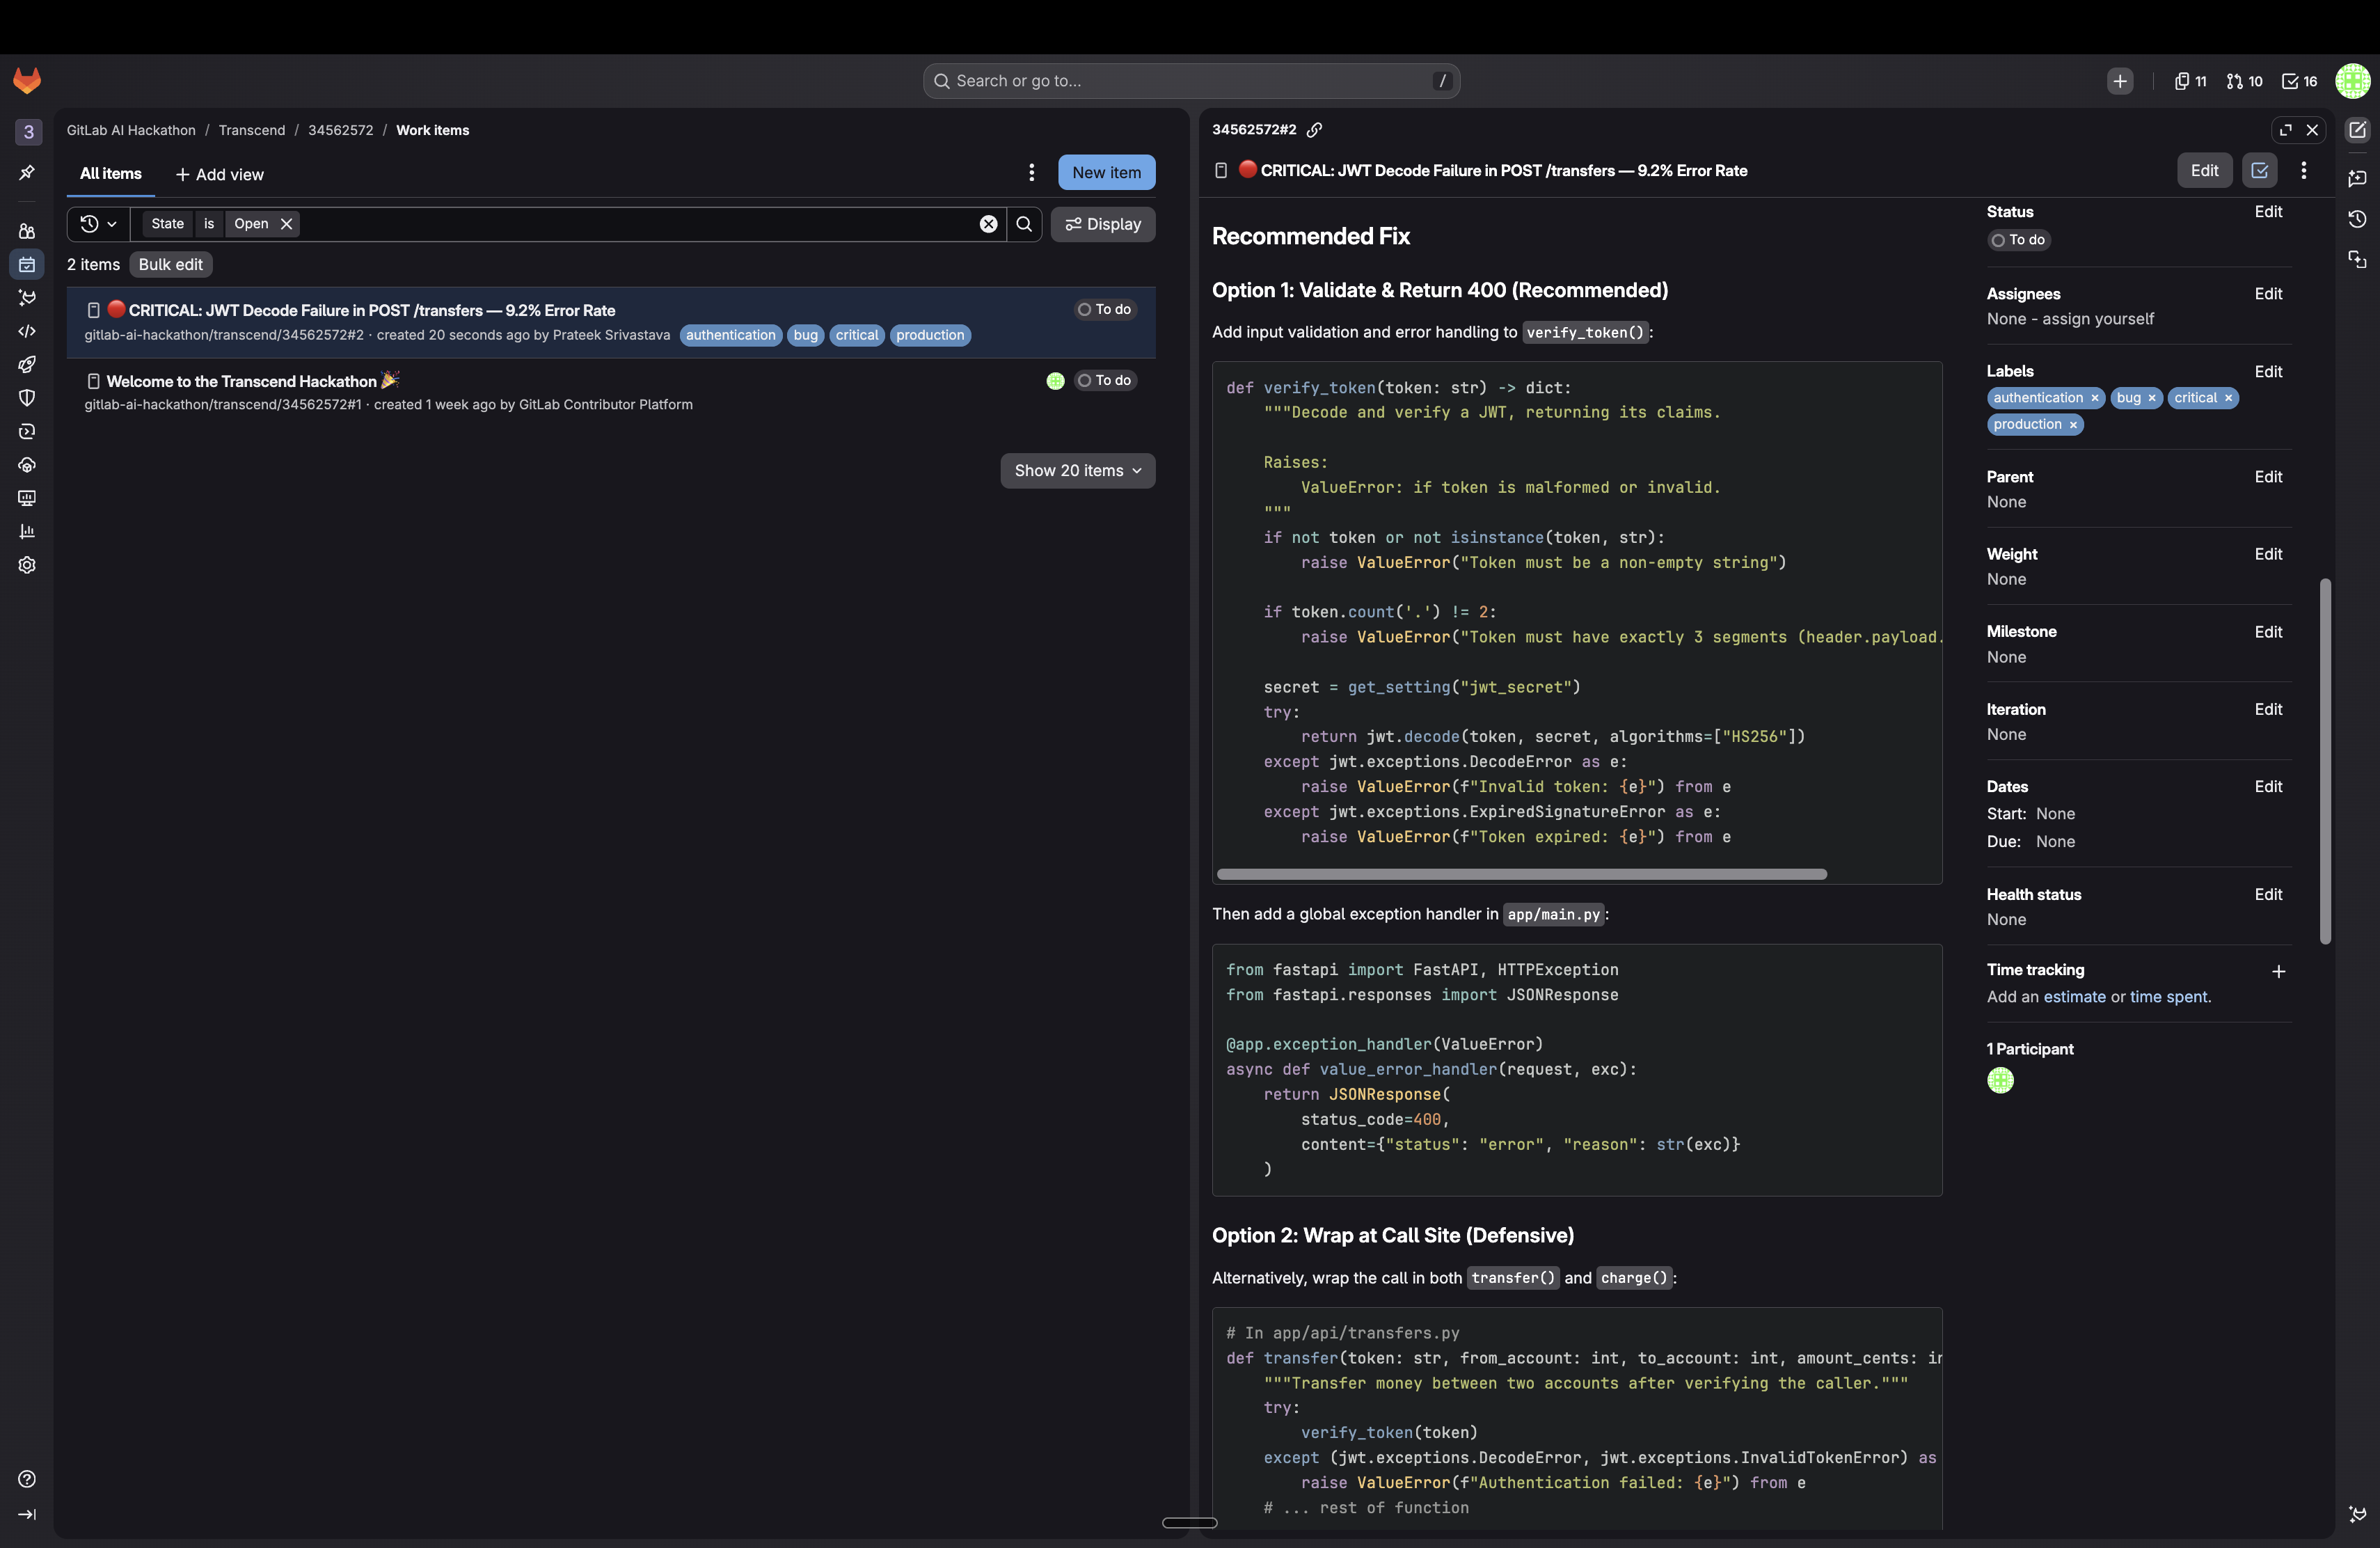
   FIX     → wrap jwt.decode, return 401 (not 500); rotate the signing secret
    │
    ▼
   ONE root-cause verdict + confidence  →  HUMAN GATE  →  create_issue
   (trace → owning code → suspect → blast radius → finding → owner → fix)
The pieces
- A custom MCP bridge to GitLab Observability —
o11y_bridge/is a stdio MCP server (query_error_traces,list_error_services) over the GitLab Observability (SigNoz) query API. It normalizes raw spans into a tiny operational signal (service, operation, status, count, trace id, and the live exception — see below) and deliberately returns no source file — so the graph walk is the analysis, not a lookup. TDD'd against the real SigNoz response shapes; the signing key is read from the Keychain/env, never on disk. - The exception is the ground truth —
query_error_tracesfetches the OTel exception event off the error span (GET /api/v1/traces/<id>) and surfacesexceptionType+exceptionMessage(jwt.exceptions.DecodeError: Not enough segments) — the error class, never a file or stack frame. This is what makes the root cause derivable instead of guessable (the hard-won fix below). - Real OpenTelemetry traces —
serve_traced.pywraps the demo app with OTel; the 500 is a genuine unhandledjwt.exceptions.DecodeError, captured as a real ERROR span, queried back through the bridge. - GitLab Orbit as ground truth — owning module, suspect import, blast radius, and ownership are real
query_graphtraversals (ImportedSymbol,AUTHORED), every query scoped to the project. - Thin agents + skills — a
bridge-orchestratorskill drives the chain; each agent is a thin prompt over askills/*/SKILL.mdthat auto-loads from the default branch. We publish three agents — the two ⭐ specialists (the join) + The Bridge — and the orchestrator runs verify, owner, finding-correlation, and the fix internally (its skill, Steps 3–7), so no standalone Critic / Owner / Remediation agent is needed. Specialists → orchestrator (verify → finding → owner → fix) → human gate. - The action:
create_issue, gated behind explicit human approval. - Demo substrate: Aurelia Payments, a small FastAPI backend with a genuinely unguarded
jwt.decodeand a real CWE-327 finding — an import graph deep enough to make the join bite.
Challenges we ran into
Two agents, two different wrong answers — and the fix that makes the diagnosis honest
This was the hard one, and it changed the architecture. In a dry run, Code Join and The Bridge — handed the
same live 500 — confidently produced two different, both-wrong root causes. Code Join blamed a Jinja2
ReDoS CVE it found on the path; The Bridge blamed an O(n) account scan and "timeout exceptions," at 95%
confidence. The actual cause was the unguarded jwt.decode. Neither agent was lying — they were guessing,
because the only signal they had was "POST /transfers is 500." The demo substrate even baited them: a
real Jinja2 CVE sits on the verify_token path, so the scariest thing on the graph was not the cause.
A confidently-wrong root cause on camera would have sunk an integrity-first submission. The fix had to make
the cause derivable, not guessable — so we made the trace carry the one fact that decides it: the
exception. We enriched the o11y-bridge to pull the OTel exception event off the error span
(GET /api/v1/traces/<id>) and hand the agents jwt.exceptions.DecodeError: Not enough segments — the error
class, never a file. Now the rule is exact: the cause is where that exception is raised unhandled. A
DecodeError is not a ReDoS, not a weak hash, not a timeout — so the Jinja2 and md5 findings self-demote to
related-but-separate, and both agents converge on the real jwt.decode @ security.py:24. We re-ran them:
same exception, same line, every time.
Then the integrity catch on our own fix: our first version put jwt.exceptions.DecodeError into the
skills as an "e.g." — handing the agent the demo's answer, the very thing we forbid. We genericized every
skill to teach the method (ground on whatever exception the tool returns; KeyError → the unchecked
access; a CVE on the path is a separate finding; findings come from the scanner, never a code comment) with
zero demo literals. The agent now derives DecodeError from the live trace — it is never told it.
The curl that would have stalled the demo
The pre-flight that mints the live 500s used an Authorization: Bearer header — but the /transfers route
takes token as a query param, so the header was ignored and the call would have returned a 422
(missing params), not a 500. No 500 span → the Live Trace Reader reads a clean window → the whole demo
stalls. We caught it by reading the route signature and testing live:
POST /transfers?token=not-a-real-jwt&... → HTTP 500, before any account logic. A tiny detail that
would have been a silent on-camera failure.
Two live data sources, and the fragile one ages out
The Bridge needs o11y and the graph healthy at once. The o11y window is short — error spans age out, so a recent query returns empty even though the failure happened. The fix is procedural and non-negotiable in the runbook: re-mint fresh 500s right before recording, wait for ingest, and smoke-test both the o11y-bridge (non-zero error ops) and Orbit (rows) before any agent runs.
The trace names the failure mode — the graph names the line
The trace's exception is the what (a DecodeError — the failure mode); it is deliberately not a
source file. The where — the exact unguarded line — must still be confirmed in the graph and the code. We
drew the line precisely: the Live Trace Reader surfaces the exception class and names no file; Code Join
turns "a DecodeError on transfers" into "where do we decode JWTs?" and confirms the unguarded call against a
real query_graph result + the source. The exception narrows the suspect; the graph and the code prove it.
That two-step is what makes the diagnosis trustworthy instead of a plausible guess.
"0 CALLS edges" was a stale, self-undersell caveat
We'd documented zero function-level CALLS edges and claimed import-level only. A live query proved CALLS edges now exist — so the honest caveat had become a false-modest one. We reframed: CALLS edges exist but can be incomplete — use them as a lead, confirm by reading the code. (Findings still come from the security tools, never Orbit, whose Finding nodes return 0 to filtered queries.)
The wrong graph query looks like a dead graph
Shared with our pre-merge submission: neighbors/IMPORTS queries silently return empty while
ImportedSymbol filtered by import_path is the one that works — and an empty result looks like the
graph is down, tempting the agent to grep a README. We hard-wired the right query and a rule: an empty
result is a wrong-query error, never permission to ground on prose.
Accomplishments that we're proud of
The join nobody else builds. Plenty of tools read traces; plenty read code. We could not find another AI-Catalog agent that takes a live production trace and walks it into a code knowledge graph to name the owning file, the root-cause line, and the blast radius. Orbit-over-MCP made it possible; we're first to wire runtime telemetry into the code graph at incident time.
It's real end to end. The trace is a genuine OTel ERROR span from a genuine unhandled DecodeError
(valid token → 200, malformed → 500, verified live). The blast radius is a real query_graph result. The
issue it opens is a real GitLab issue. Nothing is mocked.
Verifiable, not just plausible. Because the diagnosis is grounded in the live exception, you can check
it: the exception.type the agent names (jwt.exceptions.DecodeError) and the security.py:24 frame are
right there in the GitLab Observability trace's exception event. Same class, same line. Two independent
agents, fed only the trace, now converge on the same answer every run — the opposite of a confident guess.
Honest scope. It finds the CWE-327 md5 weakness on the same path and refuses to call it the cause — "related, but separate." An adversarial critic re-queries the graph and drops anything it can't confirm. The verdict carries only what survives.
Human-gated by design. The single write-action — create_issue — never fires without explicit approval.
The agent recommends; the human decides; only then does it act.
What we learned
o11y says WHAT; the graph says WHY/WHERE/WHO — and the join is the product. The moat isn't reading traces (everyone does) and isn't reading code (everyone does). It's connecting them at the moment an incident is live. Designing the agents to keep those roles separate — symptom from cause — is what makes the output trustworthy.
The system prompt is the reliable lever. Skills auto-load but get ignored or cached; the steers that must hold (the working graph query, the no-prose rule, the human gate) belong in the prompt.
Ground every claim in the trace or the graph — never prose. The biggest credibility risk was an agent
narrating from a writeup instead of a query result. Forcing the cause back to a query_graph row is what
makes "graph-verified" true rather than asserted.
Procedure beats hope for live data. Two live sources, one fragile — the demo only works if you re-mint the failure and smoke-test both before recording. We learned to treat that as part of the build, not an afterthought.
What's next for The Bridge
Trigger automatically off a firing alert — alert → Bridge → draft issue, still human-gated. The on-call engineer wakes up to a diagnosis, not a raw 500.
Rank concurrent failures by blast radius — when three operations are red, diagnose the one whose owning module the most code imports first.
Assign the owner from the authorship edge — set the issue assignee to the engineer the graph already named, and link the issue to the owning MR.
Any service, any o11y backend. The demo emits OTel to GitLab Observability; the join needs only a trace and a graph. Next: validate against a second service and a non-SigNoz OTel backend.
Built with
GitLab Duo Agent Platform · GitLab AI Catalog · GitLab Orbit (Knowledge Graph) · GitLab Observability
(SigNoz) · OpenTelemetry · a custom MCP server (o11y-bridge) · GitLab MCP / query_graph ·
GitLab security tools · Python · FastAPI (demo substrate). Thin-agent + skills/*/SKILL.md architecture.
MIT licensed. DCO sign-off on every commit.
Try it out
- Repo:
gitlab-ai-hackathon/transcend/34562572(MIT, LICENSE in About) — Sub-2 underbridge/+skills/bridge-orchestrator - AI Catalog (Public): Live Trace Reader ⭐ · Code Join ⭐ · The Bridge
- Live trace launcher:
aurelia-demo-frontend/serve_traced.py(OTel → GitLab Observability) - Video (≤3:00): link
Brief description + how it uses the Knowledge Graph (for the form, ≤3 sentences)
The Bridge turns a live production 500 your monitoring can't explain into the exact code that owns it — it
reads the live error trace from GitLab Observability via a custom o11y-bridge MCP, then joins that failing
operation into the GitLab Orbit Knowledge Graph: query_graph over ImportedSymbol finds the owning
module and the blast radius (every file importing the same auth code), and AUTHORED names the owner, with
the root-cause line confirmed by reading the code. An adversarial critic re-queries the graph to verify or
drop every claim, and only after a human approves does it open a tracking issue linking the trace → owning
code → owner → fix. Observability says what is failing; the Knowledge Graph says why, where, and who —
and The Bridge is the first to join them at incident time.
How this differs from our other submission (Impact Engine)
Impact Engine prevents a bad change before merge (static MR diffs → GO/NO-GO). The Bridge diagnoses
a failure already in production (live runtime traces → filed issue). Opposite ends of the lifecycle,
different trigger, a data source the other never touches (telemetry), and a different action (create_issue
vs an MR note). They share only the host platform and the demo app — substantially different submissions.
Built With
- custom-mcp-server
- fastapi
- gitlab-ai-catalog
- gitlab-duo-agent-platform
- gitlab-observability
- gitlab-orbit
- gitlab-security-tools
- opentelemetry
- python
- query-graph

Log in or sign up for Devpost to join the conversation.