-
-
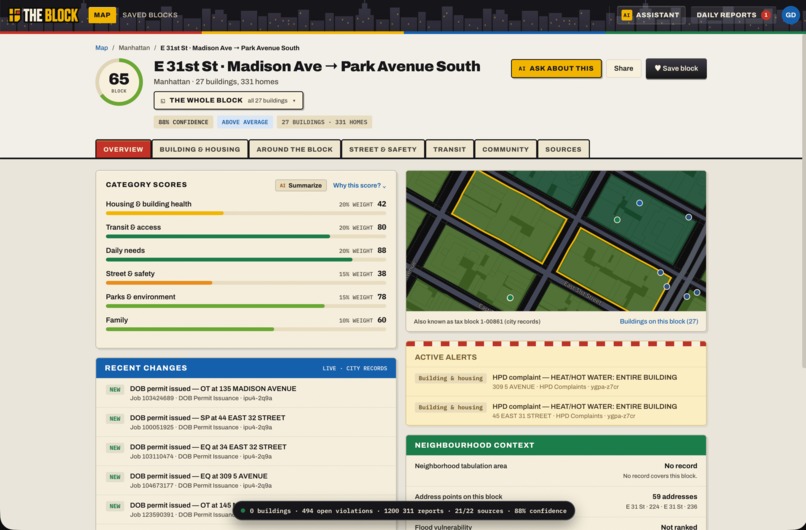
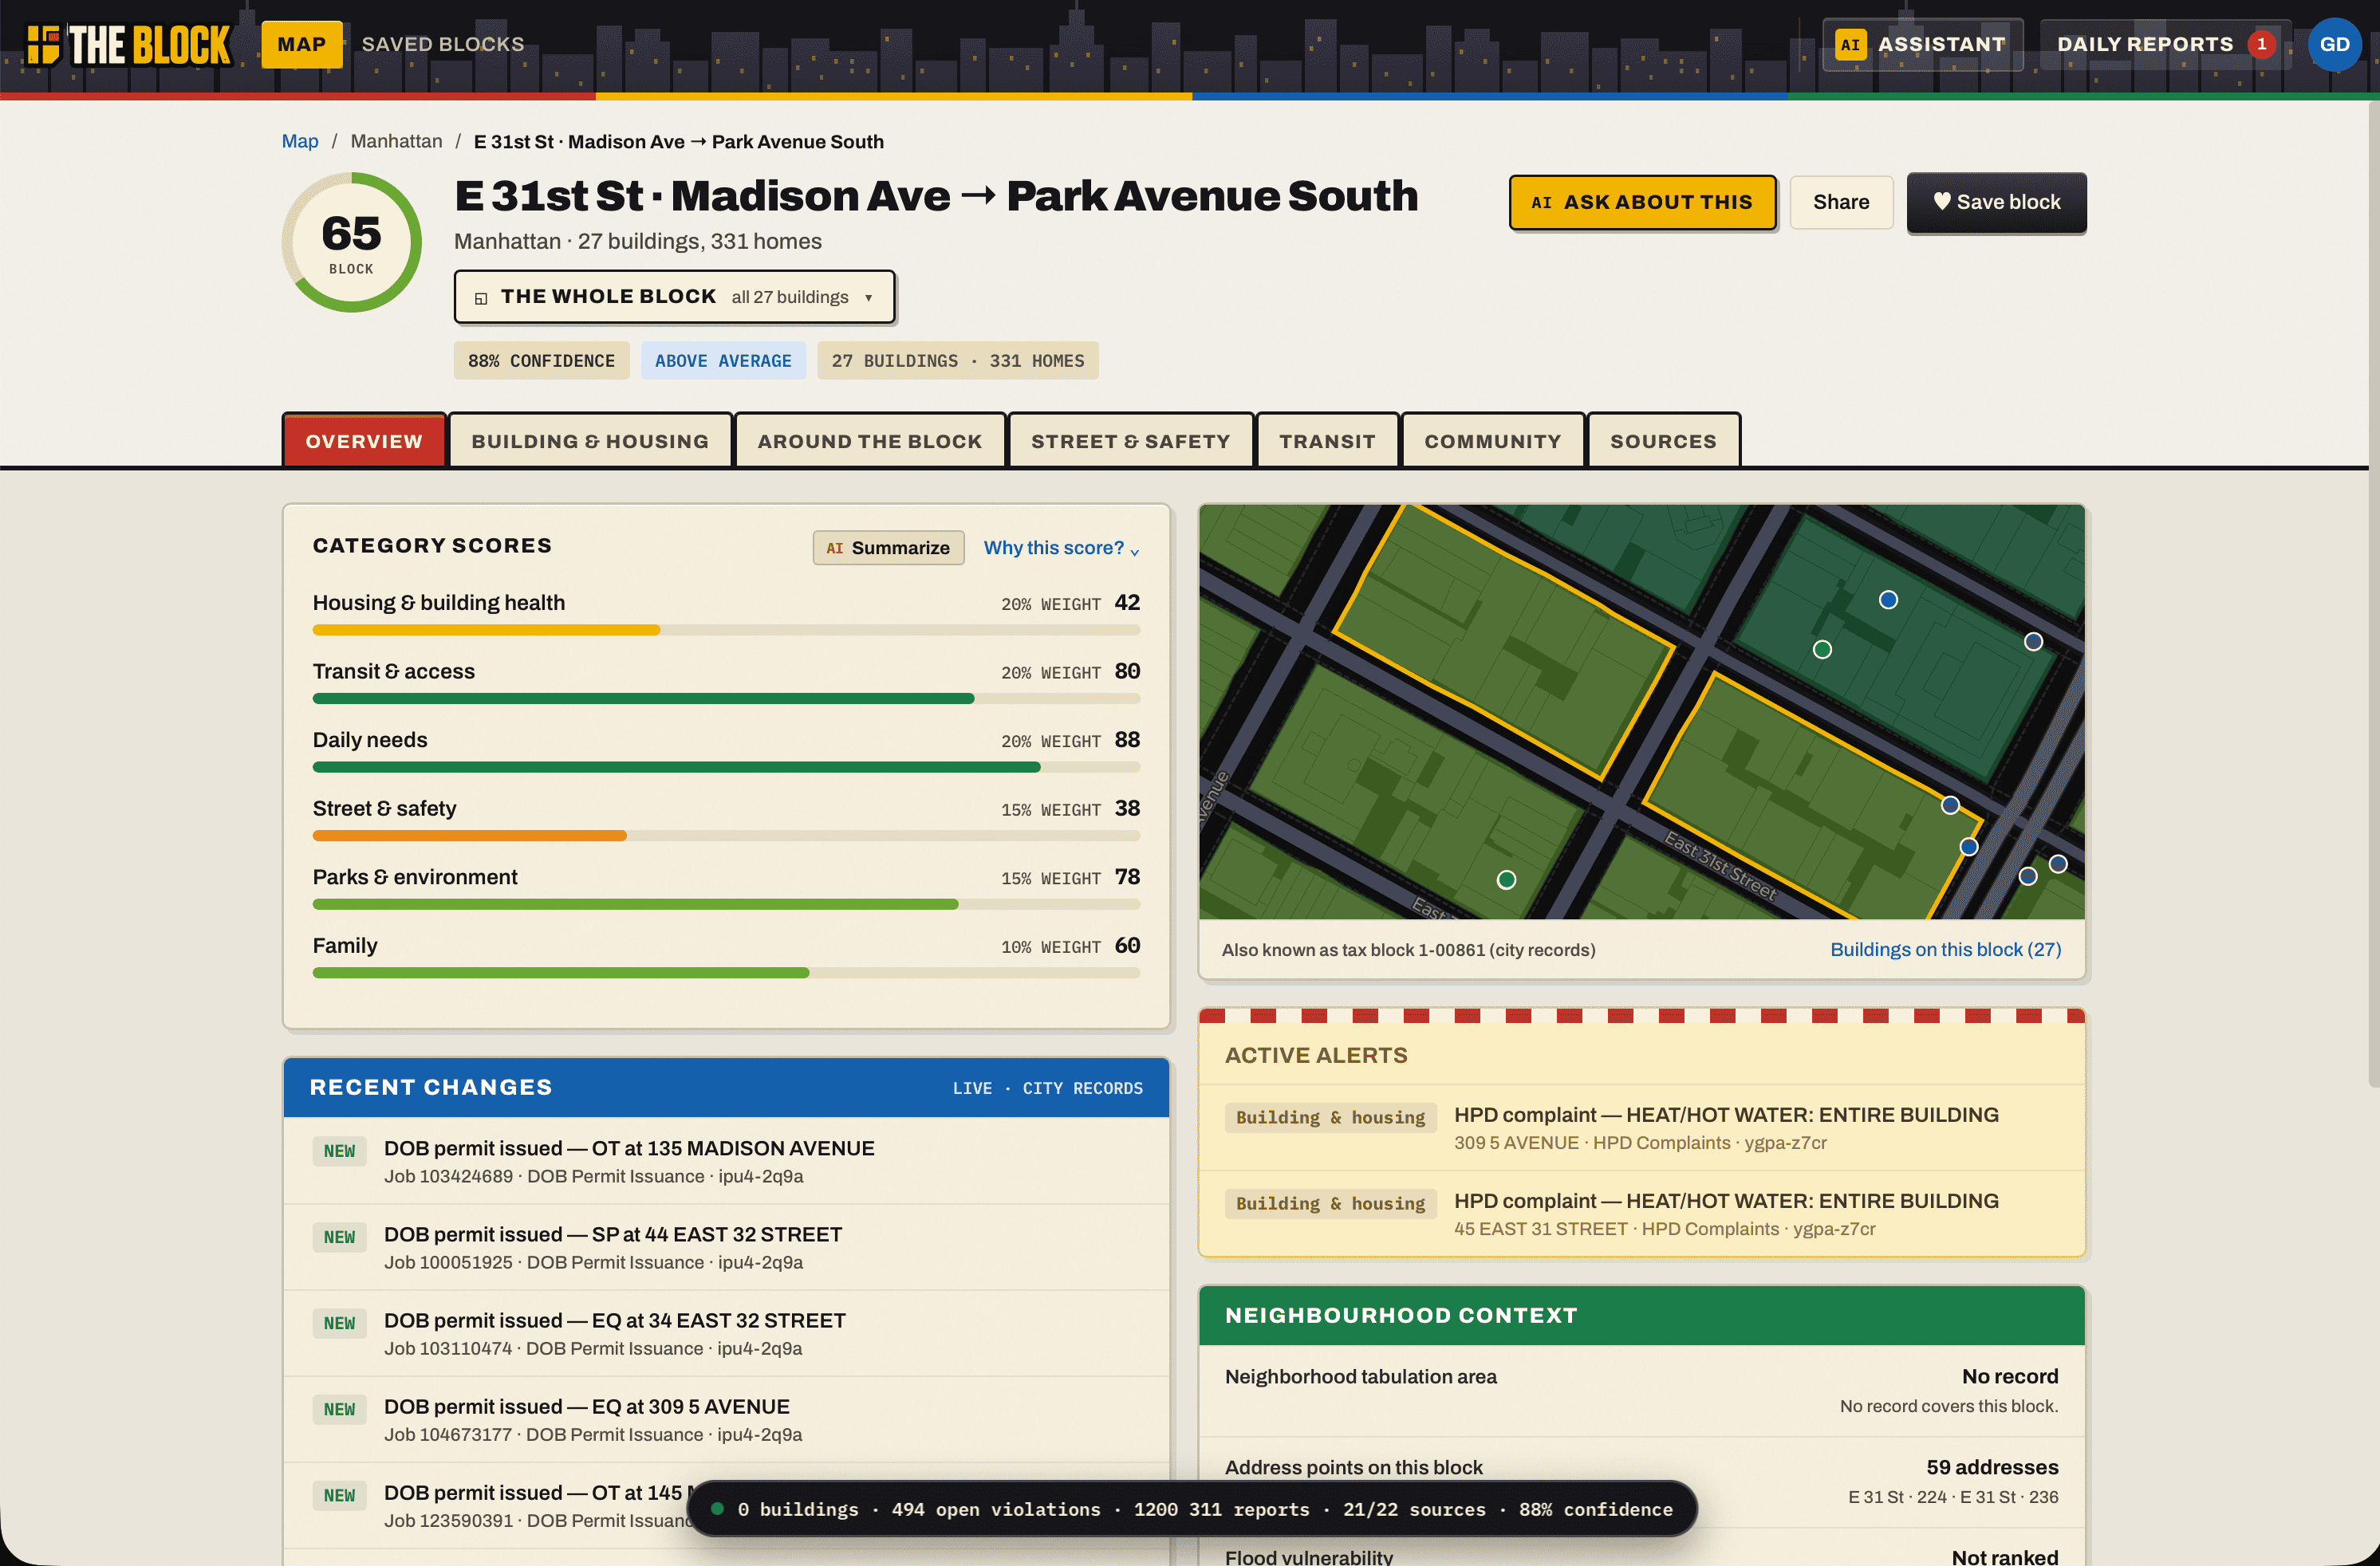
Block Scorecard
-
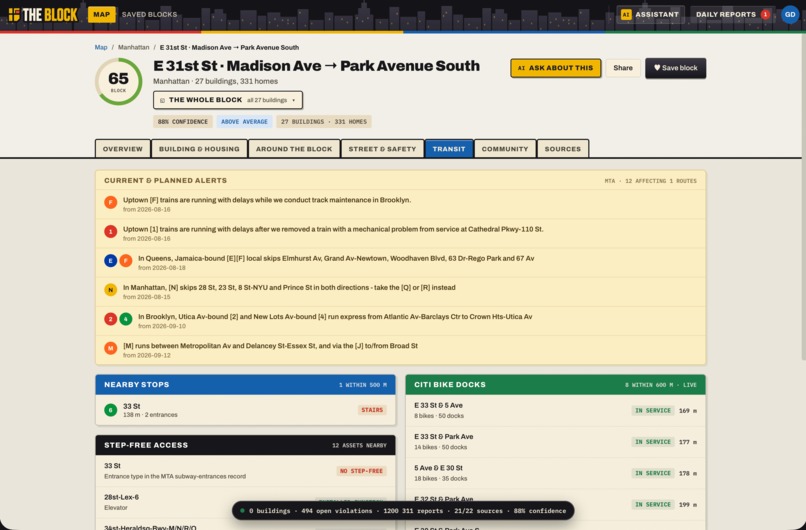
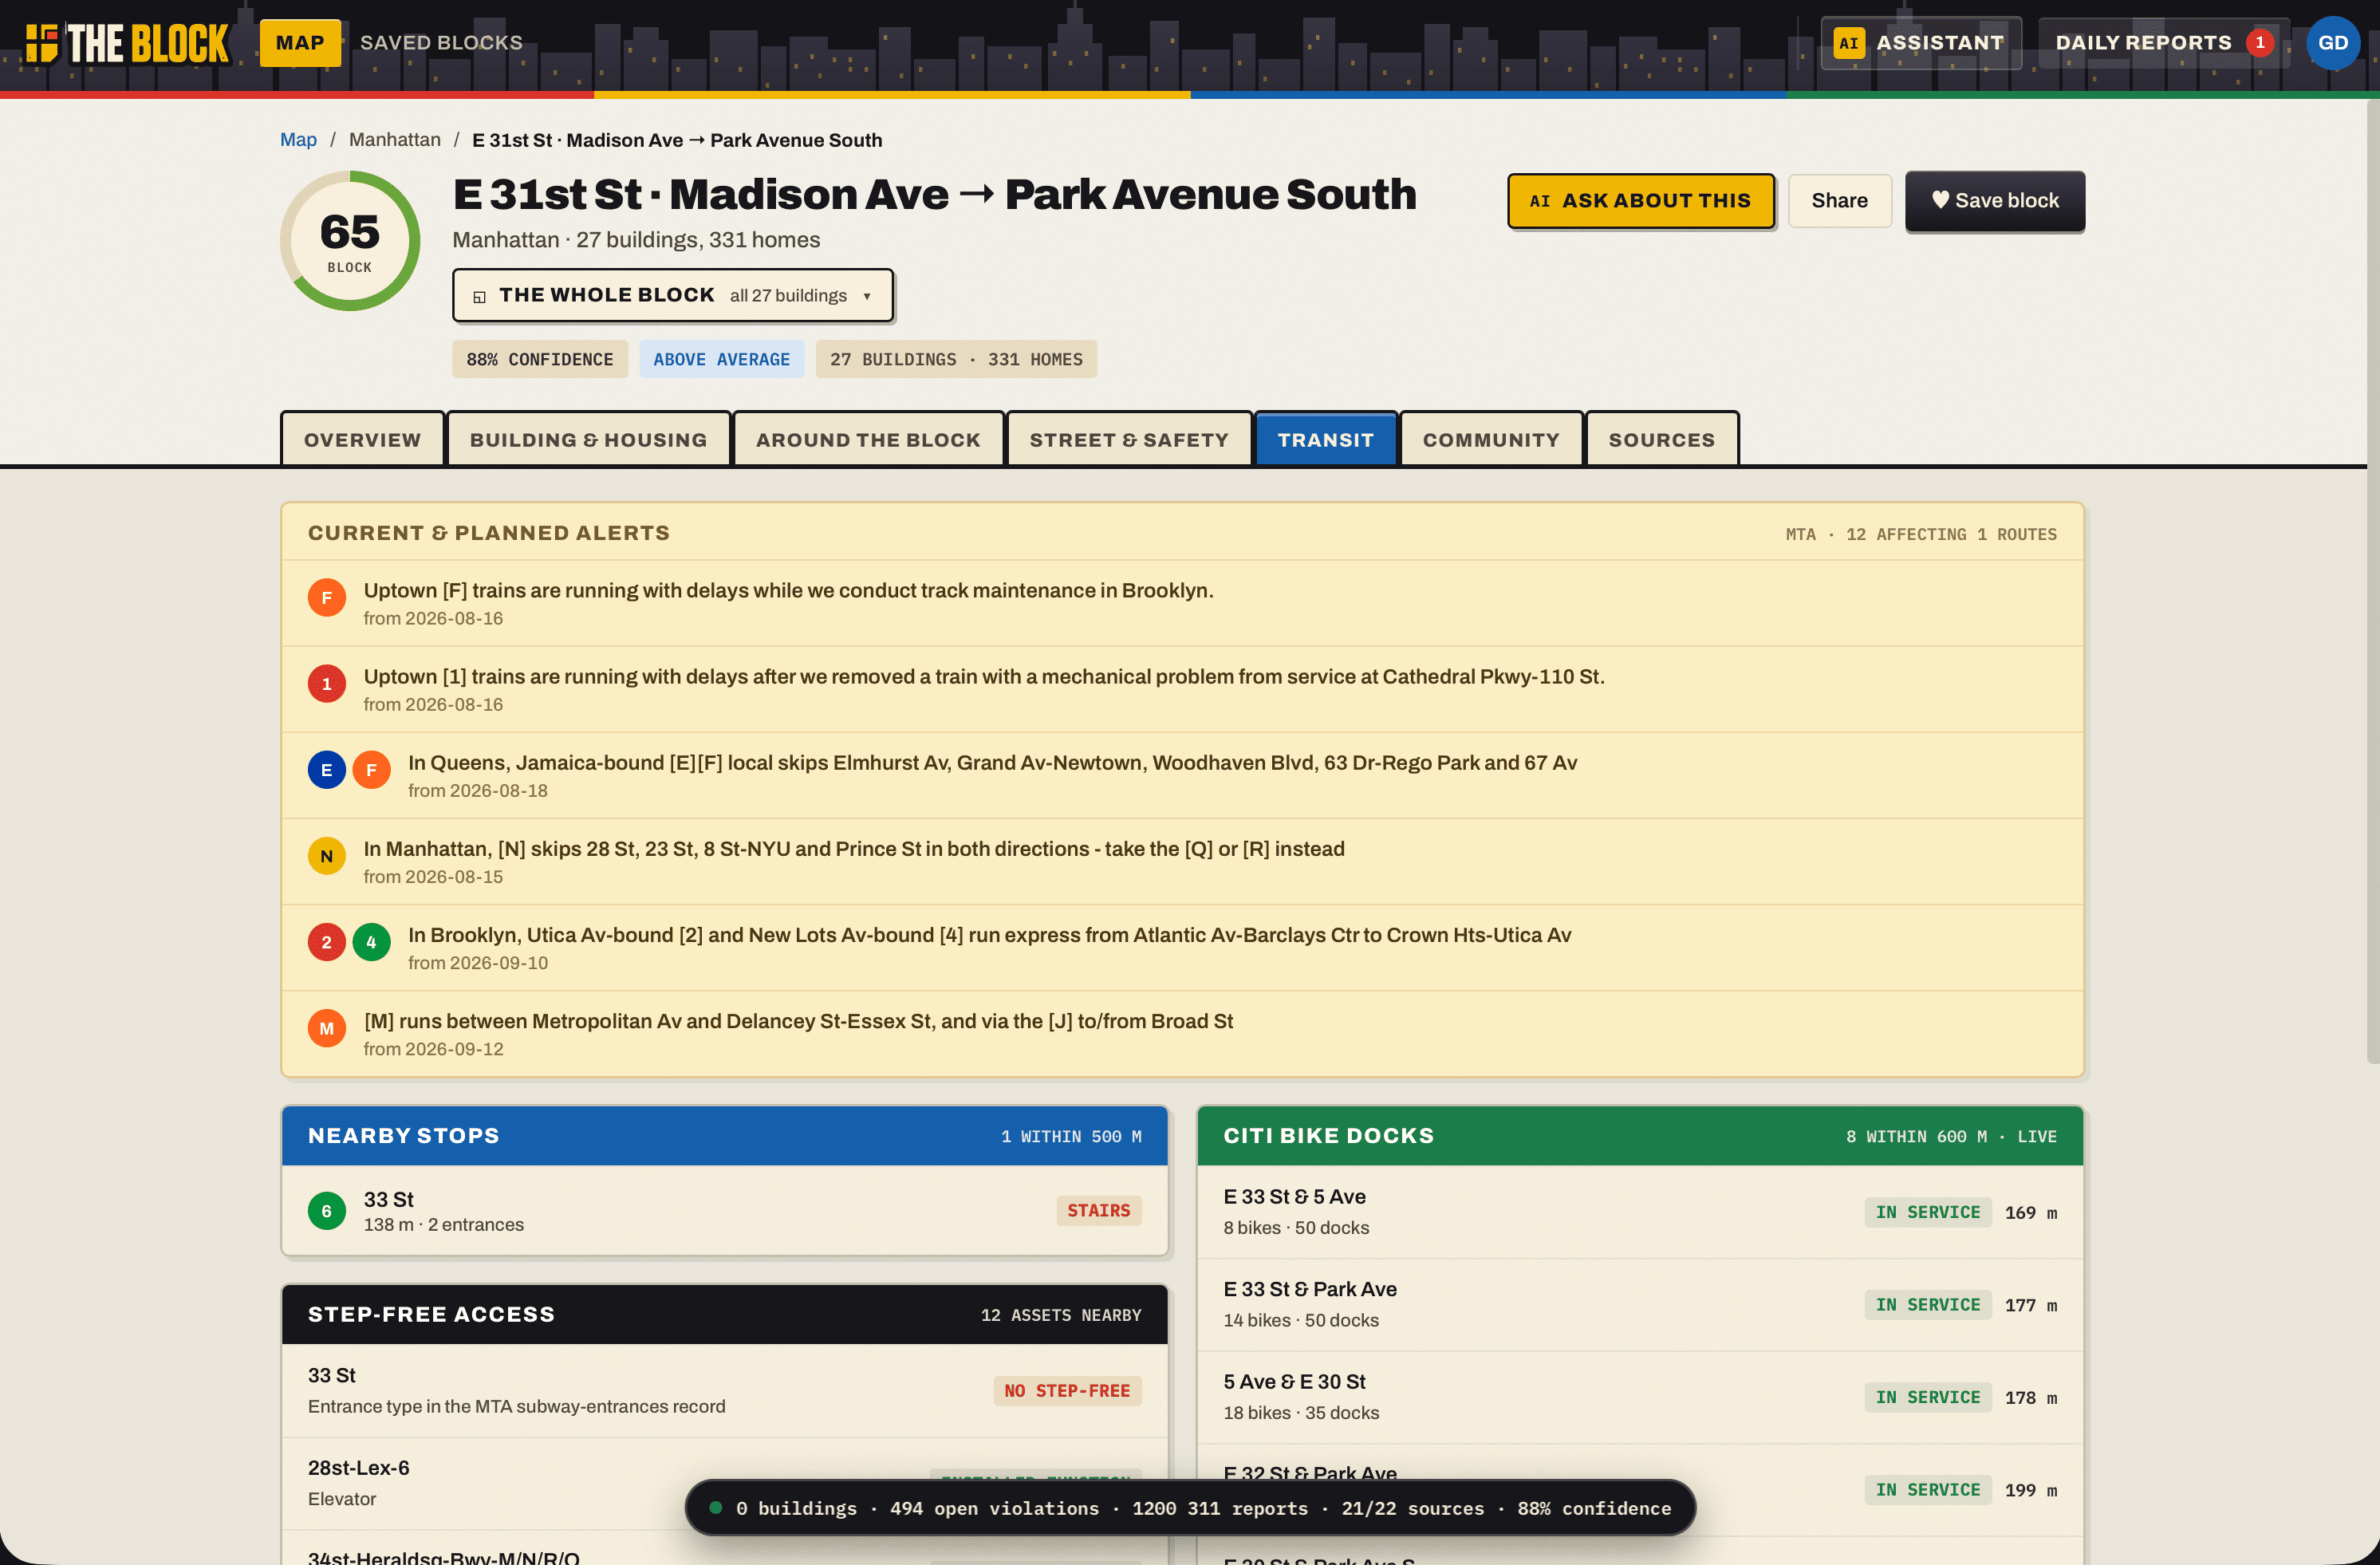
Transit Information
-
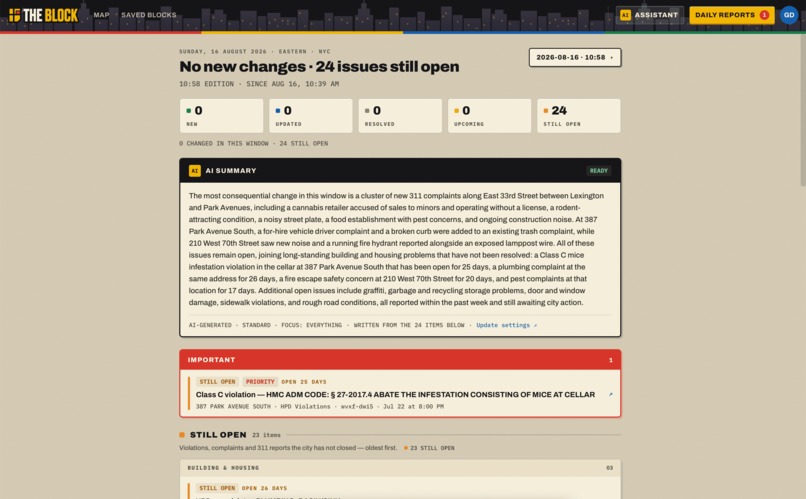
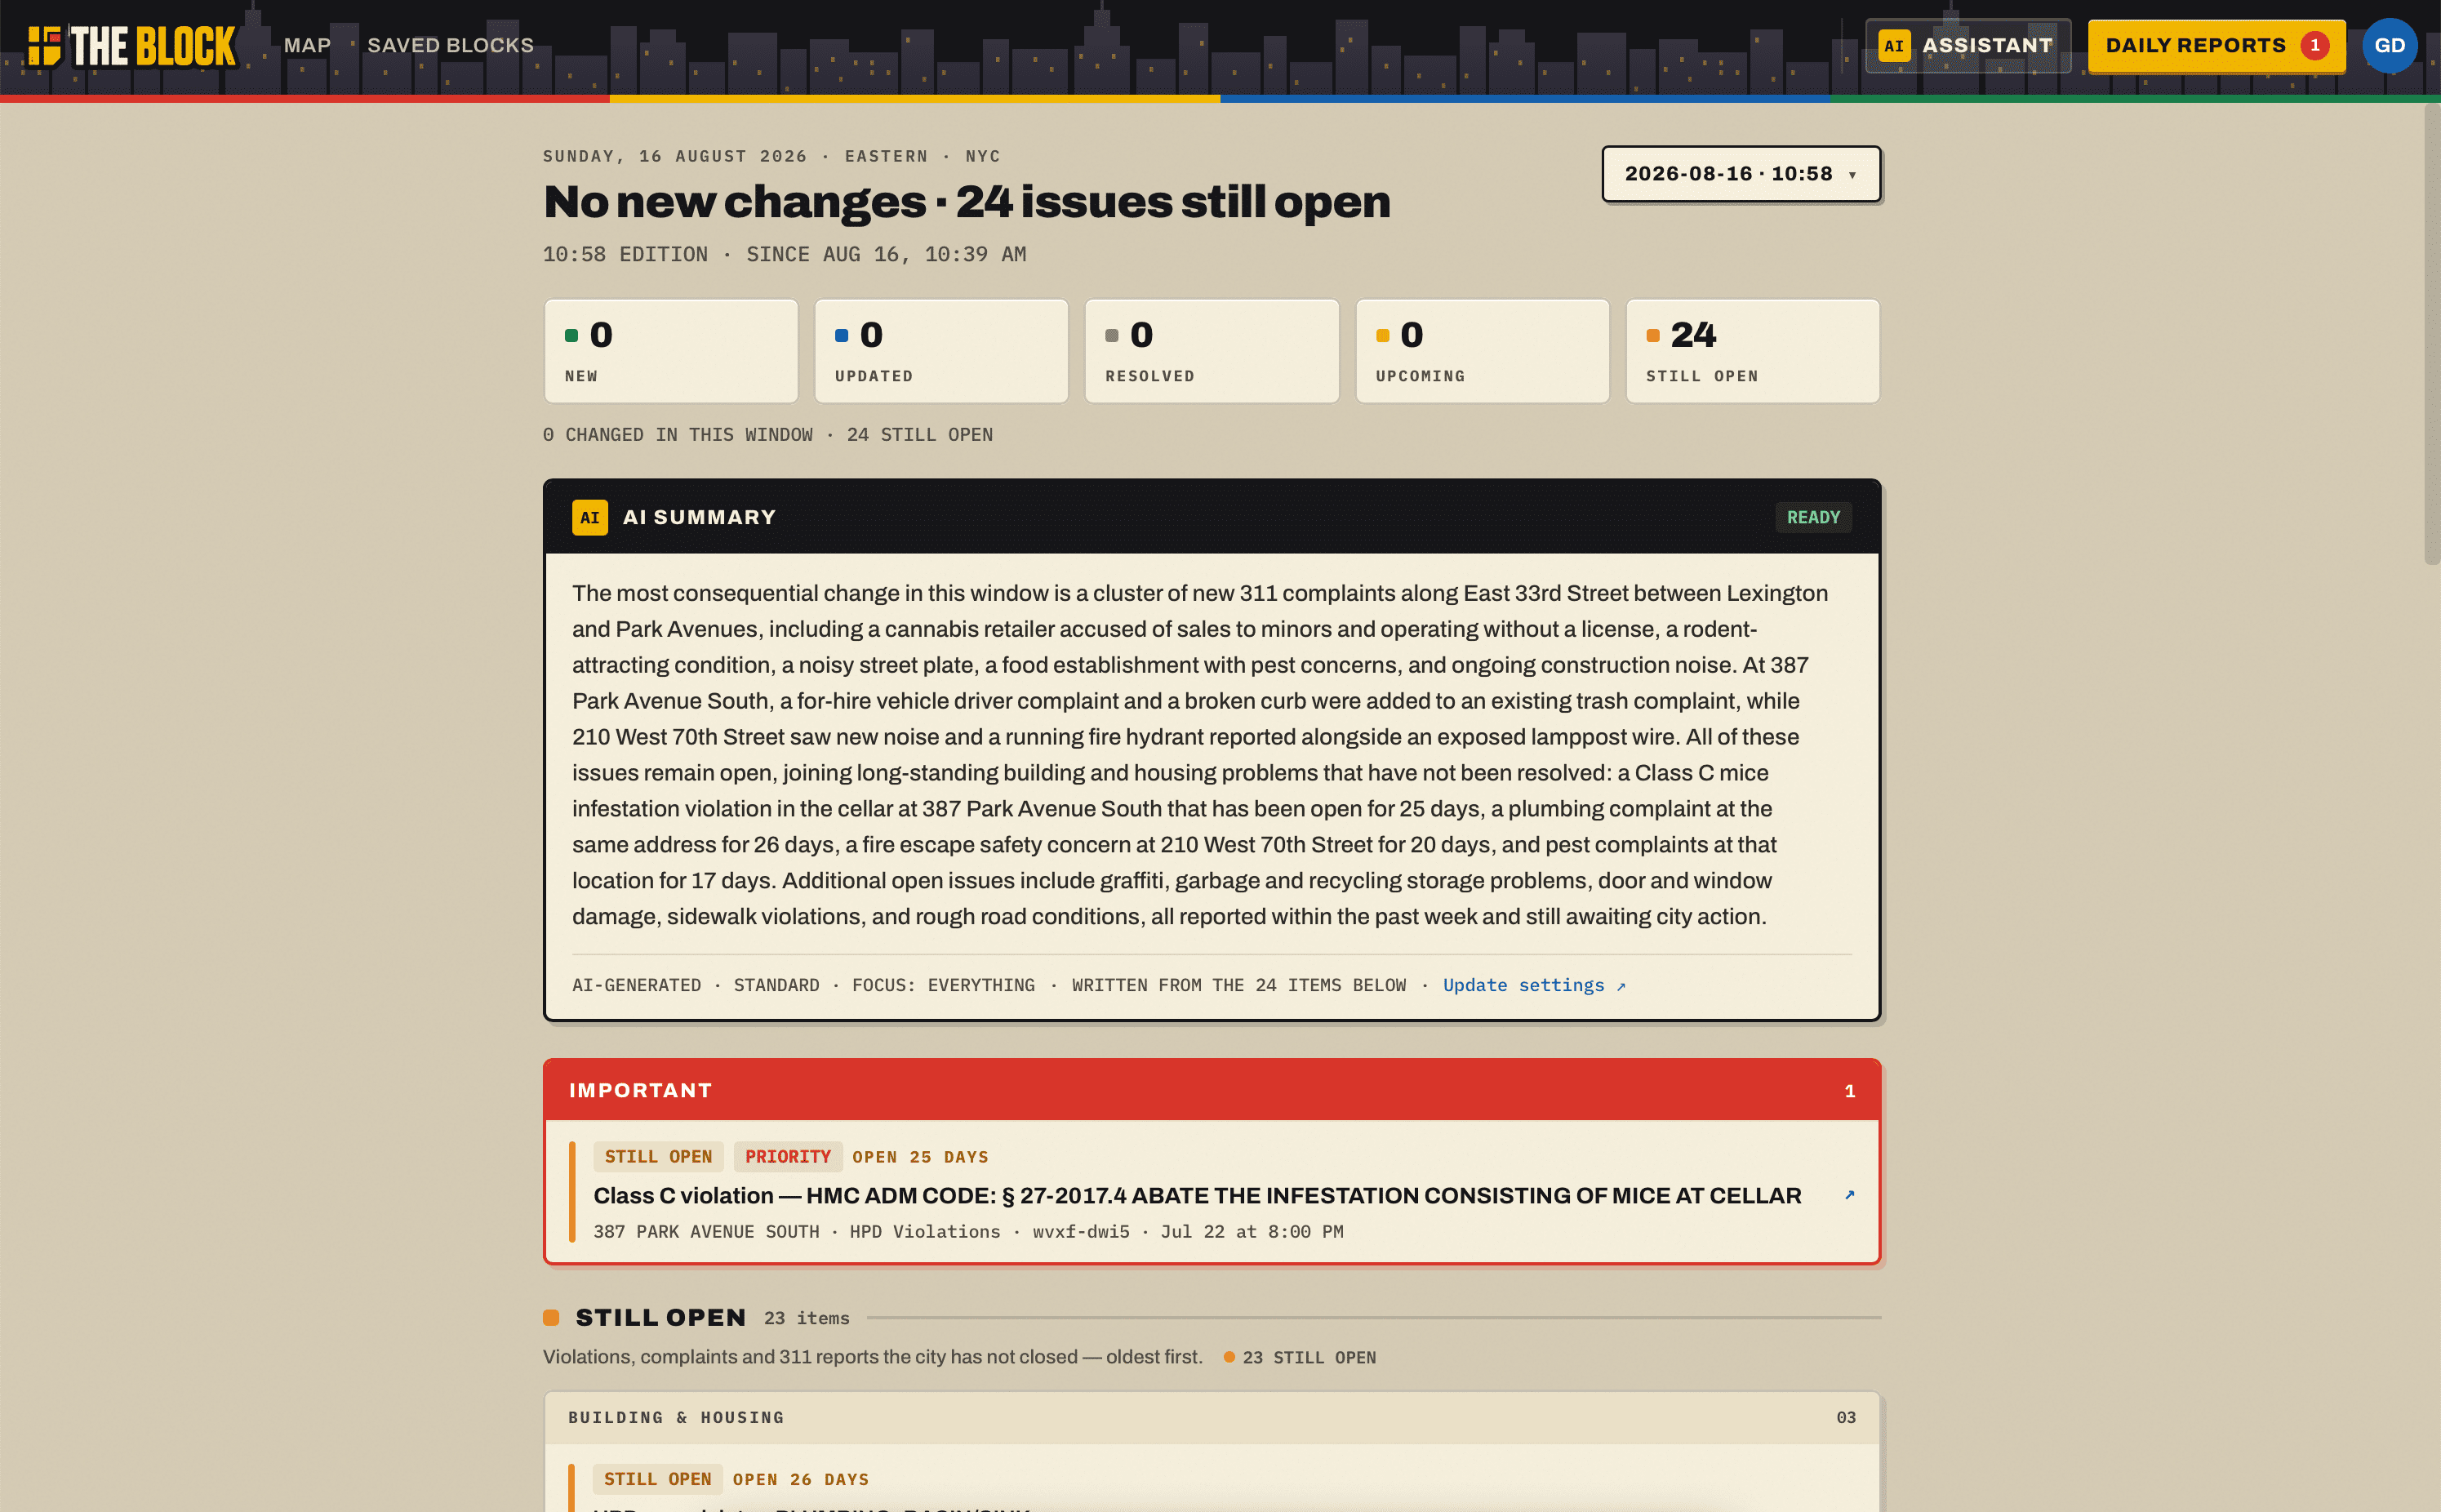
Daily Reports
-
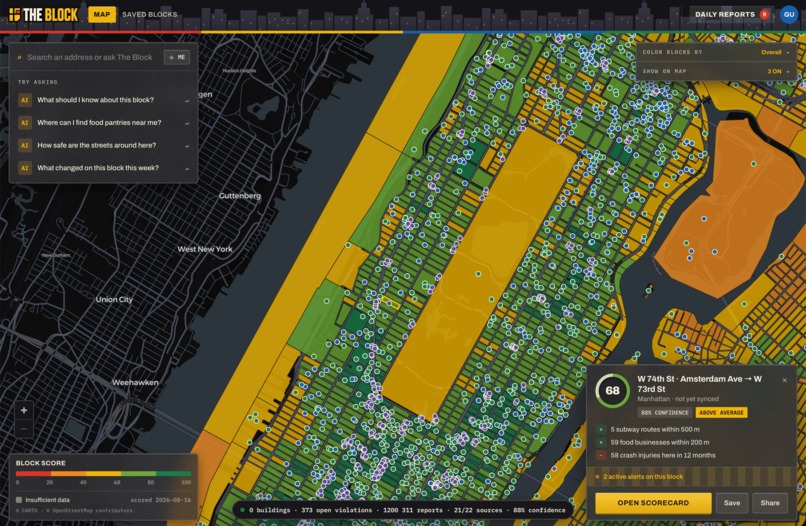
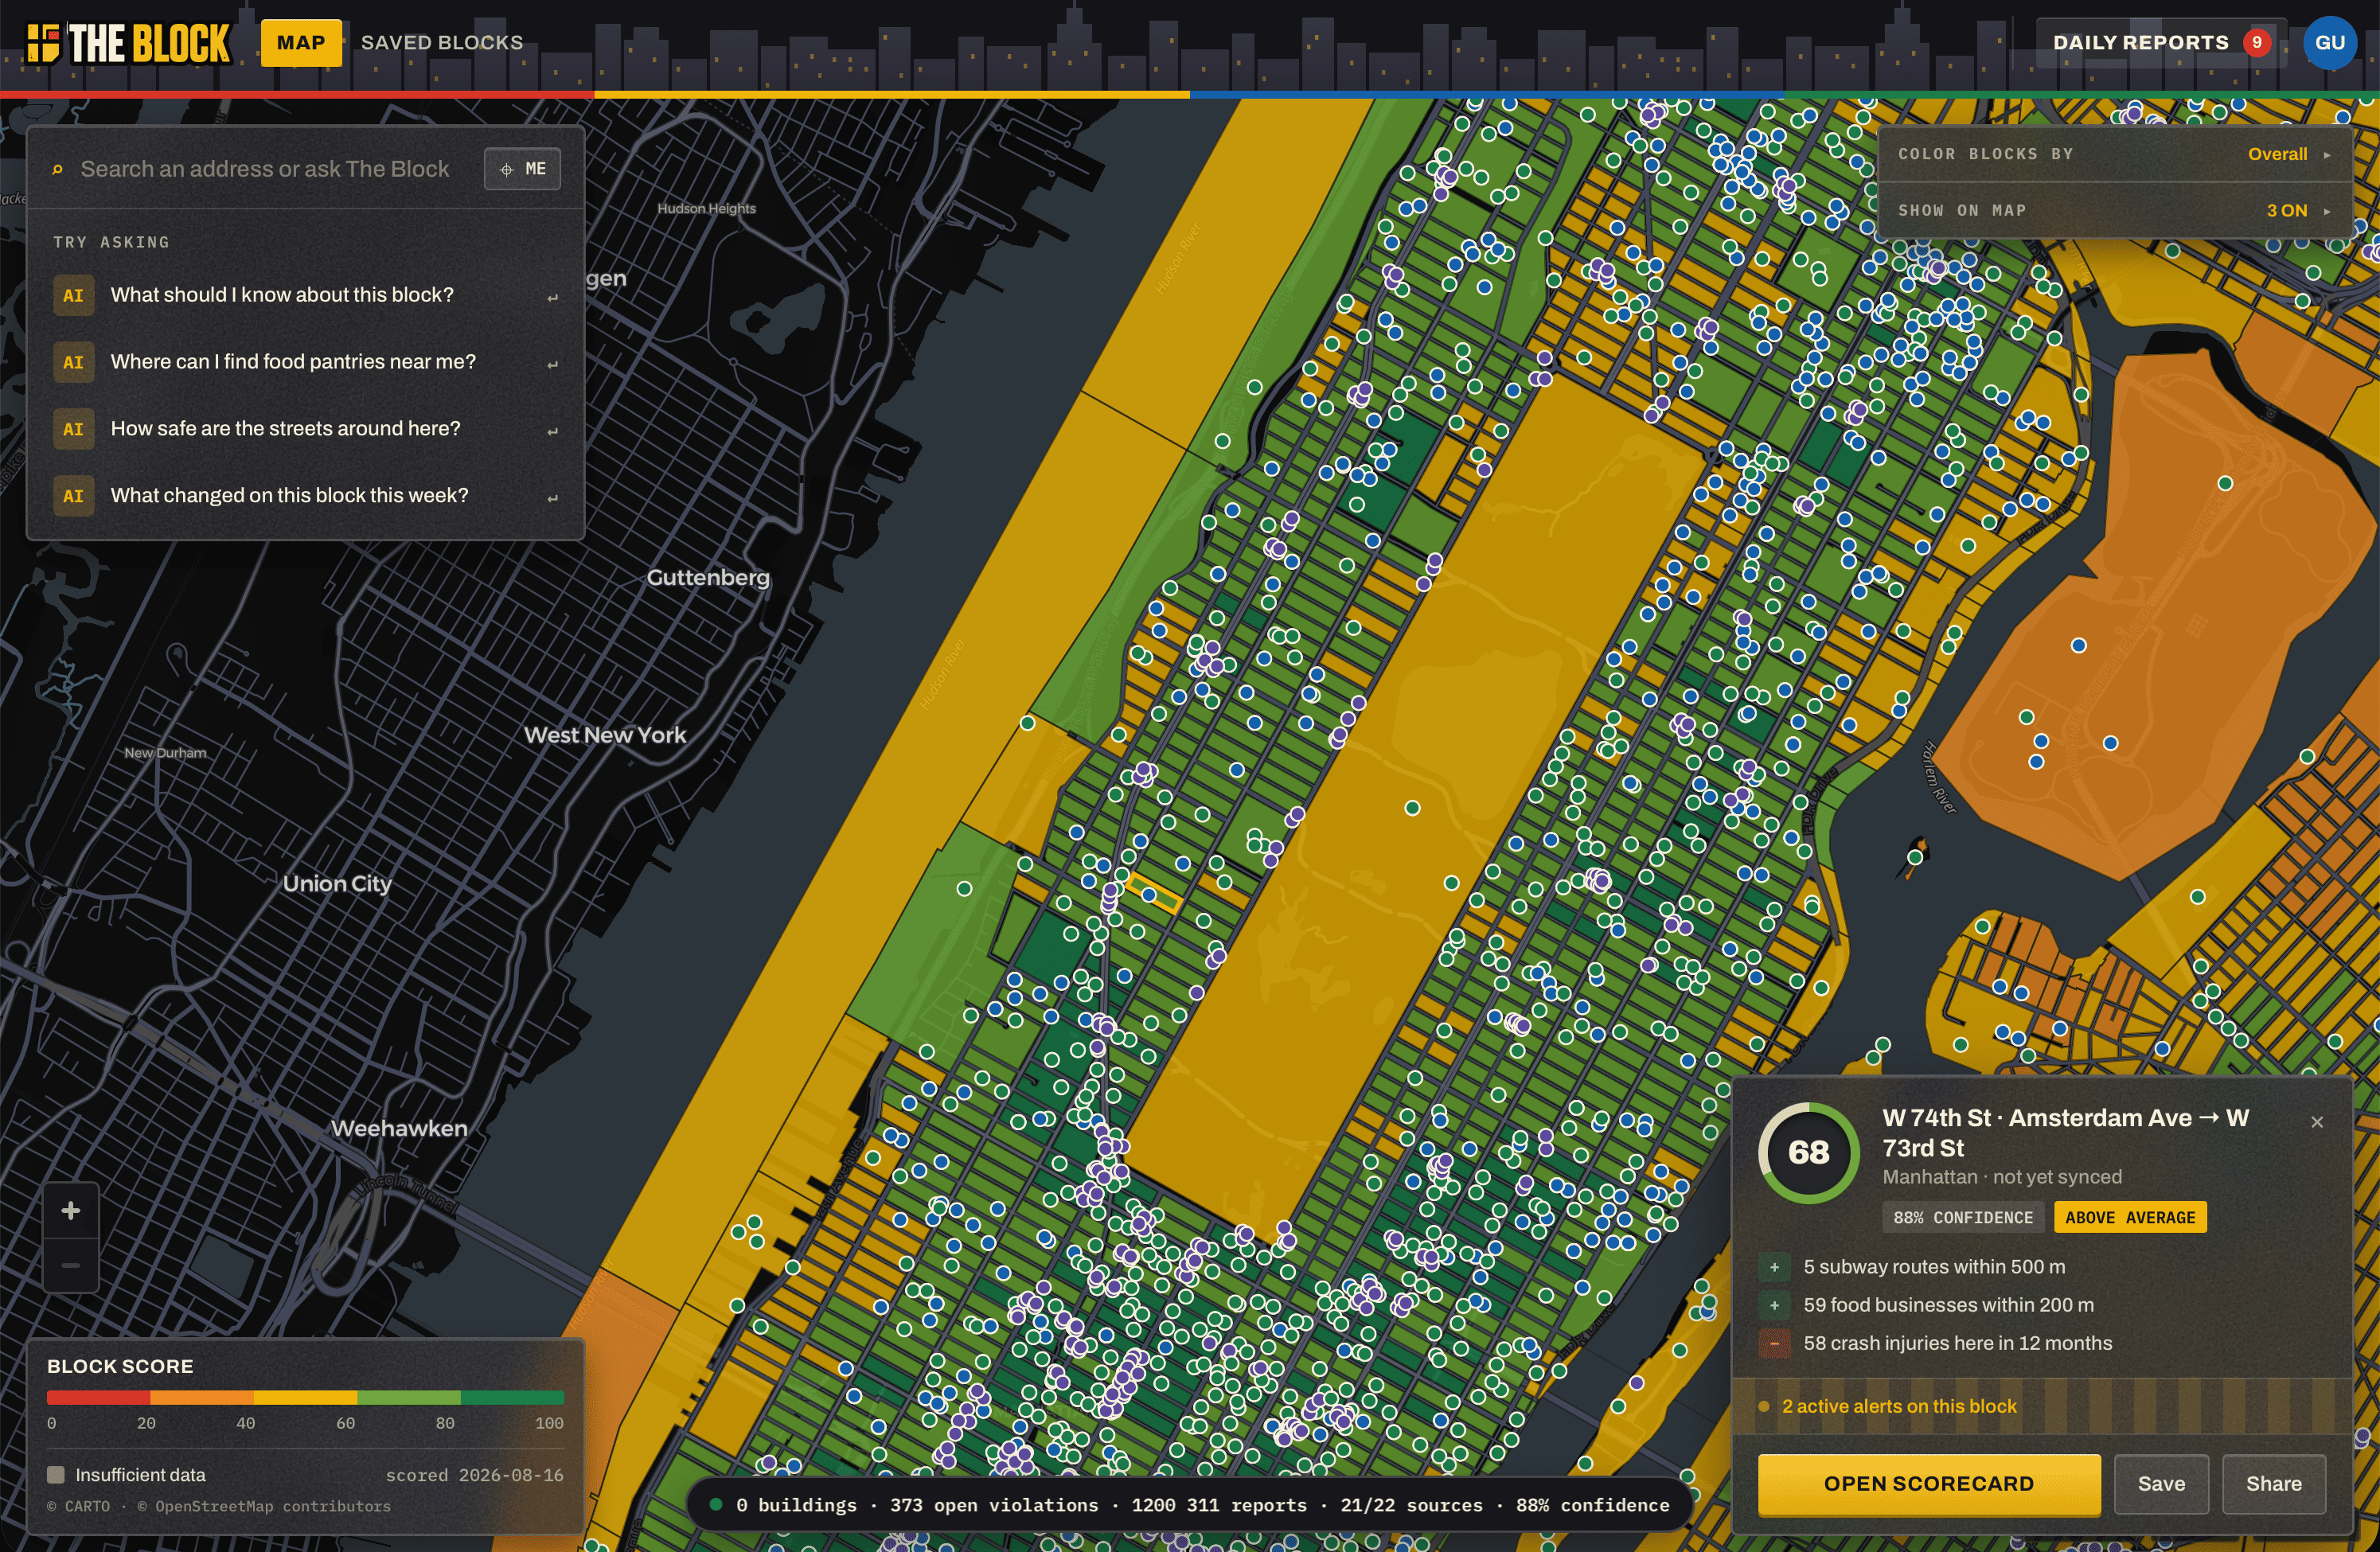
Main Screen
-
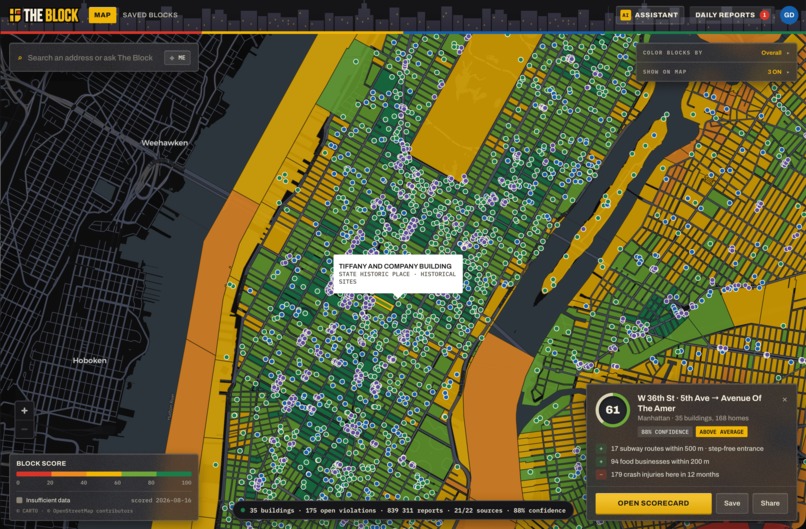
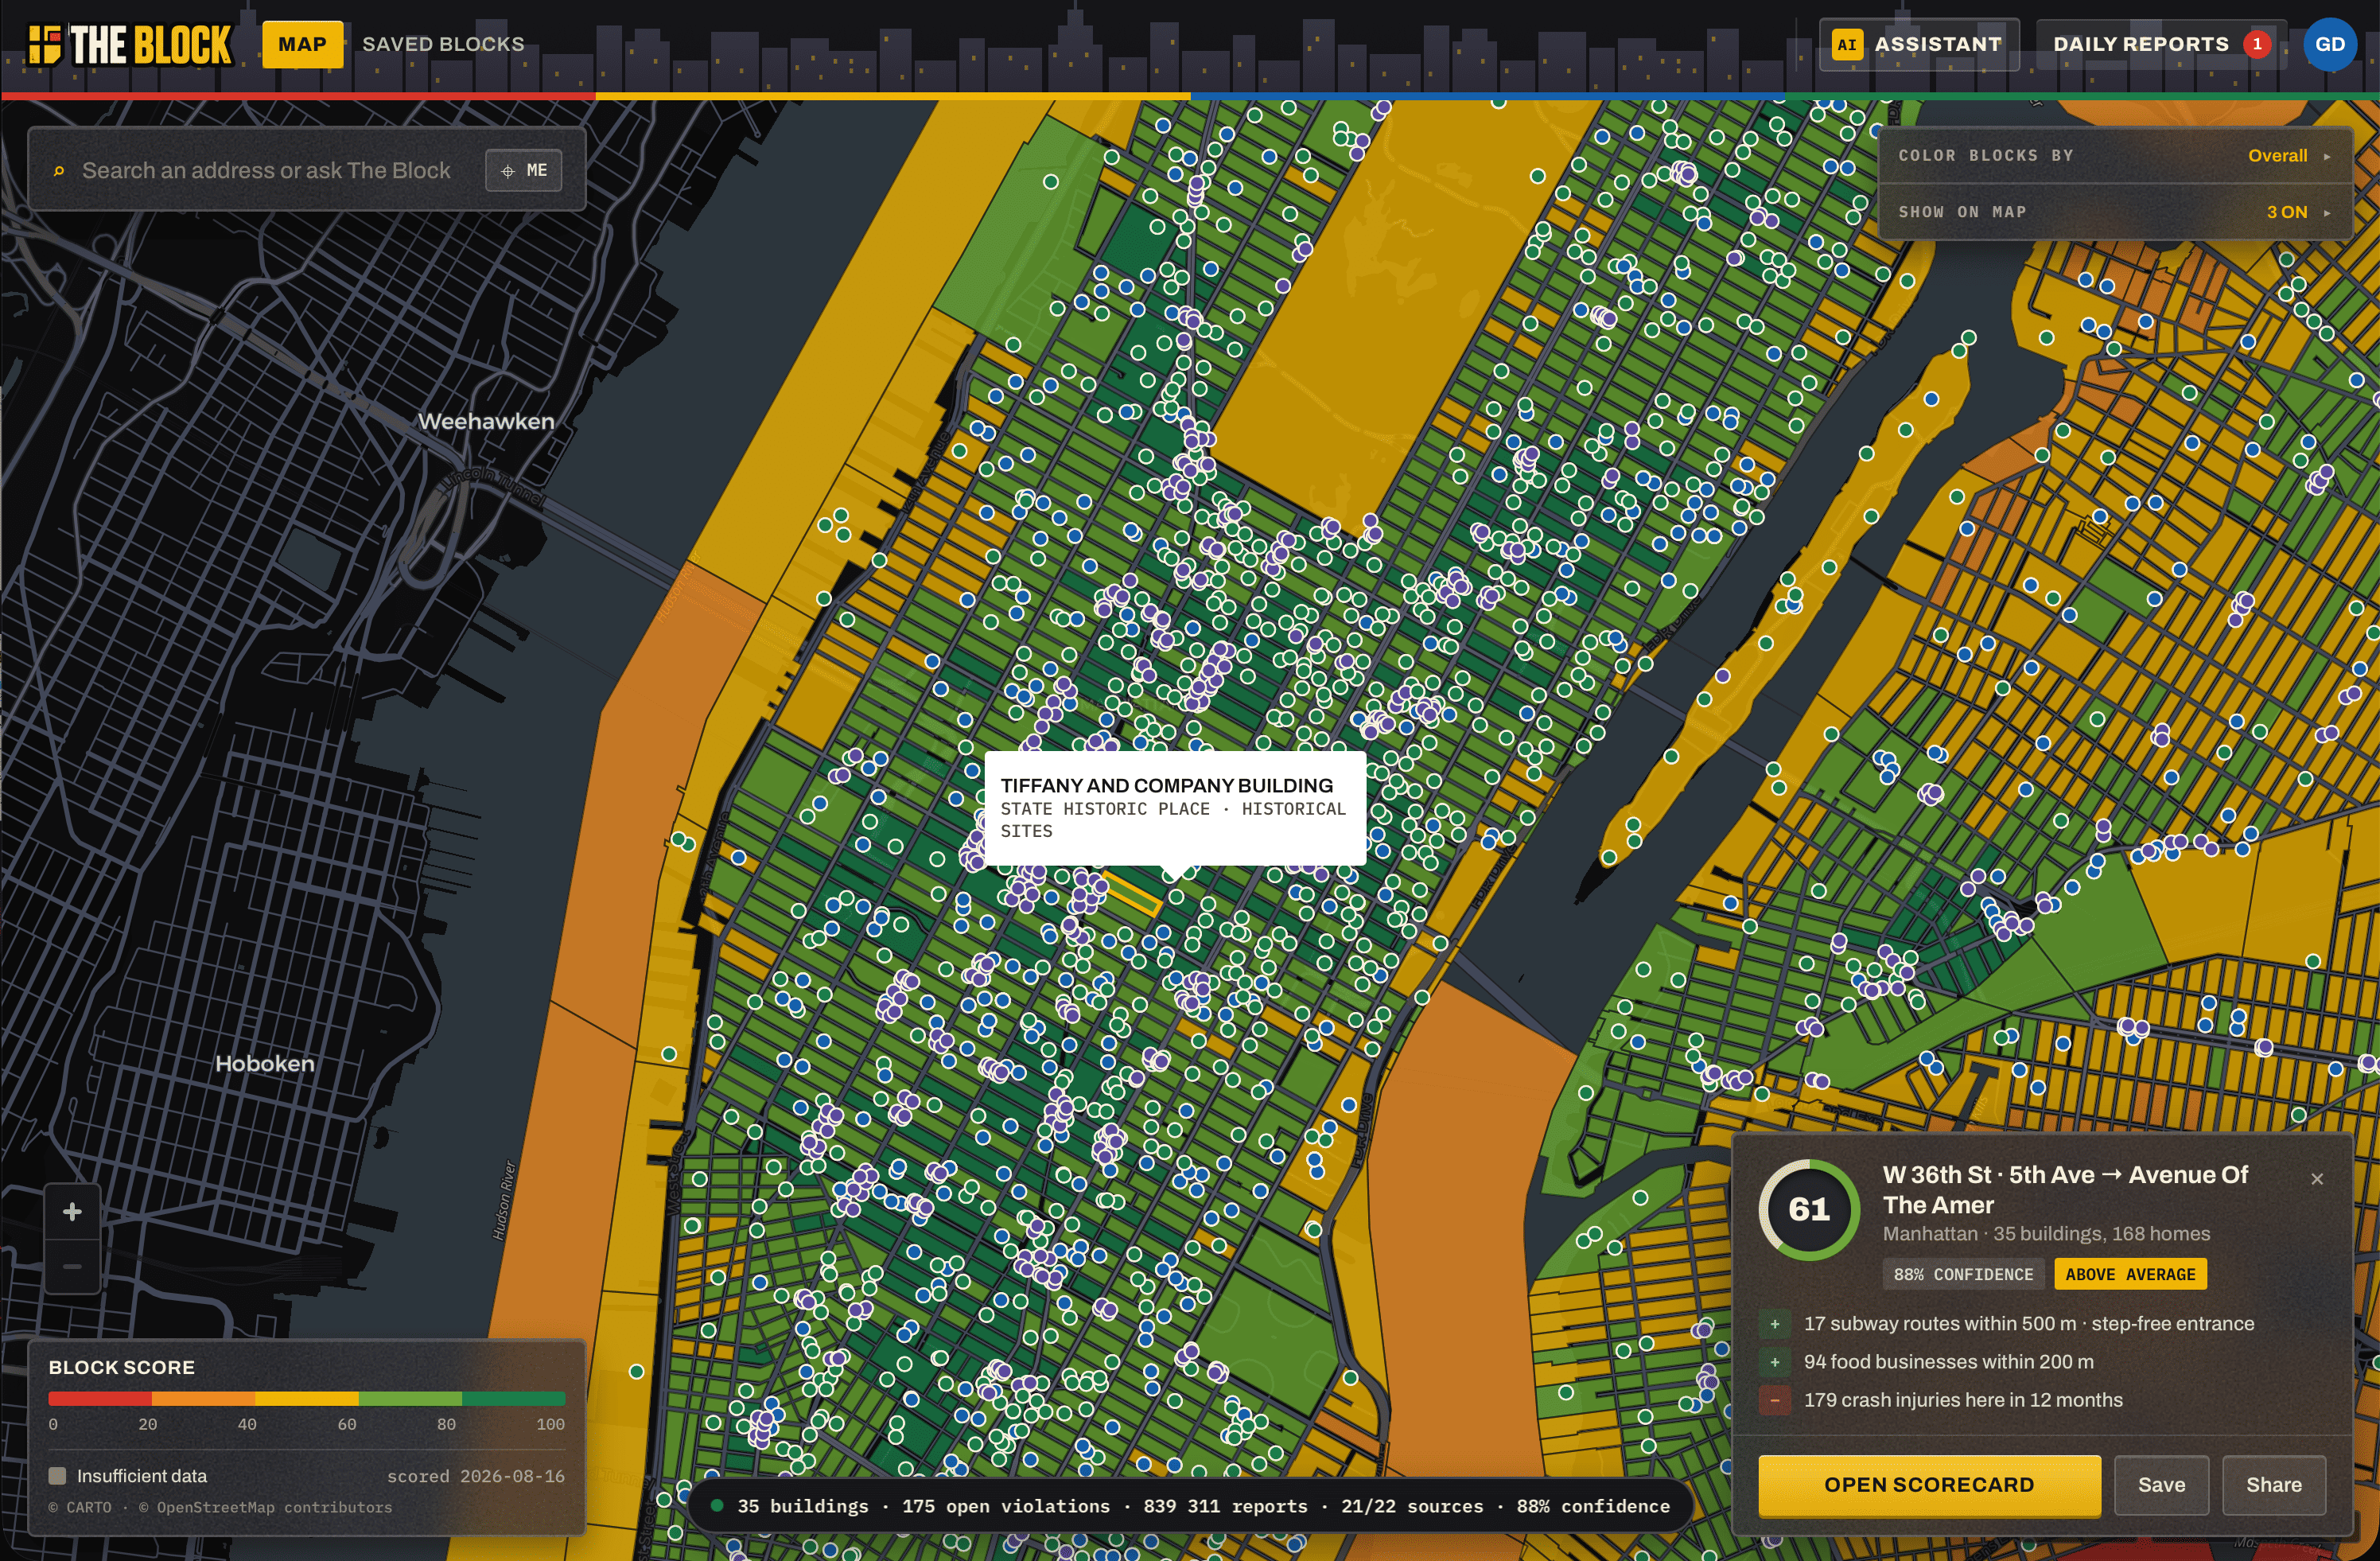
Block Information and Tooltips
-
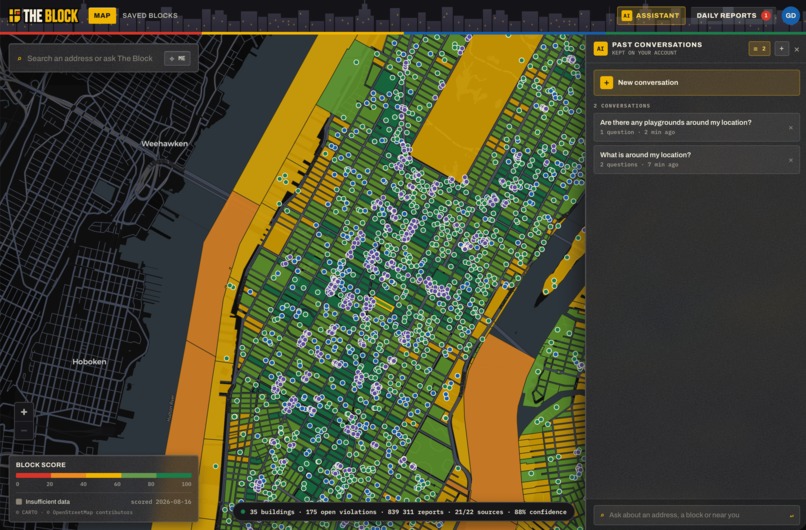
AI Conversations
-
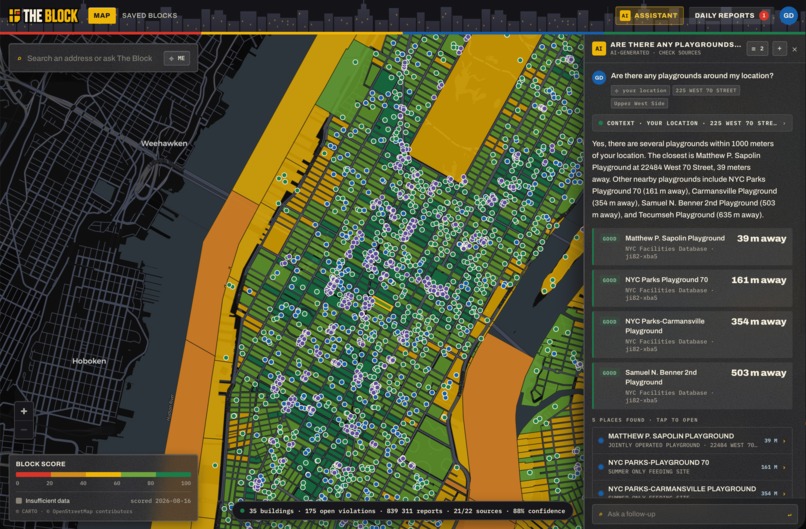
AI Questions
Inspiration
Every block has a story, but learning that story is unnecessarily difficult. When you are deciding where to live, visiting somewhere new, or simply trying to understand your own neighborhood, the information is scattered across dozens of government portals, transit feeds, business listings, community apps, and datasets that most people will never find.
An address tells you where a place is. It does not tell you what daily life there feels like, what services are nearby, what problems have been reported, what is changing, or what the people around it know.
That inspired The Block. We wanted to bring the buildings, services, safety, transit, events, changes, and community behind a neighborhood into one place, with AI to help people understand it all.
What it does
The Block lets anyone explore a neighborhood without creating an account.
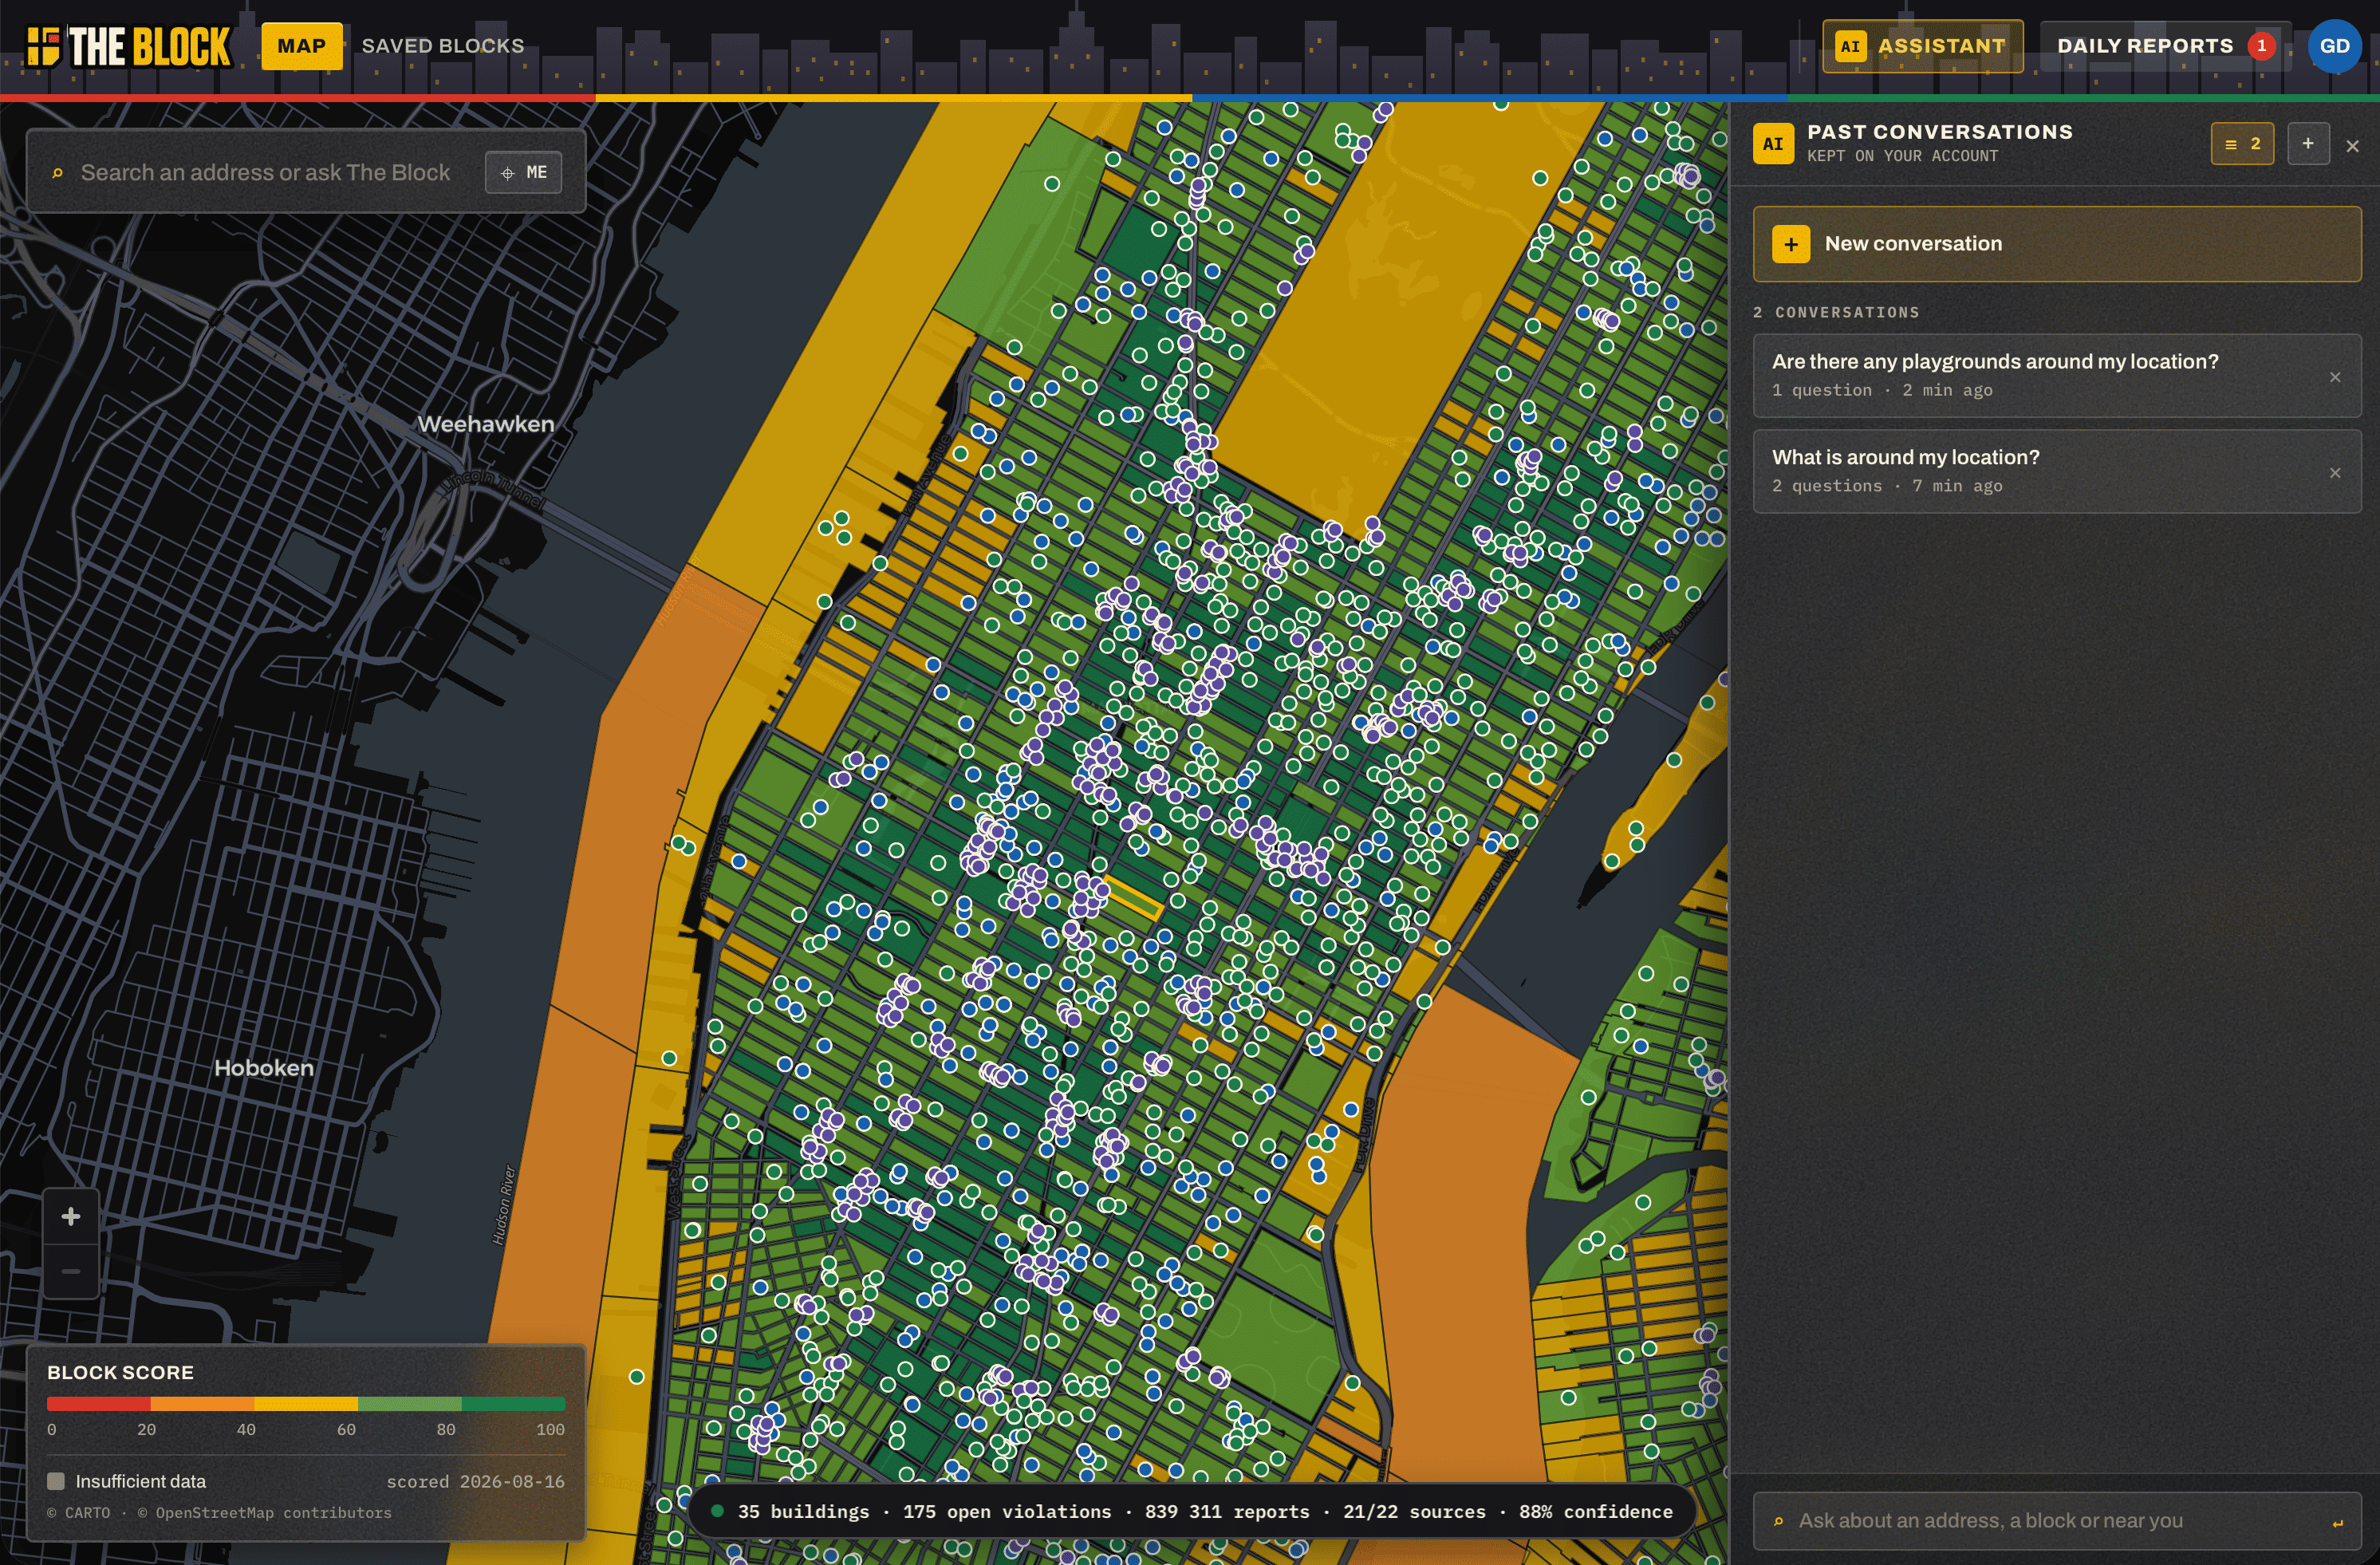
Users can search for an address, block, building, or place and see a clear neighborhood scorecard backed by real sources and publication dates. They can explore housing conditions, building ownership, violations, complaints, restaurant inspections, childcare, parks, food assistance, transit, crashes, 311 reports, local services, events, and many other details.
The Block also includes:
- A citywide view with blocks colored by their ratings
- Separate scores for housing, transit, daily needs, street safety, parks, and family resources
- Building histories with PLUTO, HPD, DOB, rodent, bedbug, and water-tank information
- Nearby services, businesses, parks, childcare, food, recreation, and events
- Current transit, accessibility, weather, and emergency alerts
- Community posts, replies, reactions, and local updates
- Saved blocks, buildings, places, stops, and transit routes
- Configurable in-app reports containing anything new, changed, resolved, active, or upcoming around saved items
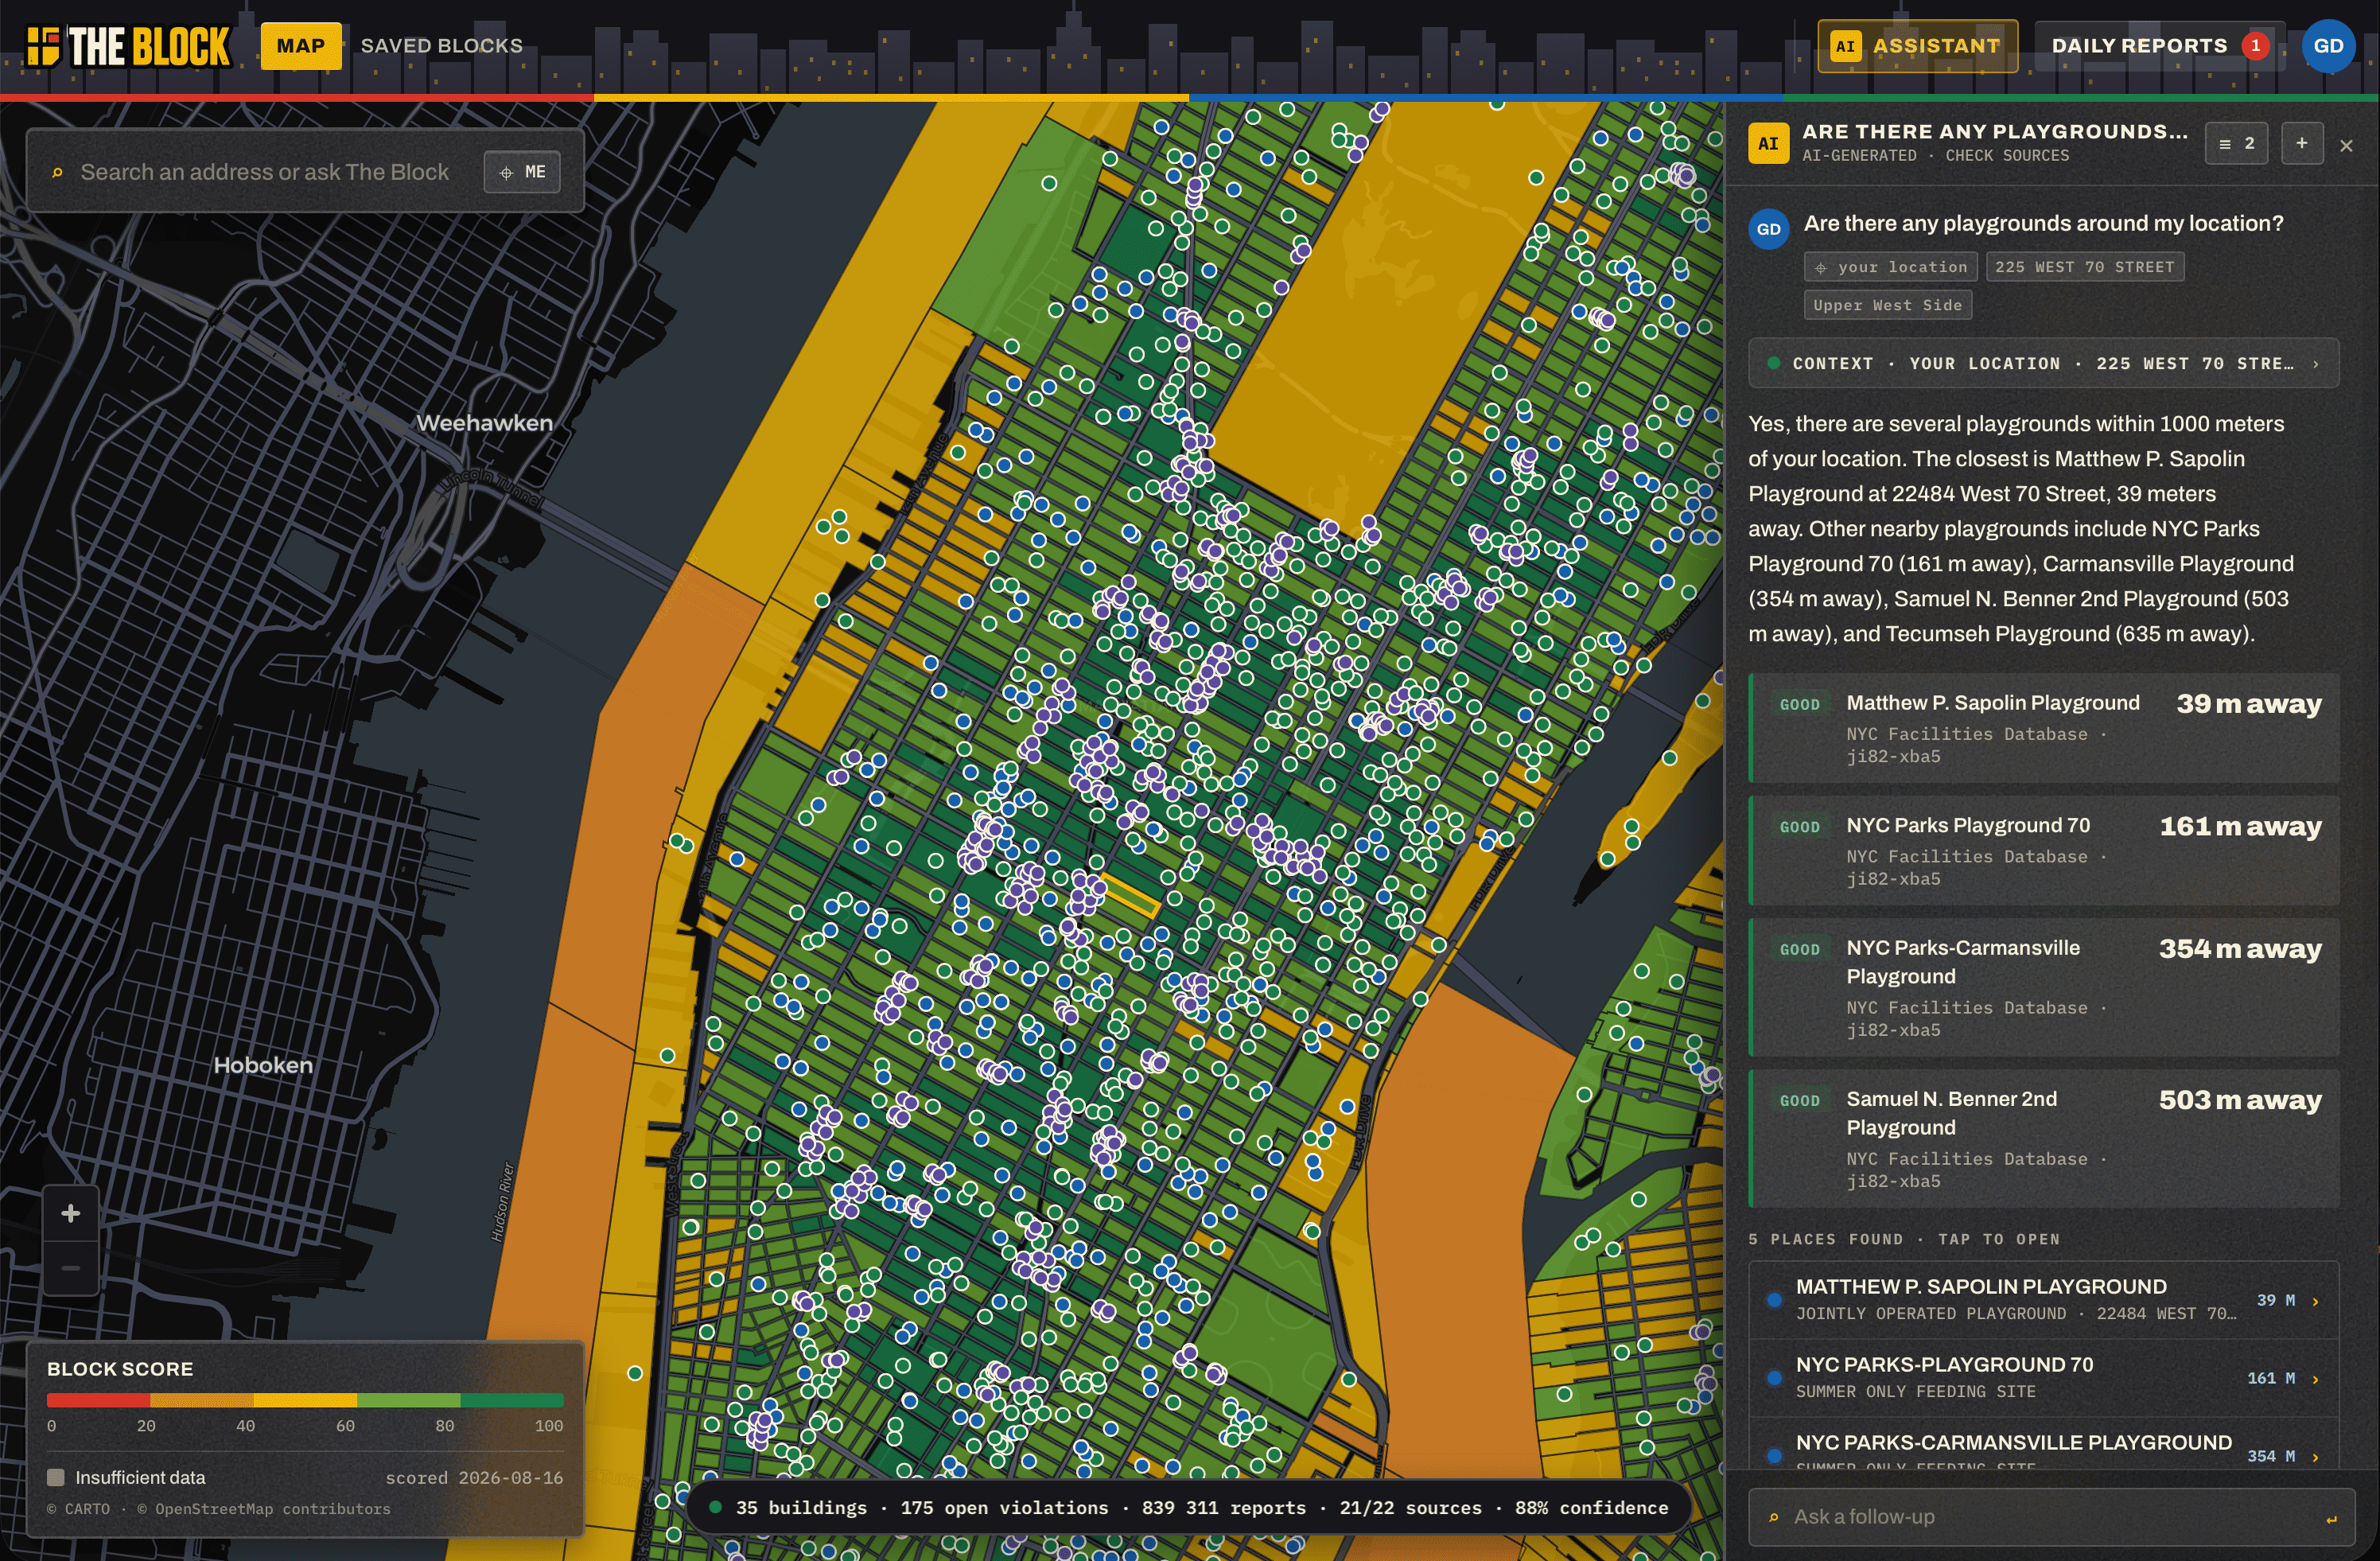
- An AI assistant that can answer questions, compare areas, summarize information, find relevant records, and navigate the application
The goal is simple: help people understand a place before they move, keep up with it once they are there, and discover more of what exists around them.
How we built it
We built The Block in one day as a two-person team using Dyad, Next.js, TypeScript, and Tailwind.
Supabase provides Postgres, PostGIS, authentication, row-level security, realtime community updates, storage, scheduled jobs, and the application backend. MapLibre and MapTiler power the geographic experience, while precomputed PMTiles keep block ratings fast as users move around the city.
Instead of querying dozens of public APIs every time someone opens a page, we designed a slim local mirror. It stores up to three years of relevant records, plus older records that remain open or active. Very large sources, such as parking and camera violations, are stored as block-level aggregates with recent examples.
A reusable source adapter normalizes every dataset into shared geographic and event structures. Records are connected to blocks using BBL, BIN, coordinates, and PostGIS. Meaningful additions, updates, resolutions, and status changes become reusable change events that power scorecards, map layers, saved-item reports, and AI answers.
Block scores are calculated from normalized citywide percentiles rather than arbitrary thresholds. Each score includes its inputs, direction, weight, confidence, source, and date.
For AI, we use OpenRouter with models selected from the admin dashboard, including compatible free models. The AI never receives the full database or unrestricted database access. It uses a small set of validated tools that can resolve locations, query approved sources, compare blocks, retrieve building facts, check transit, summarize a view, and return safe navigation actions.
Challenges we ran into
The biggest challenge was not finding data. It was making dozens of completely different datasets behave like one product.
Every agency uses different field names, identifiers, update schedules, geographic precision, and definitions of what “current” means. Some records belong to an exact building, some to a tax lot, some to a block, and others only make sense within a radius.
Performance was another major challenge. A map that queried public APIs while users moved around would be slow and unreliable. We solved that by separating ingestion from the user experience, mirroring the useful data, precomputing block scores, and serving map tiles that contain everything required to recolor visible blocks instantly.
Scoring neighborhoods also required care. A neighborhood cannot honestly be reduced to one universal number. We made the score transparent, added separate categories and use-case modes, excluded missing data instead of treating it as zero, and showed confidence and source dates.
Finally, we had to keep AI grounded. Community posts and public descriptions can contain unreliable or malicious text, so the model treats retrieved content as evidence rather than instructions. It can only use predefined tools with strict geographic, date, row, and cost limits.
Accomplishments that we're proud of
We are proud that we designed the complete product rather than a disconnected collection of demos.
The same data pipeline powers the map, scorecards, building pages, local changes, scheduled reports, and AI assistant. The application remains useful without an account, while signed-in users gain meaningful personalization and community features.
We are especially proud of the configurable reports. They are not limited to transit. A report can include anything The Block learns about a saved block, building, place, route, or stop, including crashes, bedbug filings, complaints, inspections, closures, events, community updates, and service changes.
We also built the administrative side required to keep the product alive. Data synchronization, retries, schedules, scoring, map publication, AI models, API keys, budgets, and system health can all be managed without manually running database commands.
What we learned
We learned that public data is abundant but rarely designed around the questions people actually ask.
People do not think in dataset names or agency boundaries. They ask whether a building has problems, whether a commute will be disrupted, what their children can do nearby, what changed this week, or whether a neighborhood fits their priorities.
We also learned that AI is most useful here as an interface to verified information. The model should not invent neighborhood knowledge. It should find the right records, explain them clearly, show where they came from, and help the user continue exploring.
Most importantly, we learned that a small reusable architecture can support a surprisingly large product when every component shares the same block identity, source registry, evidence format, and change pipeline.
What's next for The Block
Next, we want to complete and validate every source connector against live production data, refine the score weights with residents and domain experts, and improve how uncertainty and publication delays are communicated.
We also want to deepen route intelligence, improve community moderation, support more personalized score profiles, and make reports even better at separating urgent changes from everyday neighborhood activity.
NYC is the starting point because of its extraordinary public-data ecosystem. The architecture is designed so another city can be added through new source adapters without rebuilding the application.
The long-term vision is for The Block to become the place people use whenever they want to understand where they are, where they are going, or where they may live next.
Built With
- dyad
- openrouter
- postgresql
- supabase
- tailwind
- typescript
- vercel

Log in or sign up for Devpost to join the conversation.