Inspiration
As epidemiologists, we were interested in causal inferencing and the relationship between population travel movements and respiratory illnesses, such as COVID-19, Influenza, and Pneumonia.
What it does
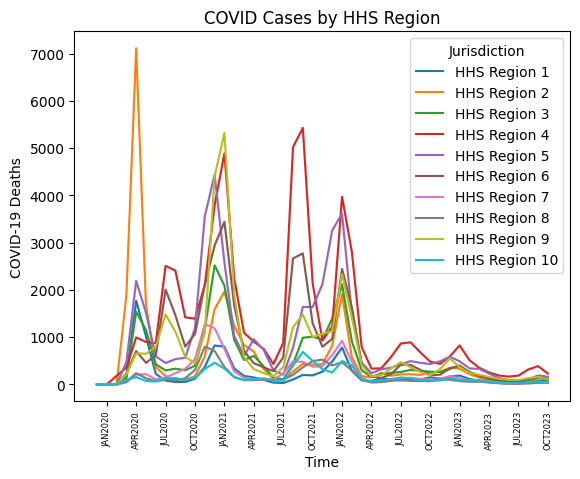
We created an animation representing a time-series POV of the United States representing total deaths from illnesses. Also, we conducted a TSA to determine whether any gap in time showed any unique effects.
How we built it
We constructed the animation using Plotly and the Time-Series using R-Programming.
Challenges we ran into
Data Wrangling was certainly an issue. We had to handle over a couple of thousand NA values. Additionally, we had to use custom format dates in order to adjust for time properly.
Accomplishments that we're proud of
We were able to complete it within 24 hours!!
What we learned
We learned that under a great deal of pressure, working together (and asking for help from mentors) built resilience.
What's next for The association between Traveling and Respiratory Diseases.
We hope to maybe do aa COX / Survival analysis.

Log in or sign up for Devpost to join the conversation.