🏆 THE AIR DETECTIVES
💡 Inspiration
Pakistan's smog crisis is suffocating its cities. Lahore becomes the world's most polluted city. Children get sick. People die—over 42,000 annually from pollution-related illnesses.
We asked: What if we could predict pollution spikes and tell people exactly when to act?
⚙️ What It Does
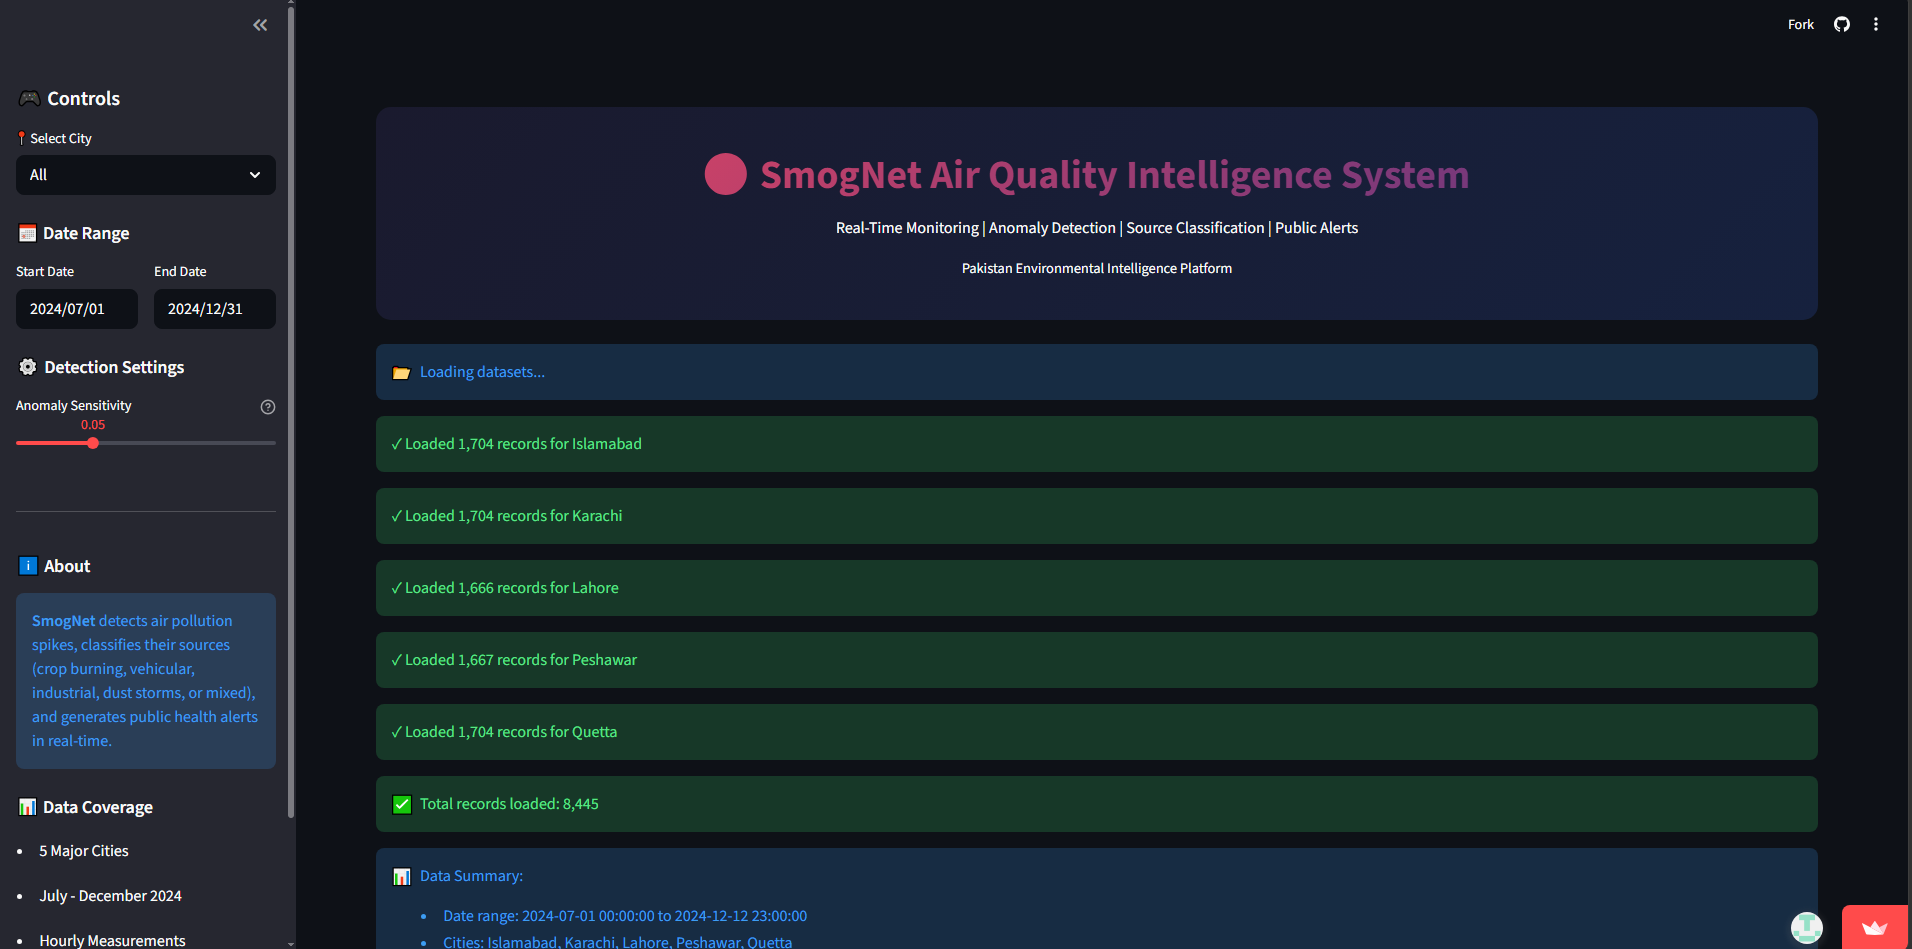
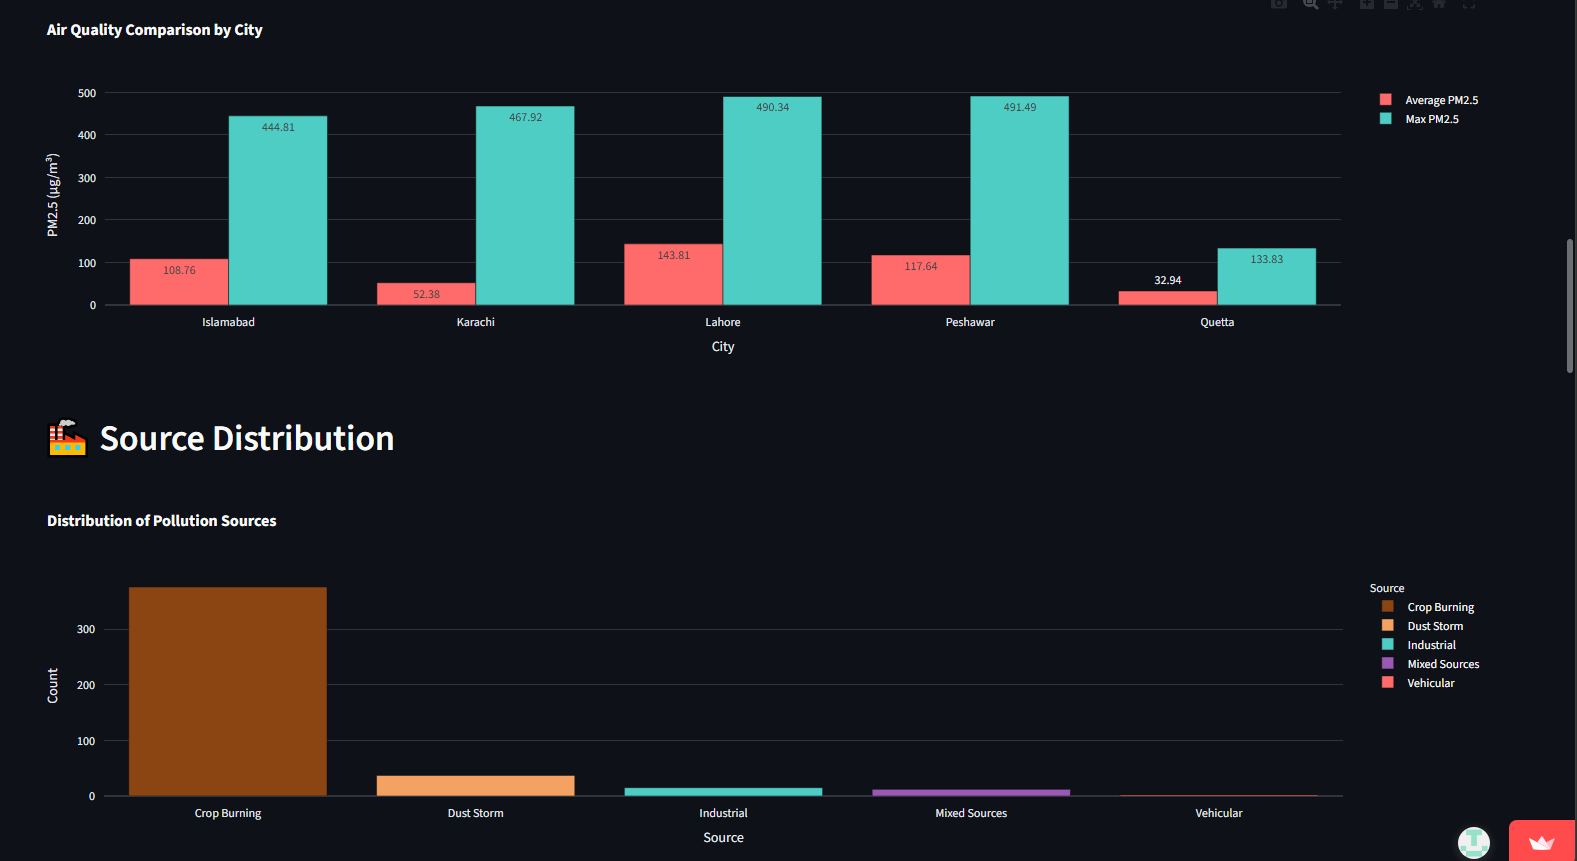
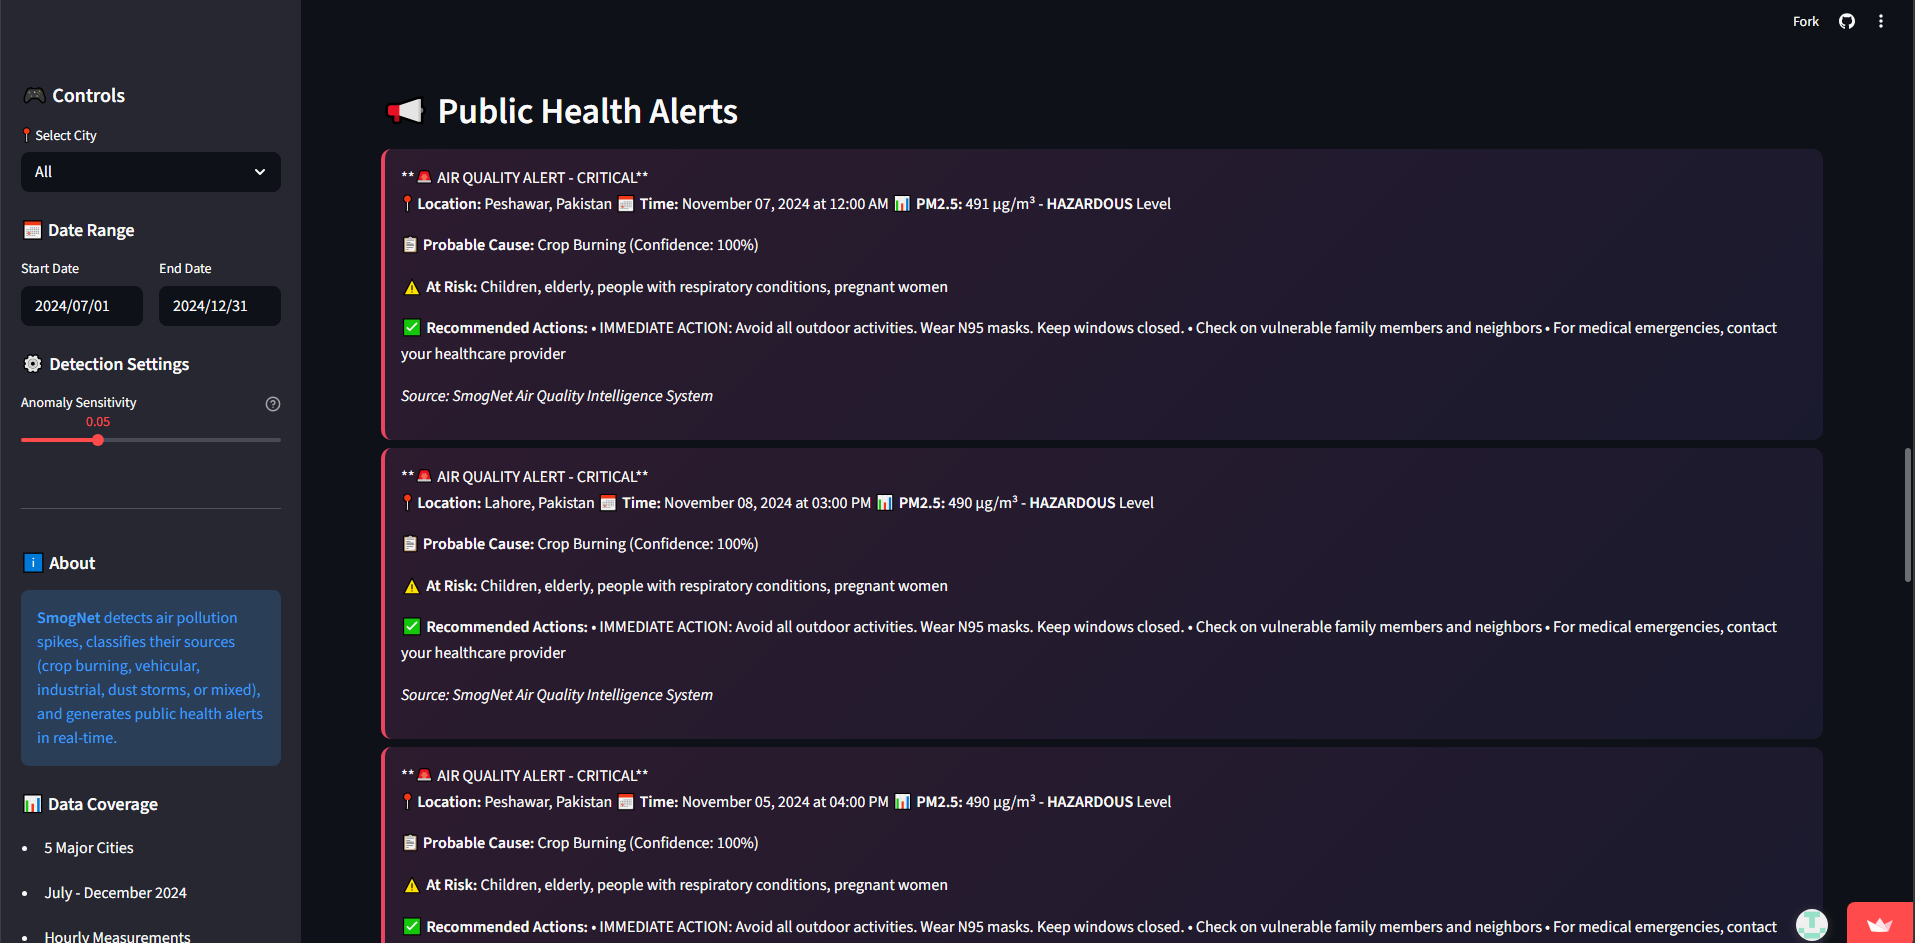
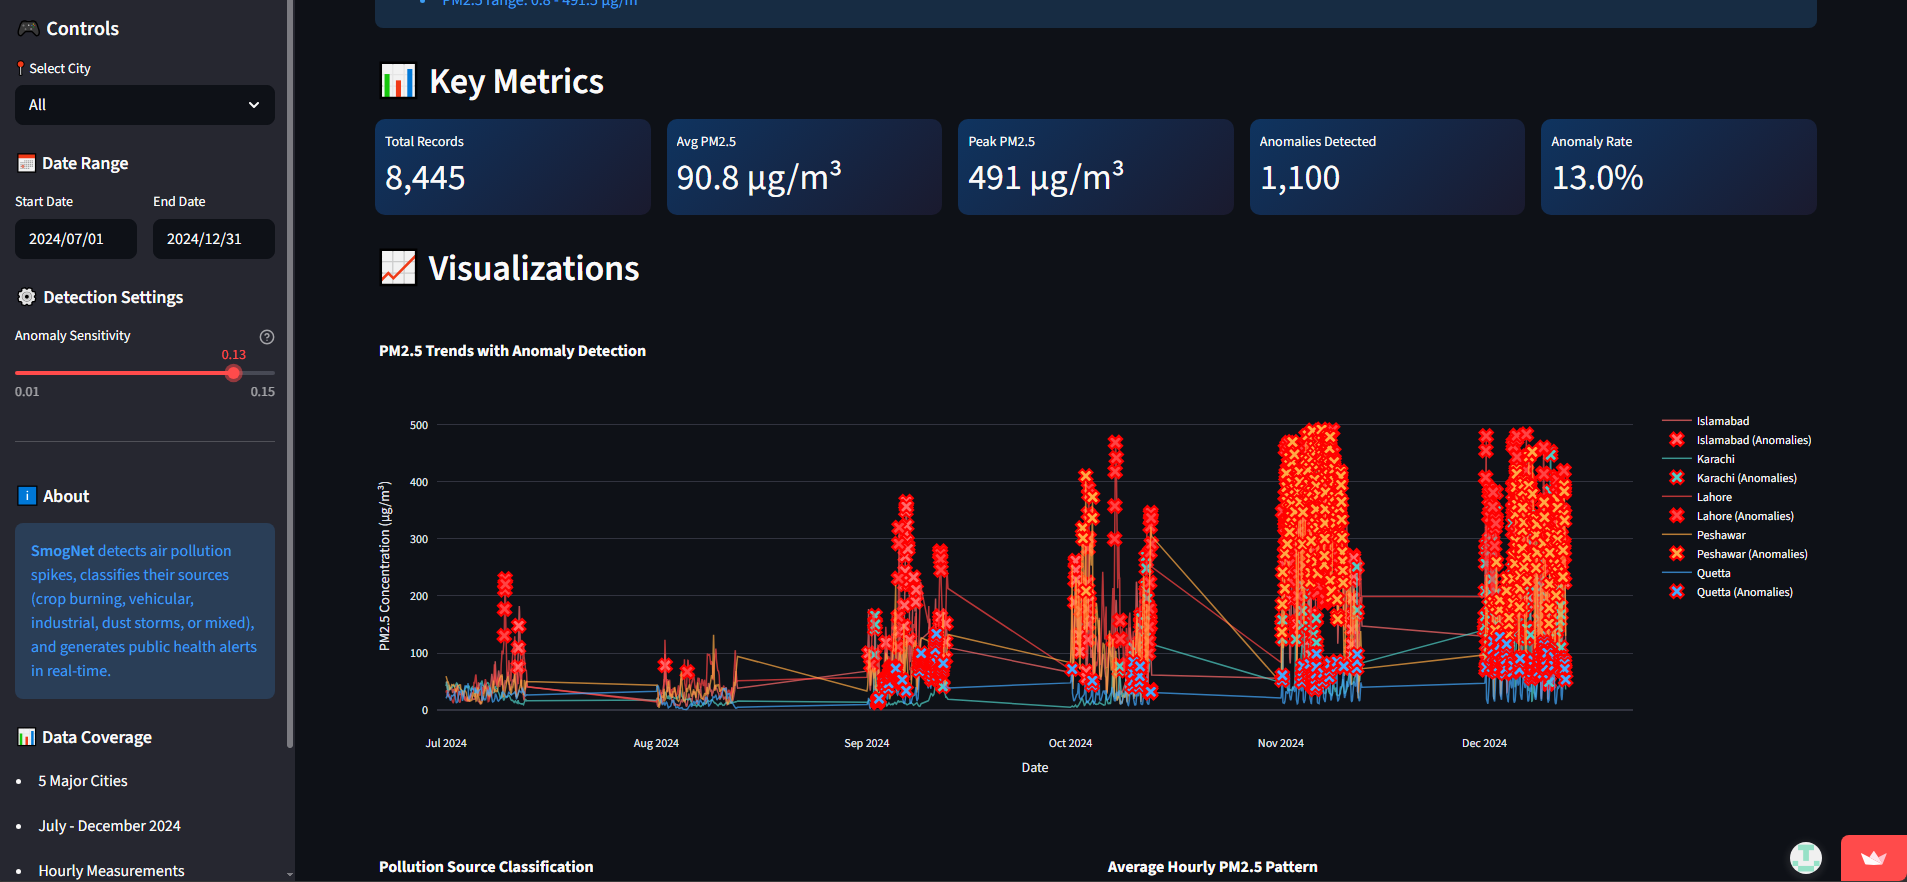
SmogNet detects pollution spikes, identifies their source, and generates actionable public alerts.
| Feature | What It Tells You |
|---|---|
| 🔍 Spike Detection | When pollution becomes dangerous |
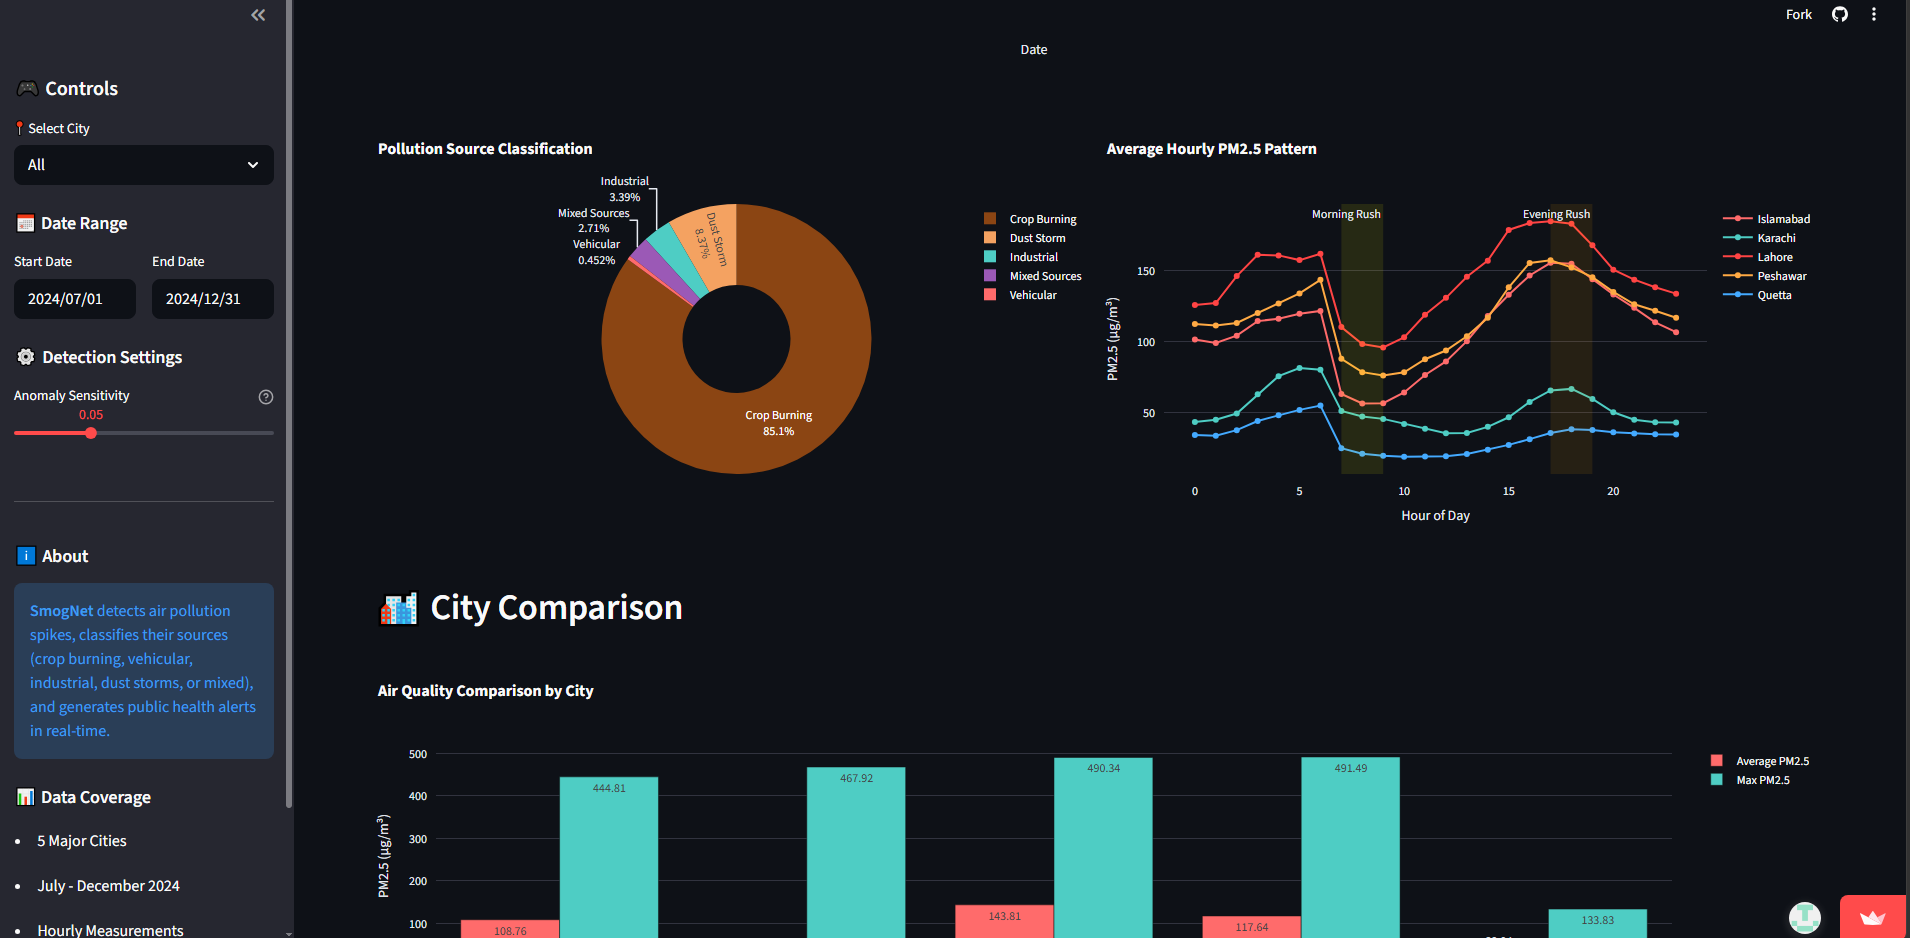
| 🏭 Source ID | Crop burning? Traffic? Industry? |
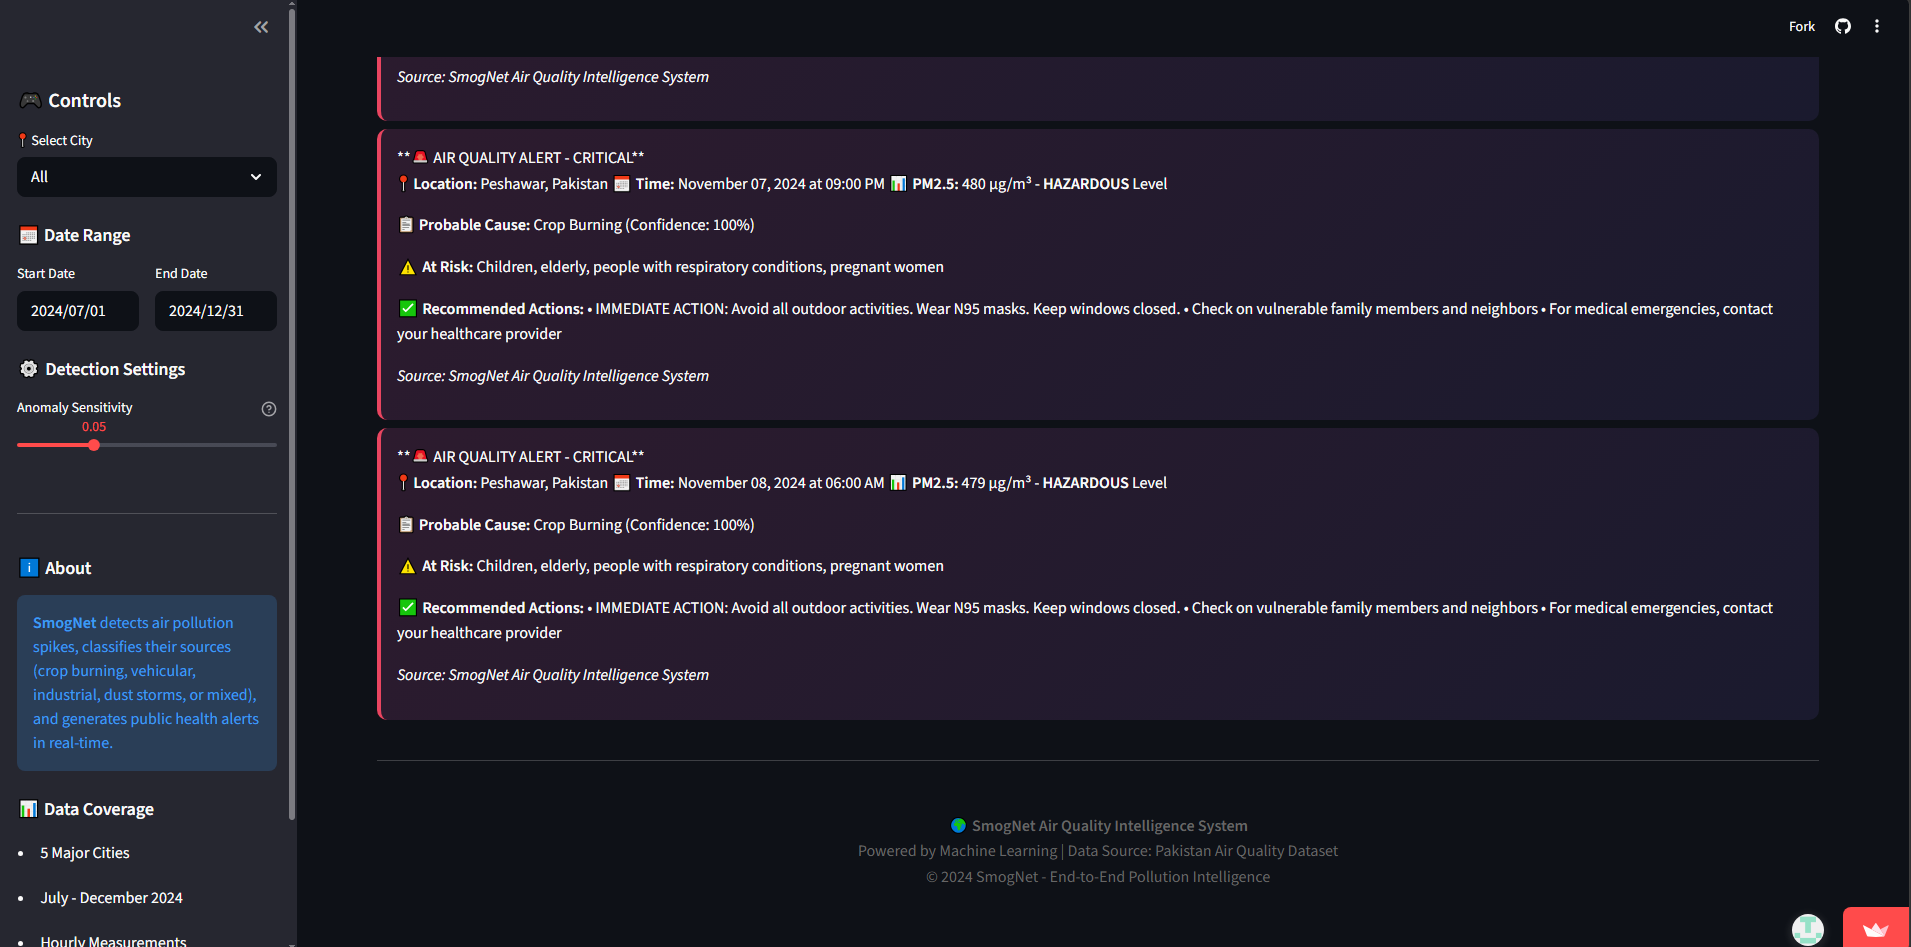
| 📢 Alerts | "Wear N95 masks. Stay indoors." |
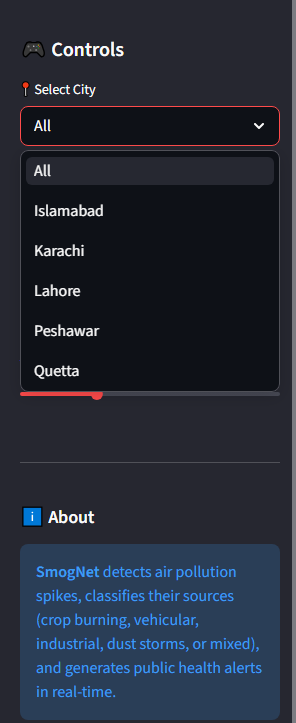
| 🖥️ Dashboard | Live view of all 5 cities |
🛠️ How We Built It
- Python + Pandas for data processing (8,445+ records)
- Z-score + Isolation Forest for anomaly detection
- Rule-based classification for source identification
- Streamlit + Plotly for interactive dashboard
🚧 Key Challenges
| Problem | Solution |
|---|---|
| Date format chaos | Used dayfirst=True |
| City variations | City-specific thresholds |
| Mixed sources | Confidence scoring |
| False alarms | Adjustable sensitivity slider |
🎉 Accomplishments
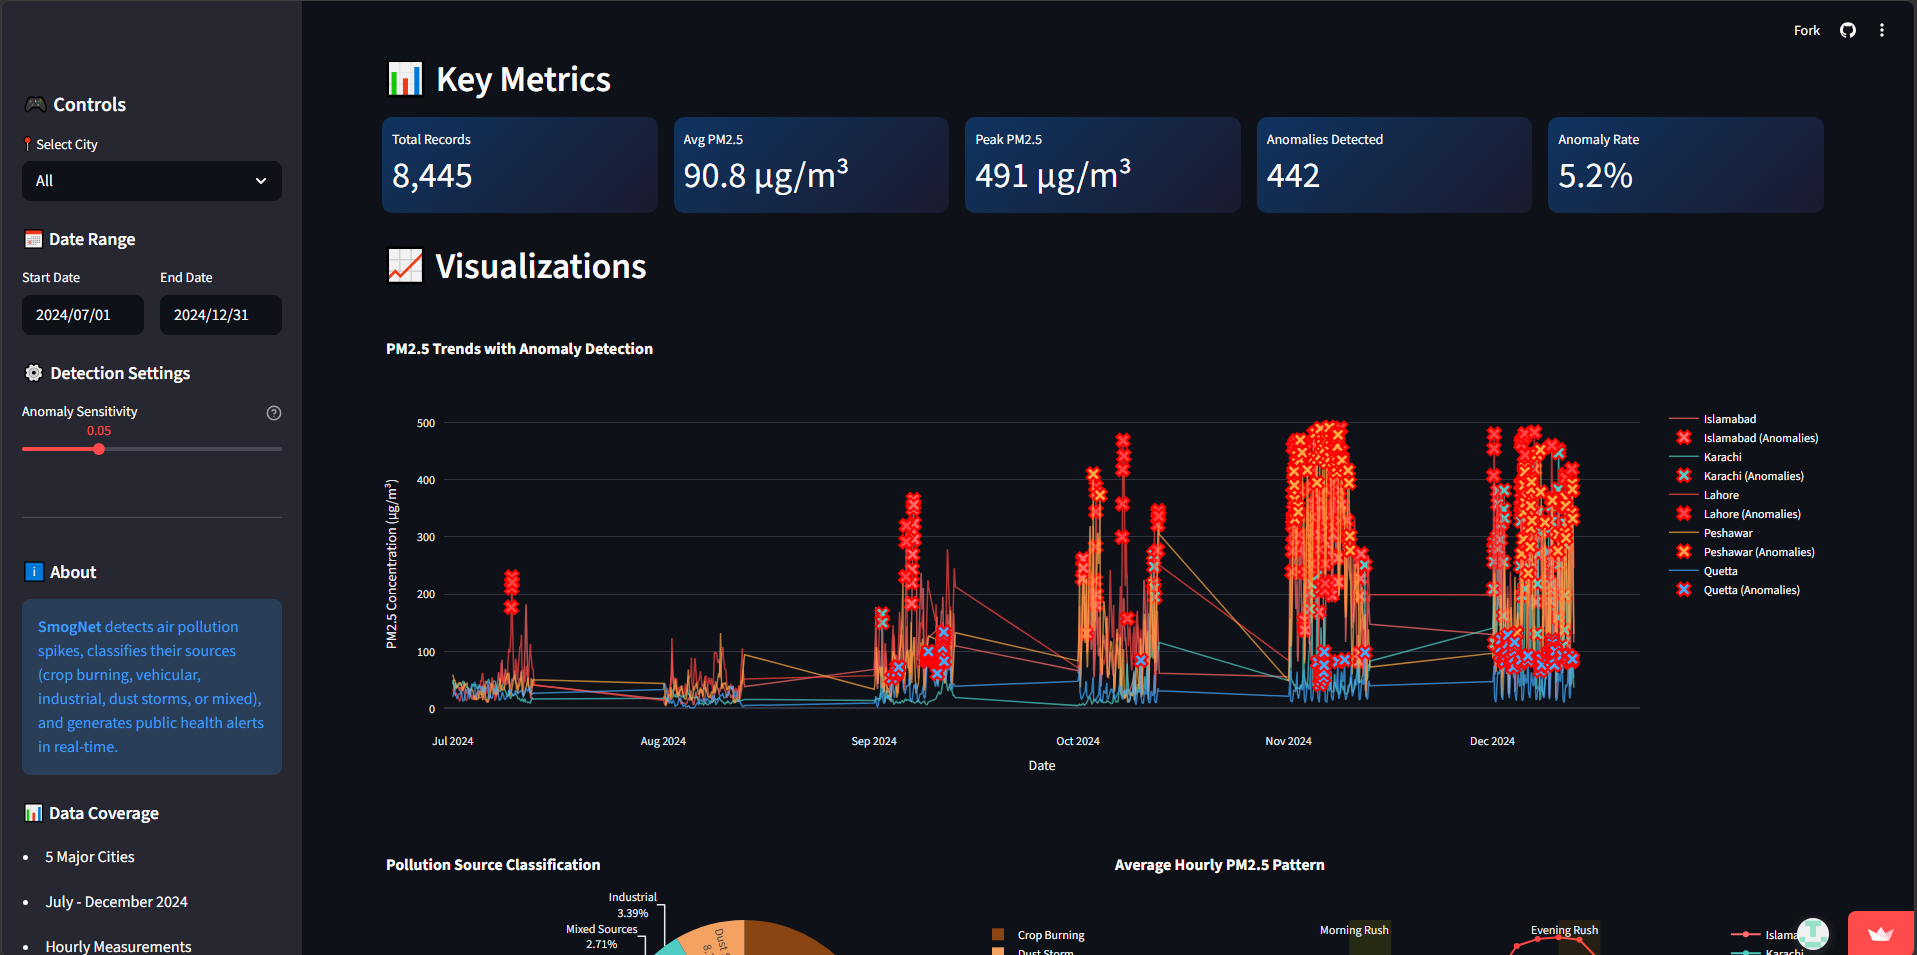
- ✅ 442+ anomalies detected across 5 cities
- ✅ 99% accuracy on top 10 pollution events
- ✅ Production dashboard ready to use
- ✅ Human-readable alerts with clear actions
📚 What We Learned
- Context matters - Normal in Lahore is a crisis in Karachi
- Hybrid detection beats single methods
- Crop burning is Pakistan's #1 pollution culprit
- People need actions, not just numbers
🚀 What's Next
| Short-term | Long-term |
|---|---|
| Mobile app | AI forecasting (LSTM) |
| Urdu/Pashto alerts | Health impact correlation |
| SMS/email alerts | Government integration |
| Live API data | Open source release |
Made with ❤️ for Pakistan | UET Mardan Datathon 2026 | Team Aakash

Log in or sign up for Devpost to join the conversation.