IS MY BLOCK CURSED?
1. STATUS QUO
When a New Yorker sees a rat, they call 311. The city opens a ticket. At some point, that ticket gets closed. The system exists, it runs every day, and nobody has checked whether the closing is actually keeping up with the calling.
We looked at 51,000 rodent complaints and 158,000 restaurant inspection records from January 2025 to today. We did not build a rat map. We asked one question: when someone calls for help, does the city close the loop?
The answer is: it used to. It doesn't anymore.
2. THE THREE GAPS
GAP A: The Closure Gap Is Growing Fast
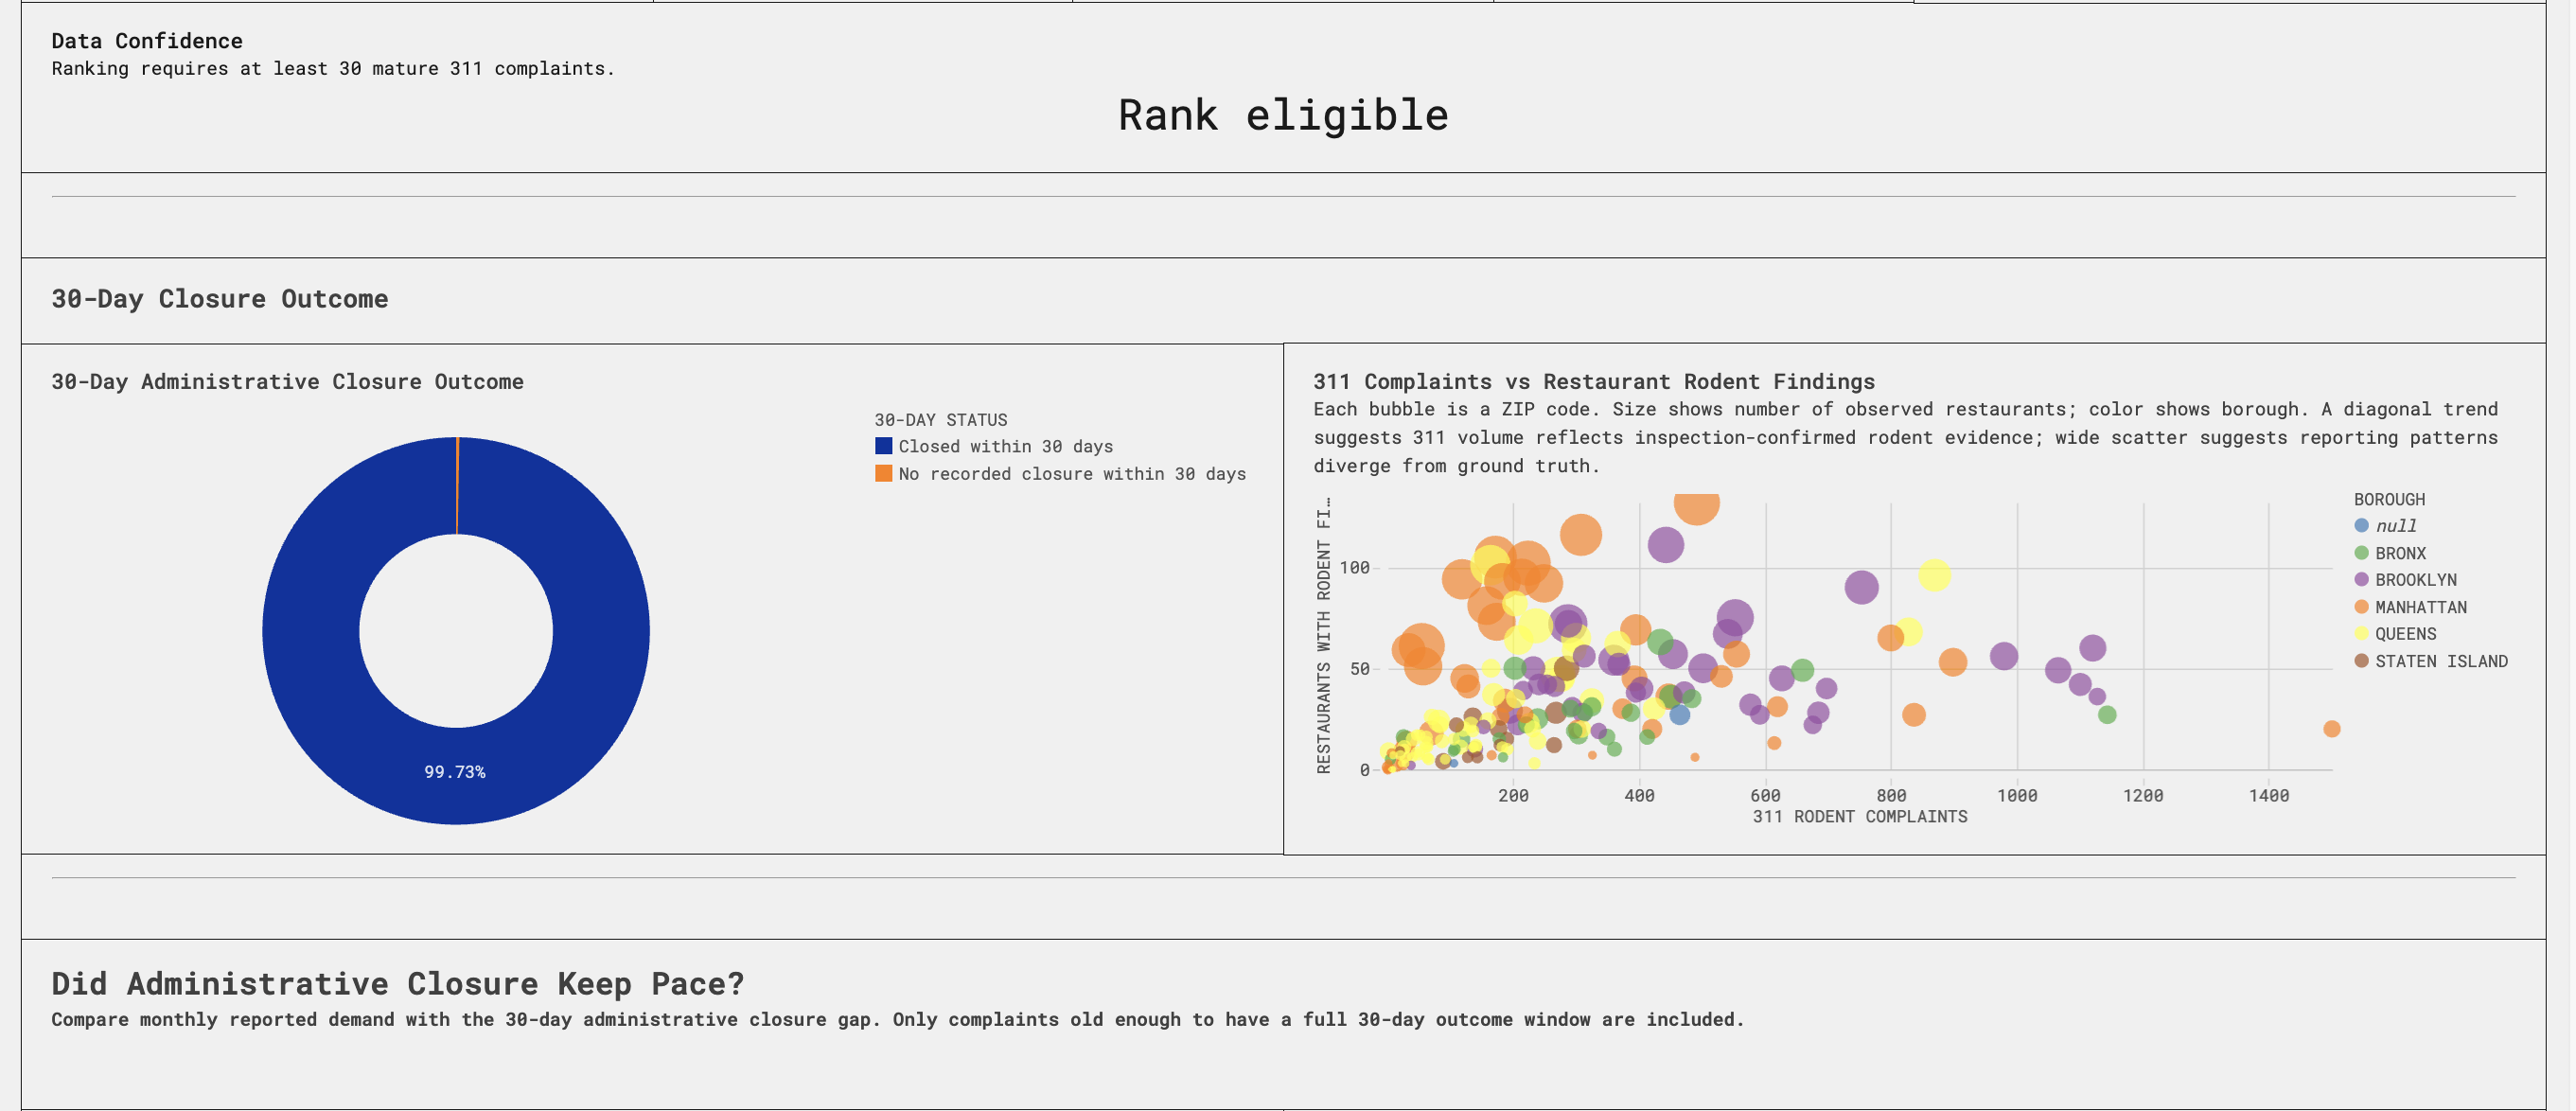
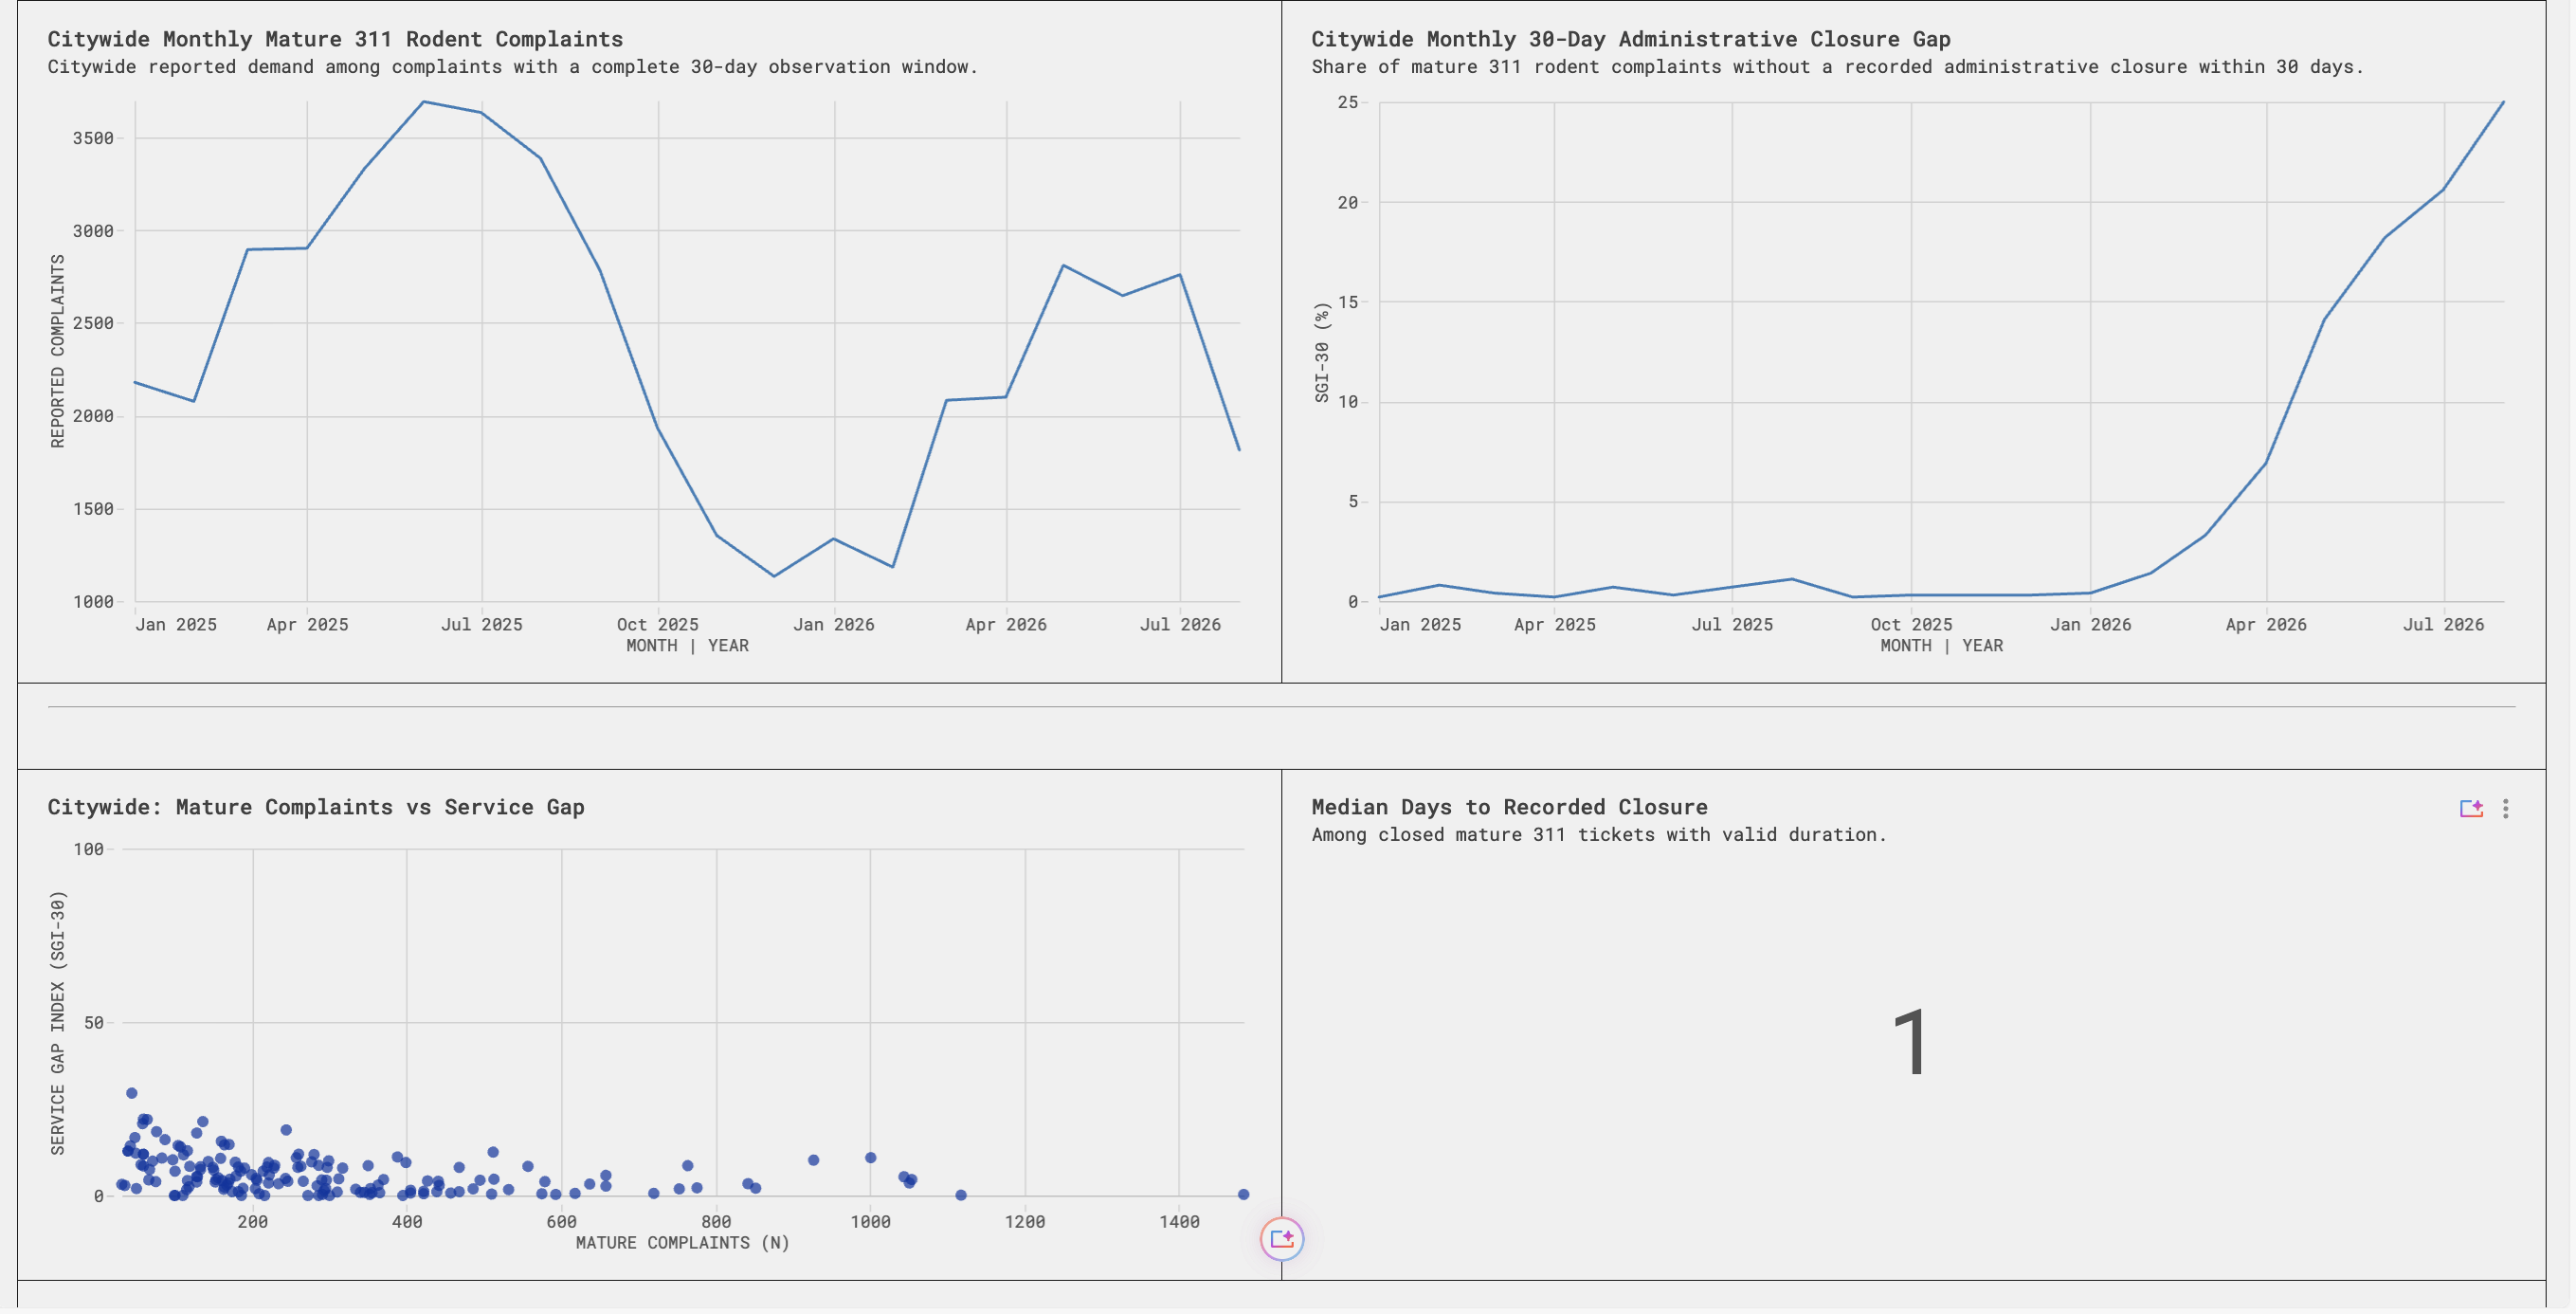
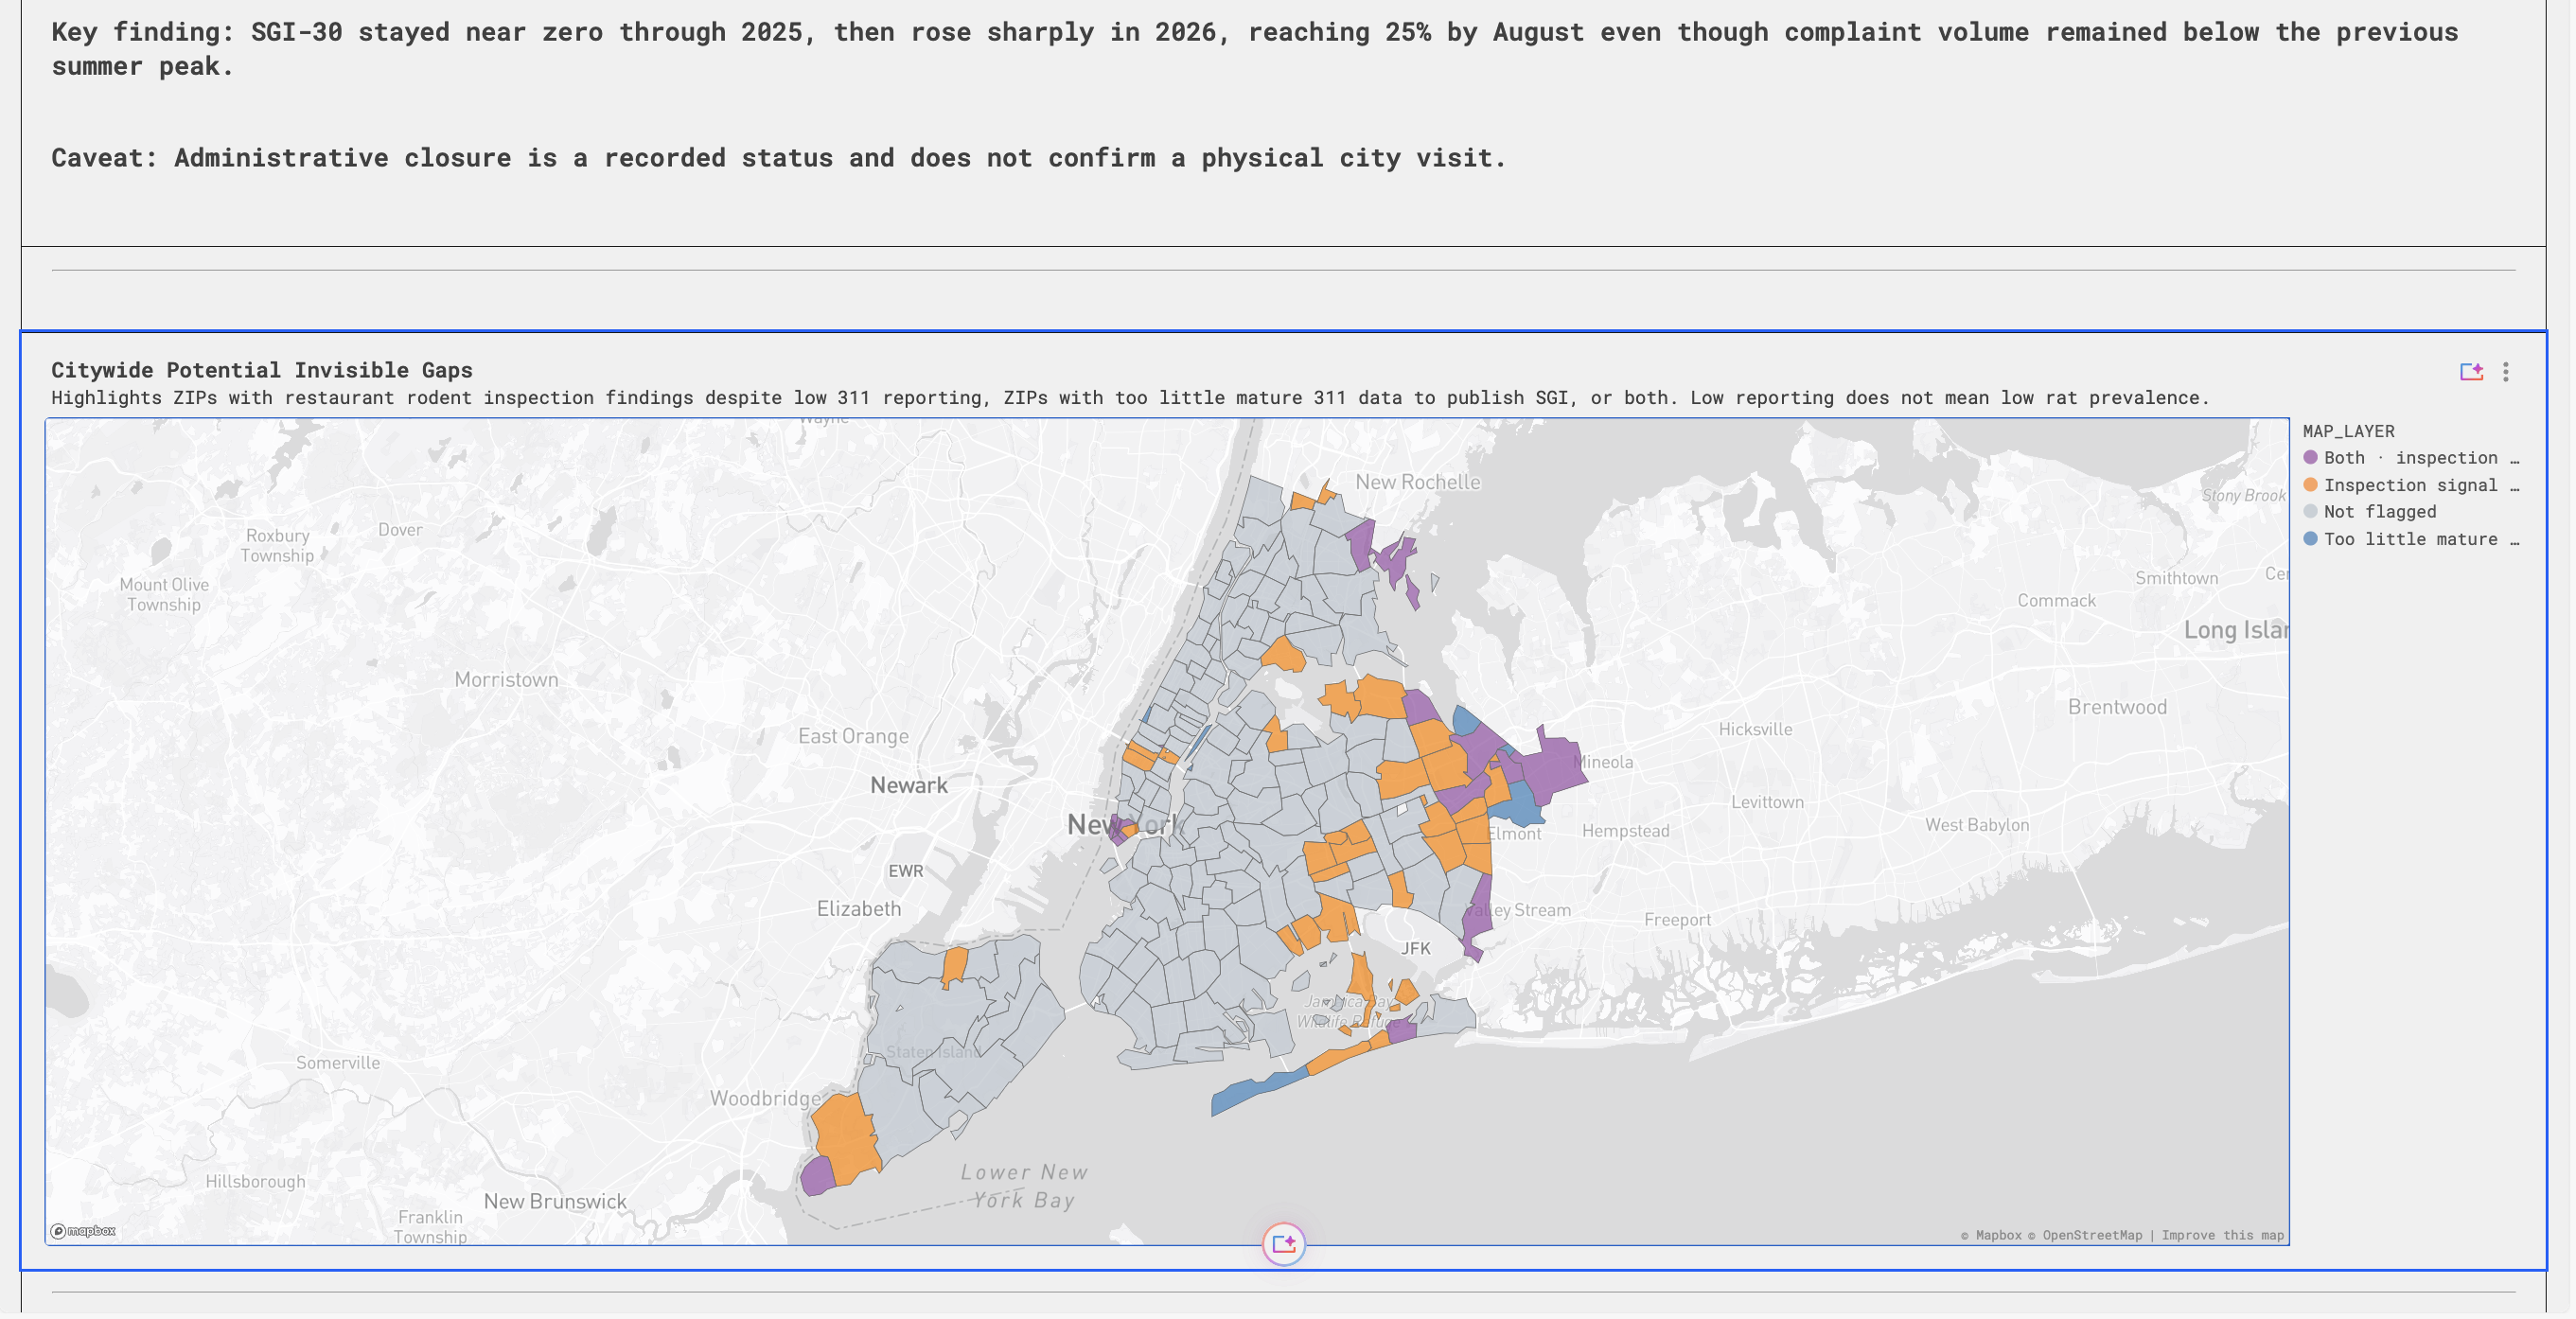
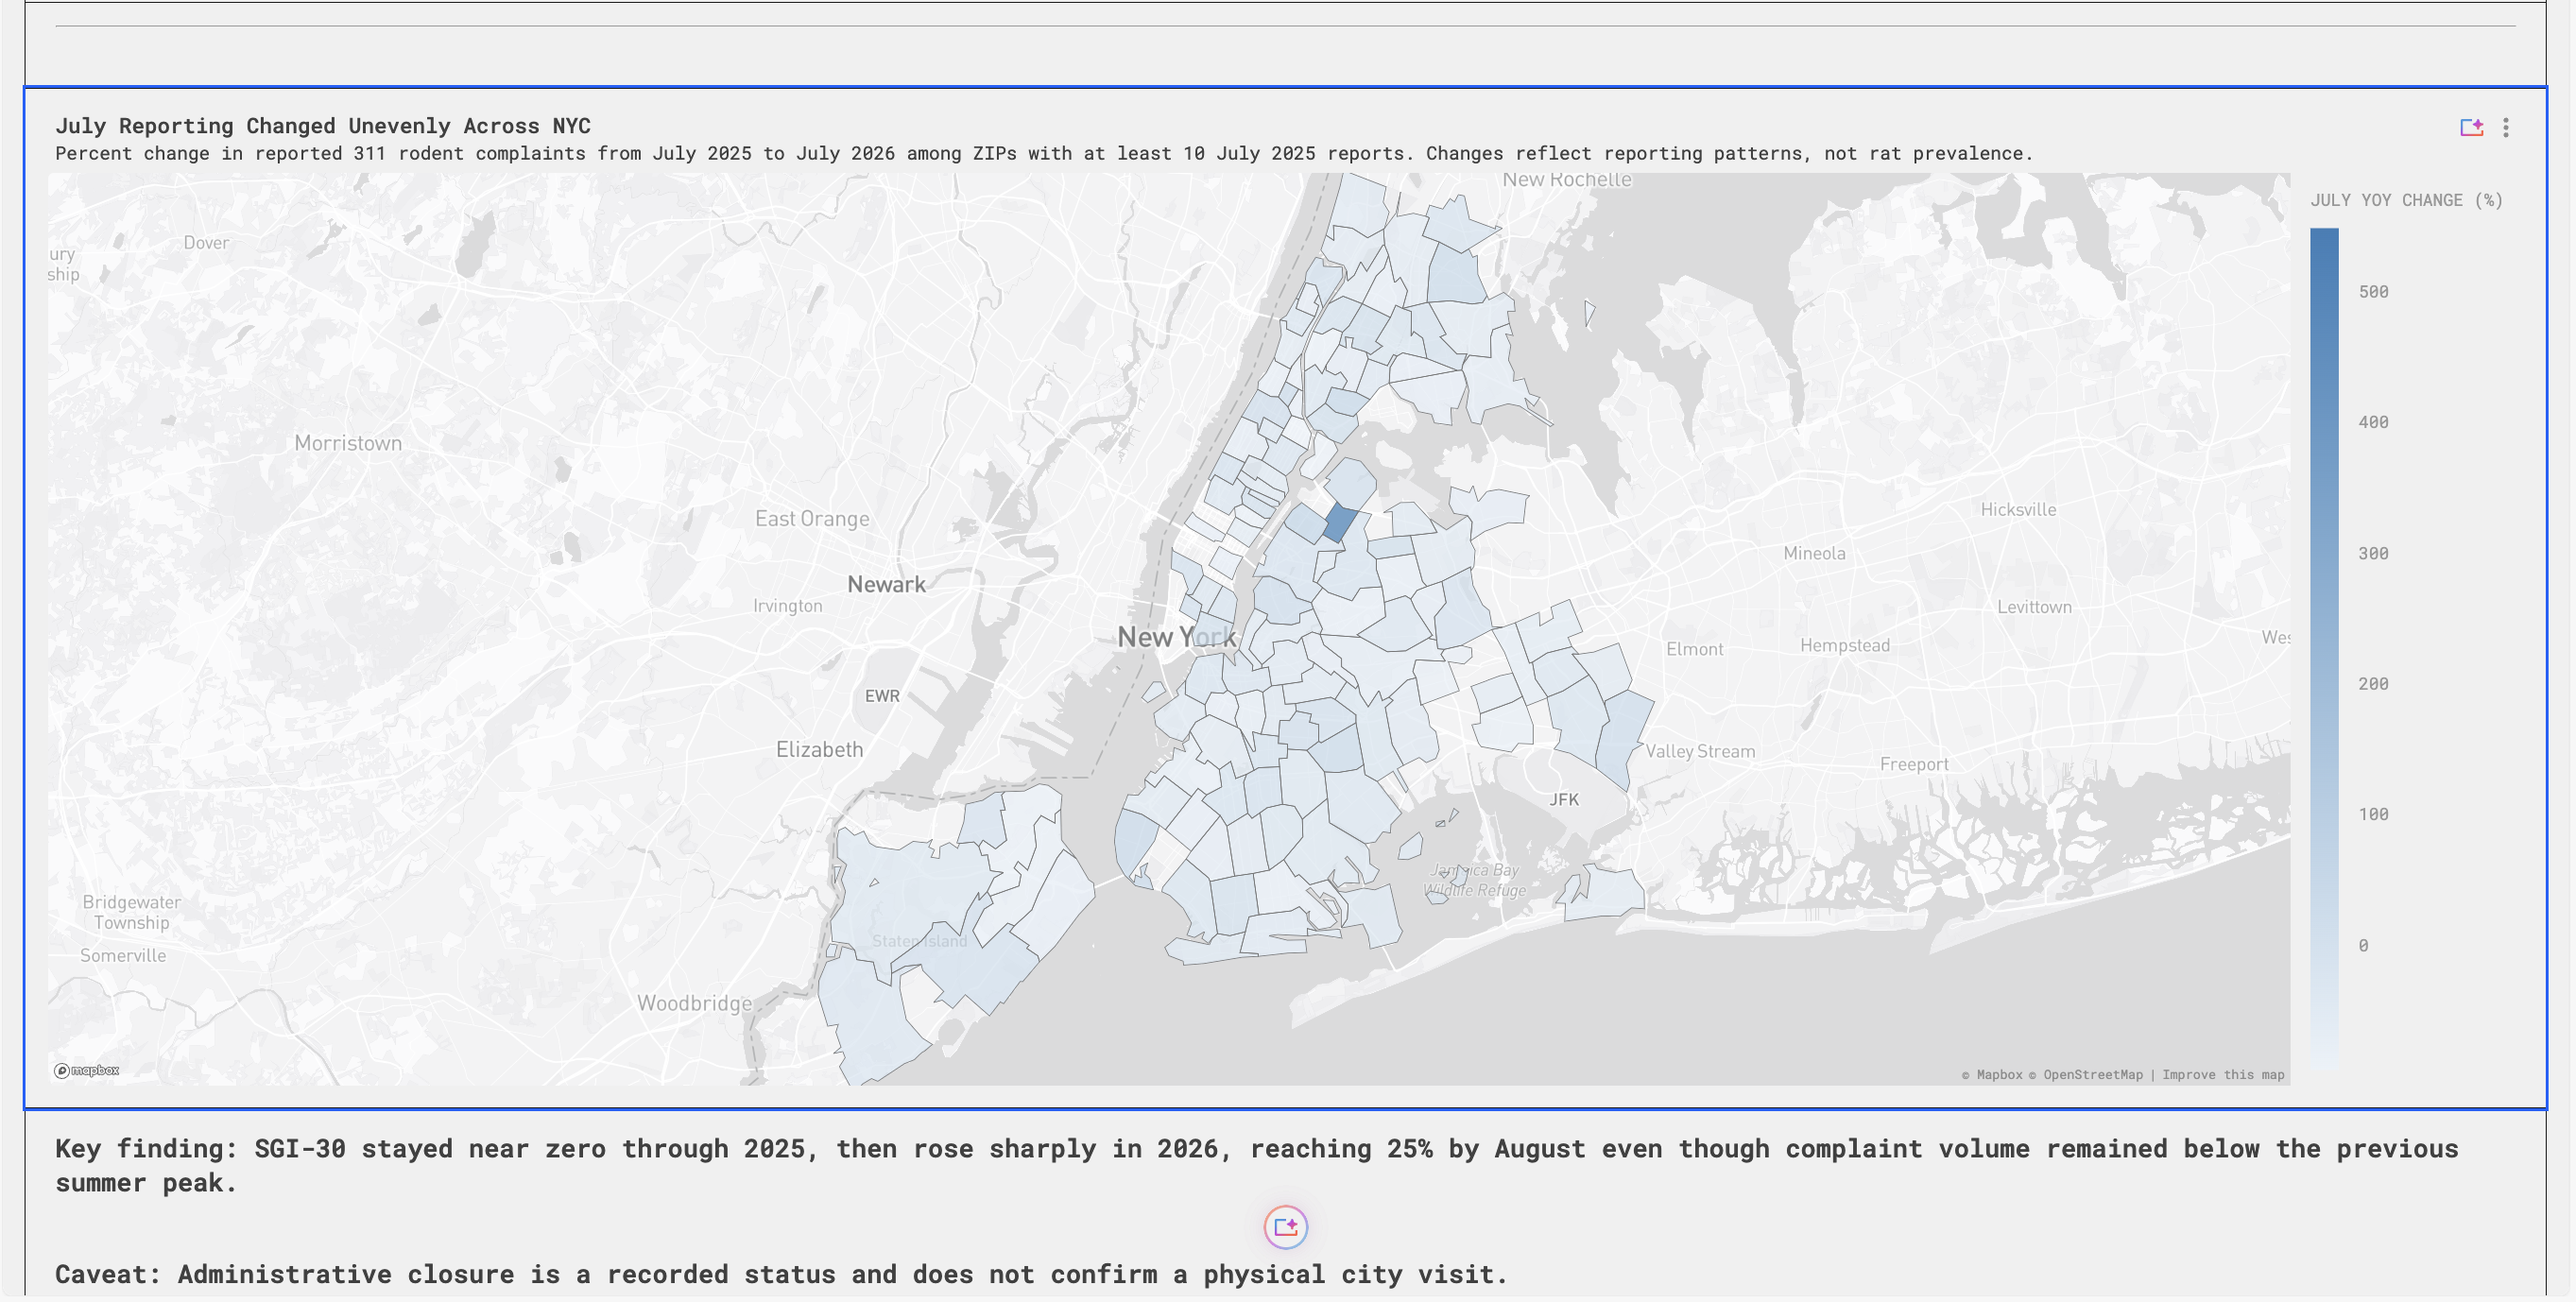
In January 2025, less than 1% of rodent complaints went 30 days without a recorded closure. By August 2026, that number hit 25%. One in four complaints now sits open past 30 days. This didn’t happen because more people started calling. Complaint volume actually fell from its summer 2025 peak. The pipeline is the same size. The city just stopped closing tickets at the same rate.
We call this SGI-30: the share of complaints old enough to have been closed that still have not been. It went from under 1% to 25% in twenty months.
GAP B: It Is Hitting Queens and Staten Island Hardest
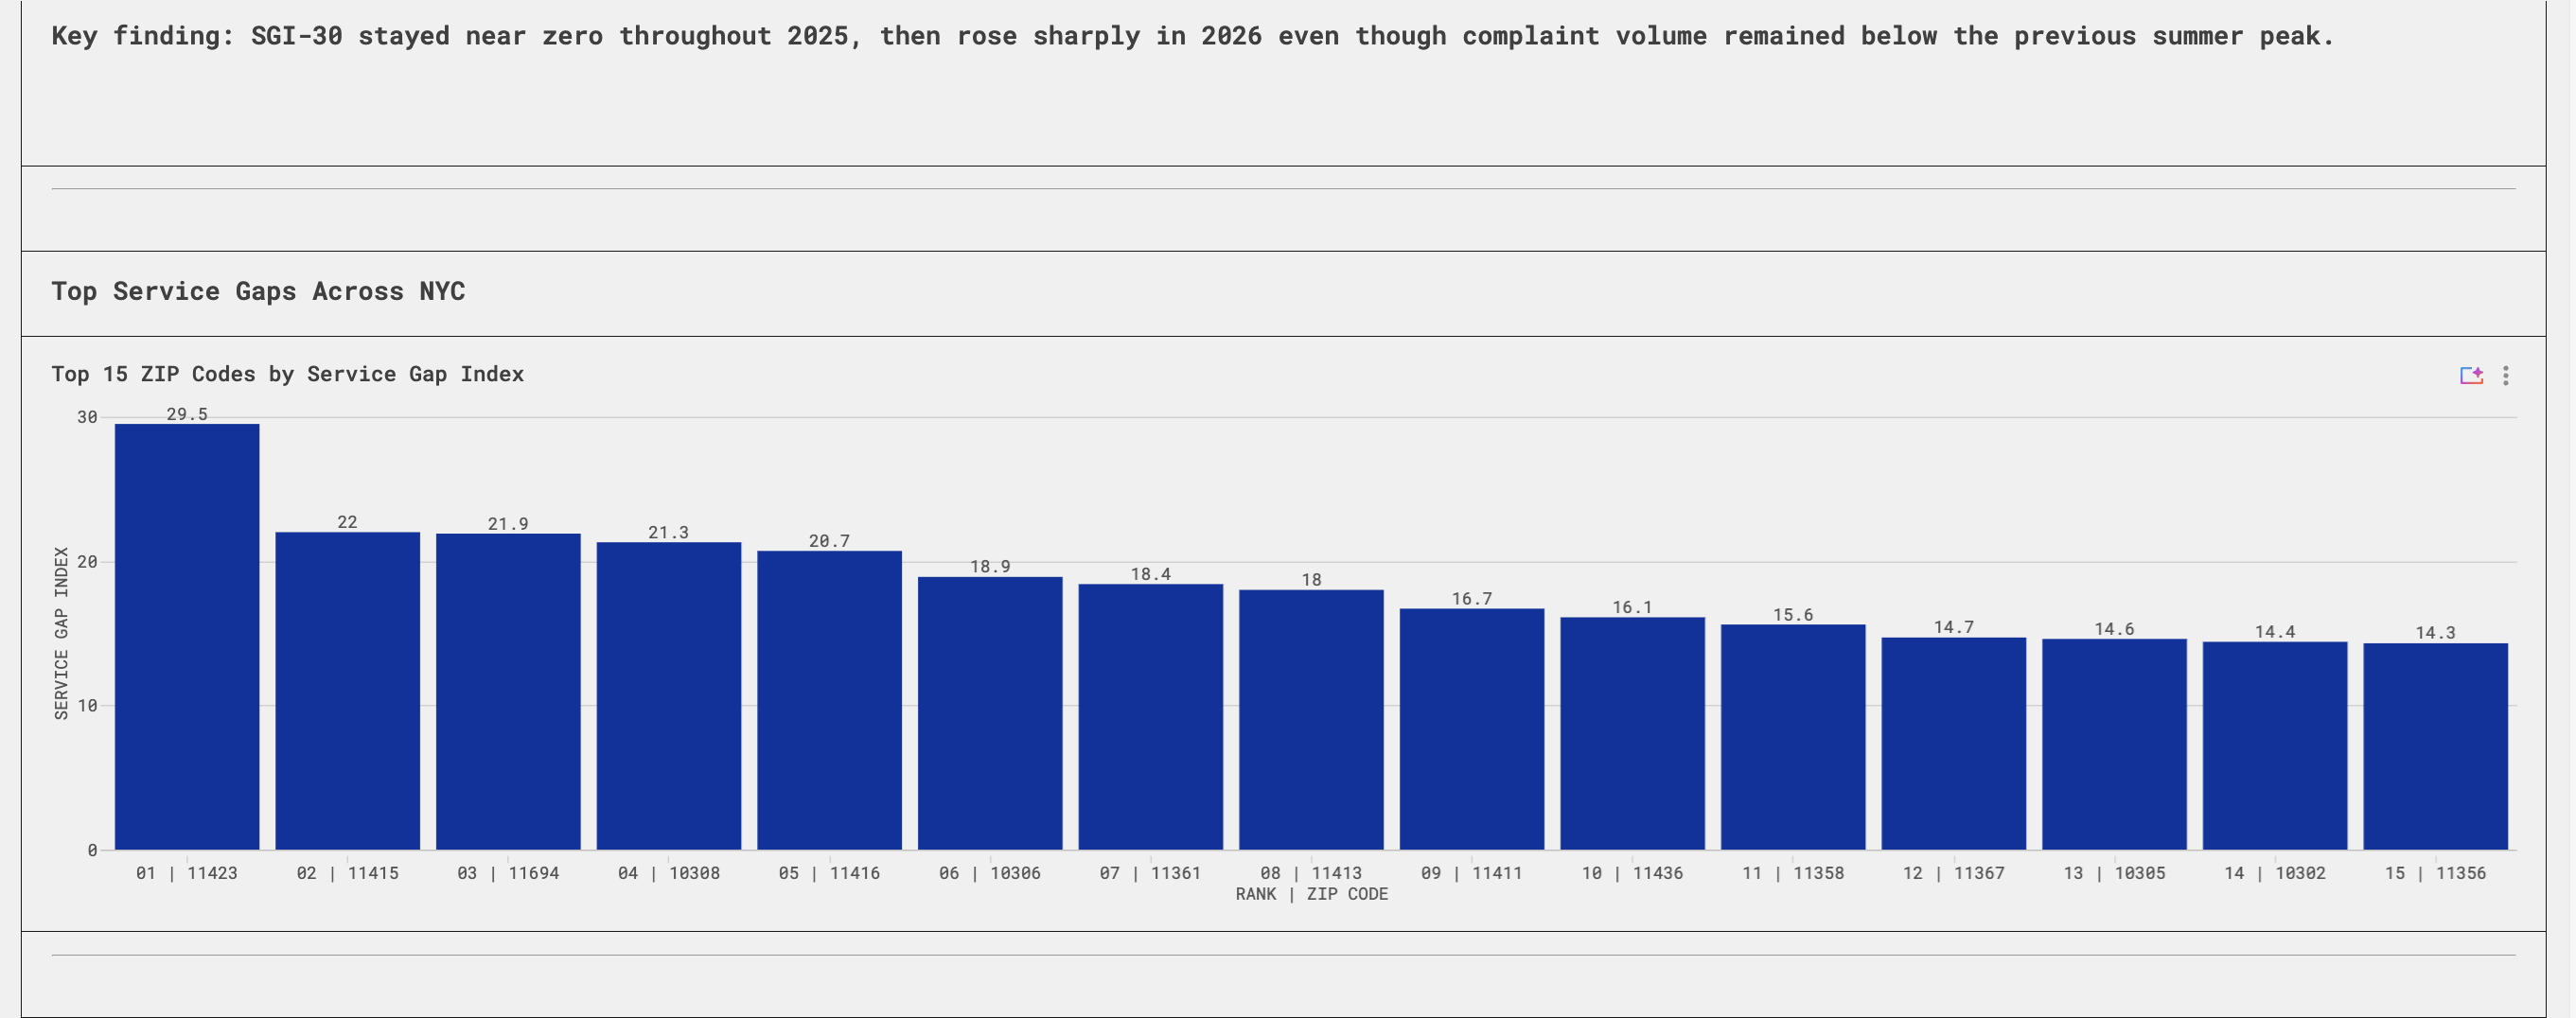
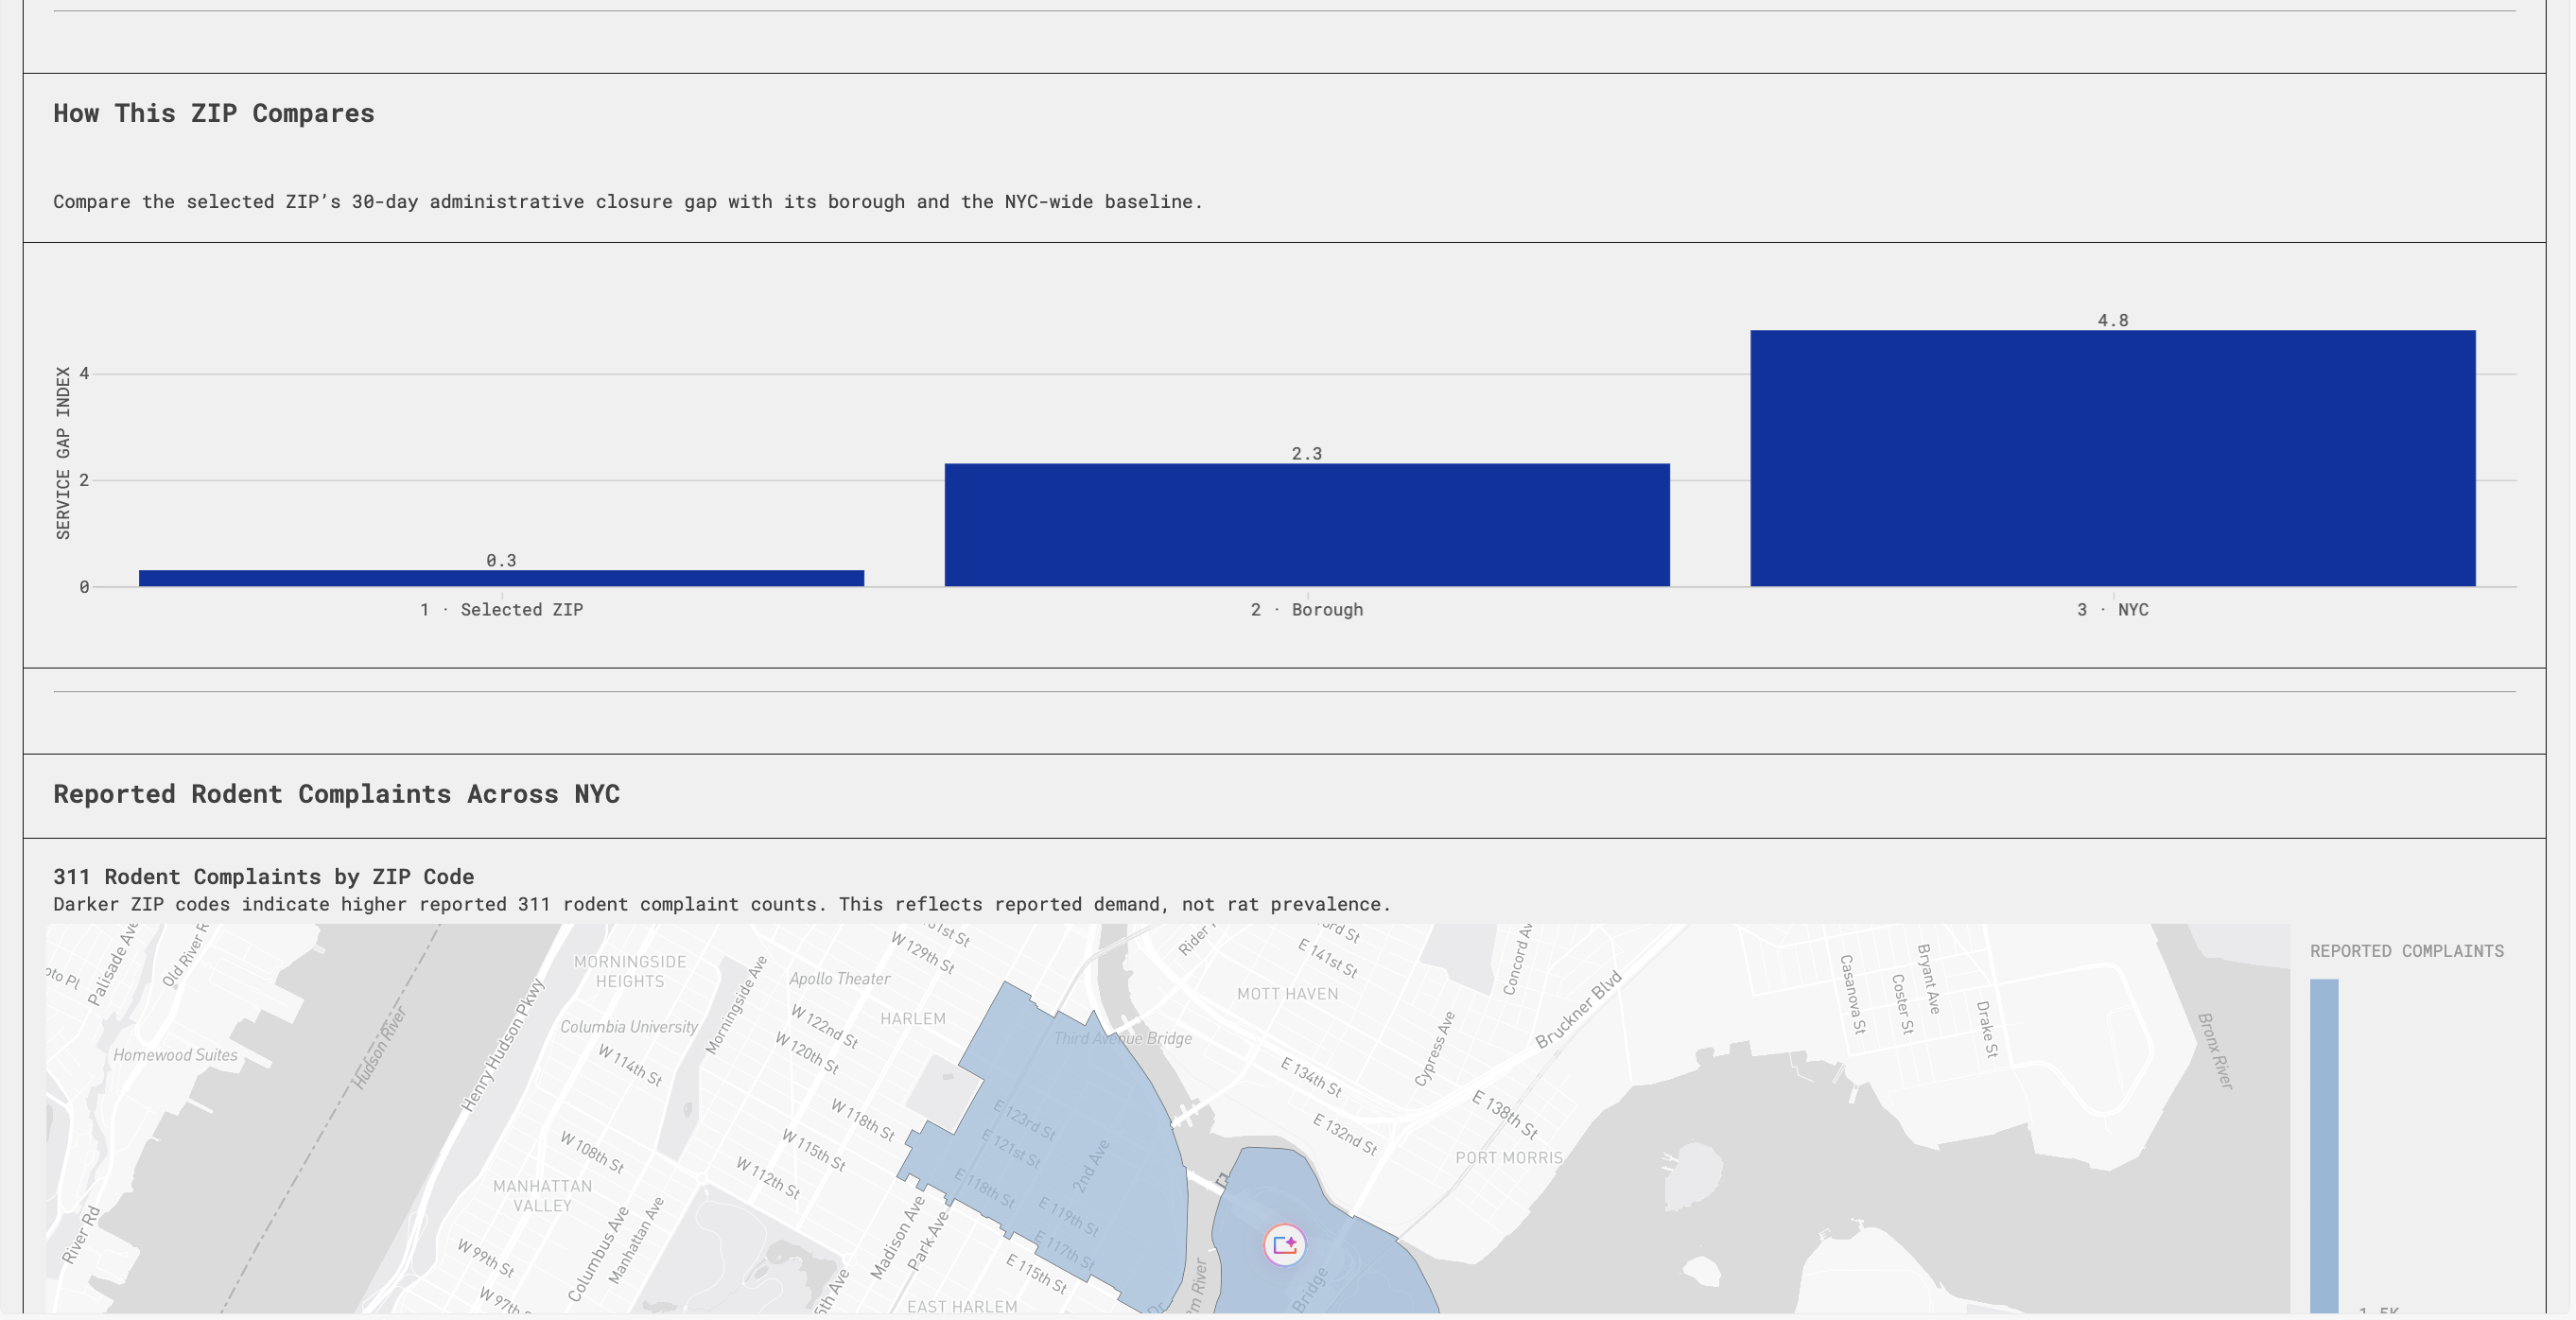
The closure gap is not evenly distributed. Eight of the top ten worst ZIPs are in Queens and Staten Island. These are not the neighborhoods with the most complaints, because Brooklyn and Manhattan have more. These are the neighborhoods where people call, and nothing happens on paper.
ZIP 11423 in Queens has only 44 scoreable complaints but a 29.5% gap rate. Meanwhile, ZIPs with over a thousand complaints have SGI scores under 6%. Volume and service gap are different things. The borough where people call the most is not the borough where tickets sit open the longest.
GAP C: The Places That Are Not Calling
64 ZIP codes have too few complaints to even score. Some are airports. Some are office buildings. But some are neighborhoods where people may have stopped calling or never started. Whether that means no rats or no trust in 311, we cannot tell from this data. That is the invisible gap. The dashboard cannot see it, and neither can the city.
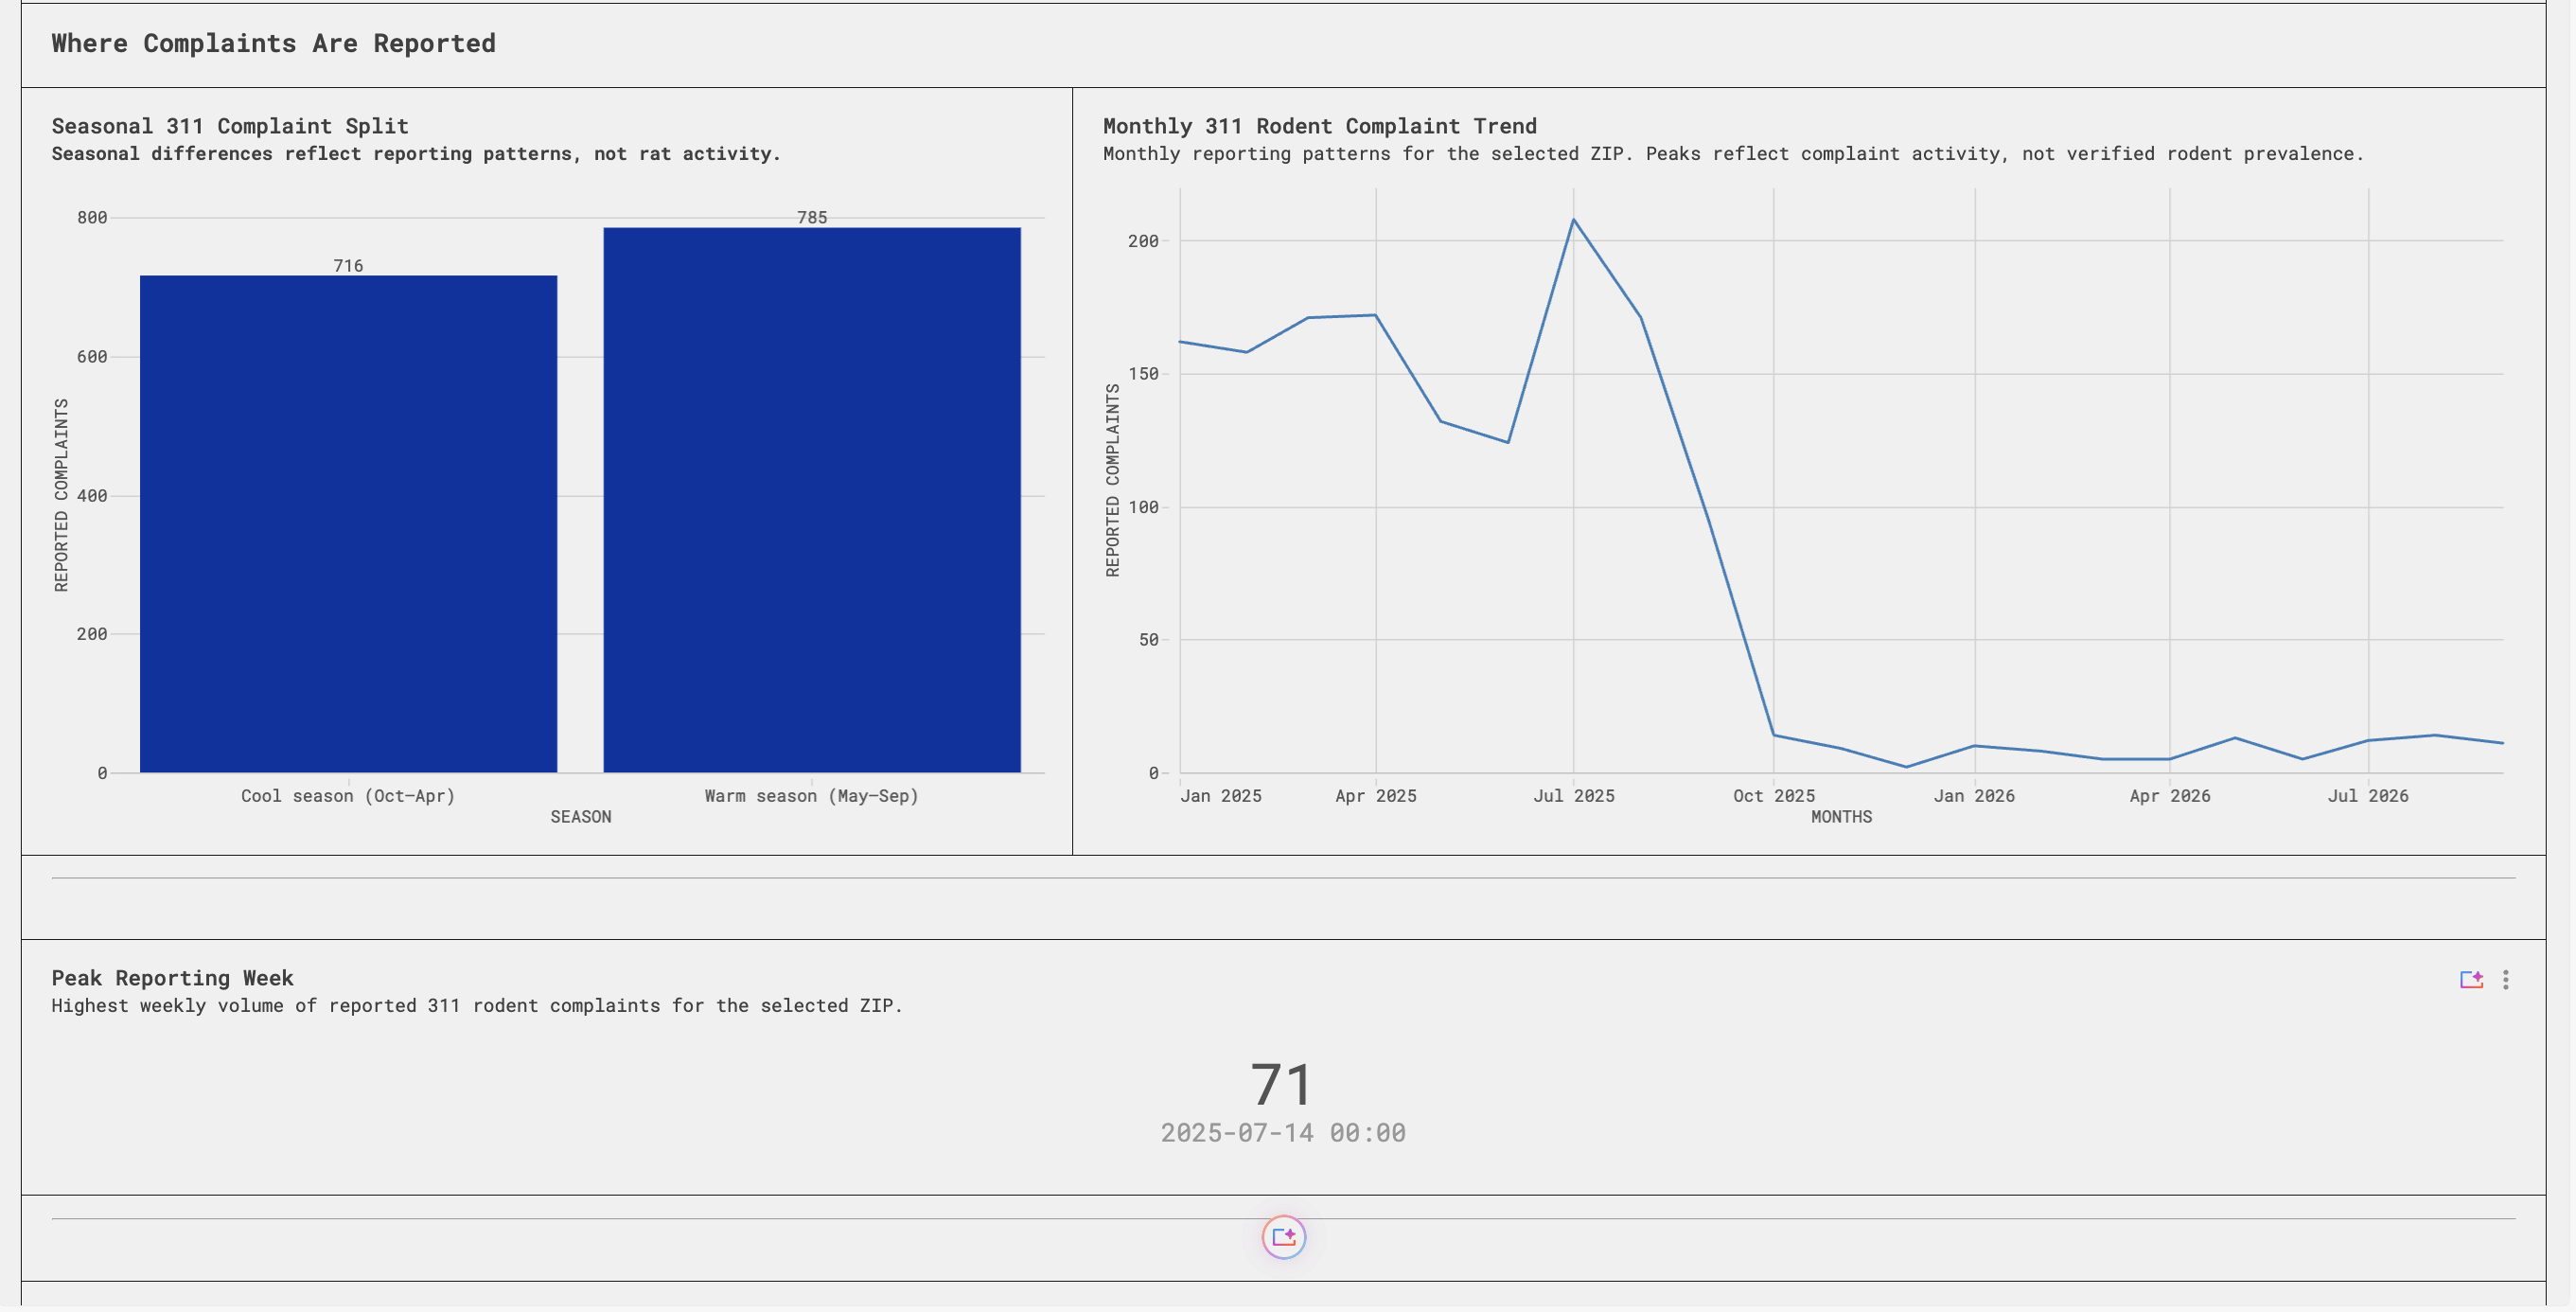
Complaint volume is dropping in 37 ZIPs year over year. The biggest drop: 11217 in Brooklyn, down 61%. Is that progress or surrender? The data doesn’t say.
3. HOW TO RESPOND BETTER
Three gaps, three responses.
Gap A (the citywide slowdown): The question is operational. What changed in the closure workflow 20 months ago? Complaint volume did not spike. Something on the response side slowed down. That is findable. Audit the closure pipeline from early 2025 to today and identify where the bottleneck formed.
Gap B (the borough concentration): Send additional closure capacity to Queens and Staten Island. These boroughs are not noisier than the rest. They are quieter on closure. The work is not getting done there at the rate it gets done in the Bronx or Manhattan.
For Gap C (the invisible gap): We do not treat low complaint volume as proof of a clean neighborhood. Before reallocating resources away from a quiet ZIP, verify with a second data source: trap data, sanitation inspections, or community outreach. Silence is not the same as absence.
3. TECHNICAL DECISION/TRADEOFFS
A carefully vetted, three-layer medallion architecture in Databricks was crafted: bronze (raw CSVs, untouched), silver (cleaned, enriched, classified), and gold (six tables that power the dashboard and Genie).
There are some decisions/tradeoffs we had to make:
Normalizing all ZIP codes: Both files represent ZIPs differently. We padded all to five-digit strings, filtered to valid NYC ranges, and classified each as neighborhood, airport, or building on a shared spine so the two datasets join cleanly.
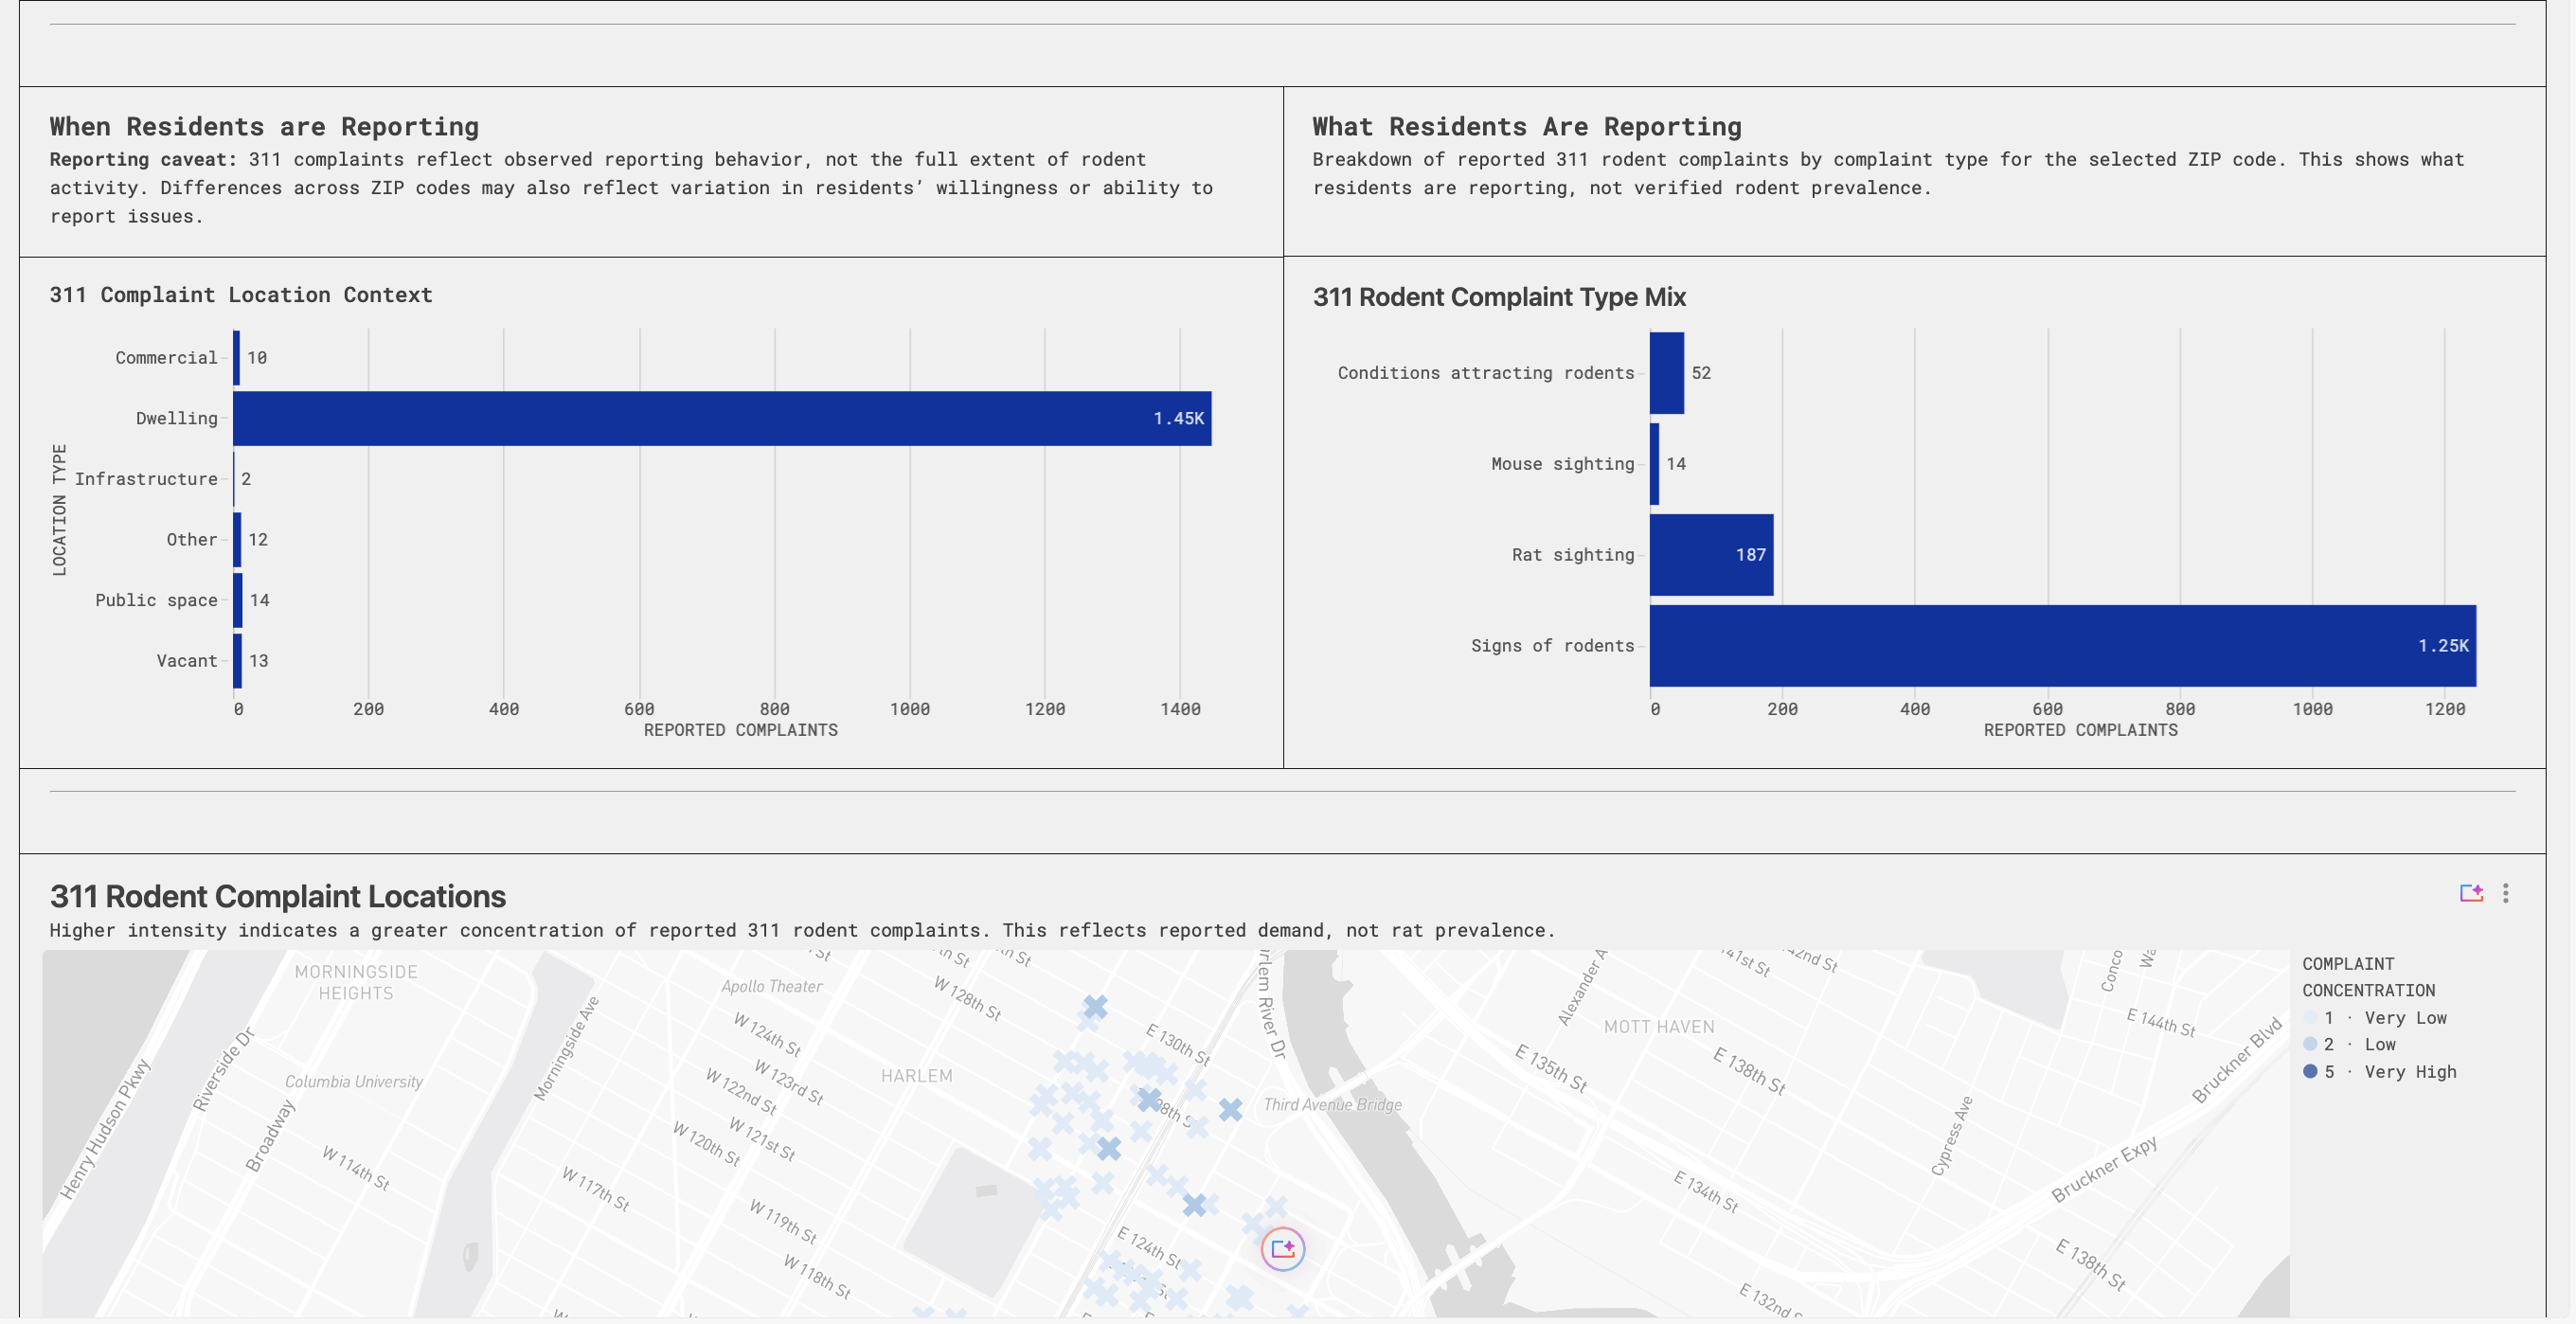
Correctly defining rodent complaints: All complaint_type = "Rodent" records across four descriptors: Rat Sighting, Mouse Sighting, Signs of Rodents, and Condition Attracting Rodents. Same-timestamp closes (22,000 citywide) are flagged but kept, as they count toward volume but are considered unreliable evidence of service.
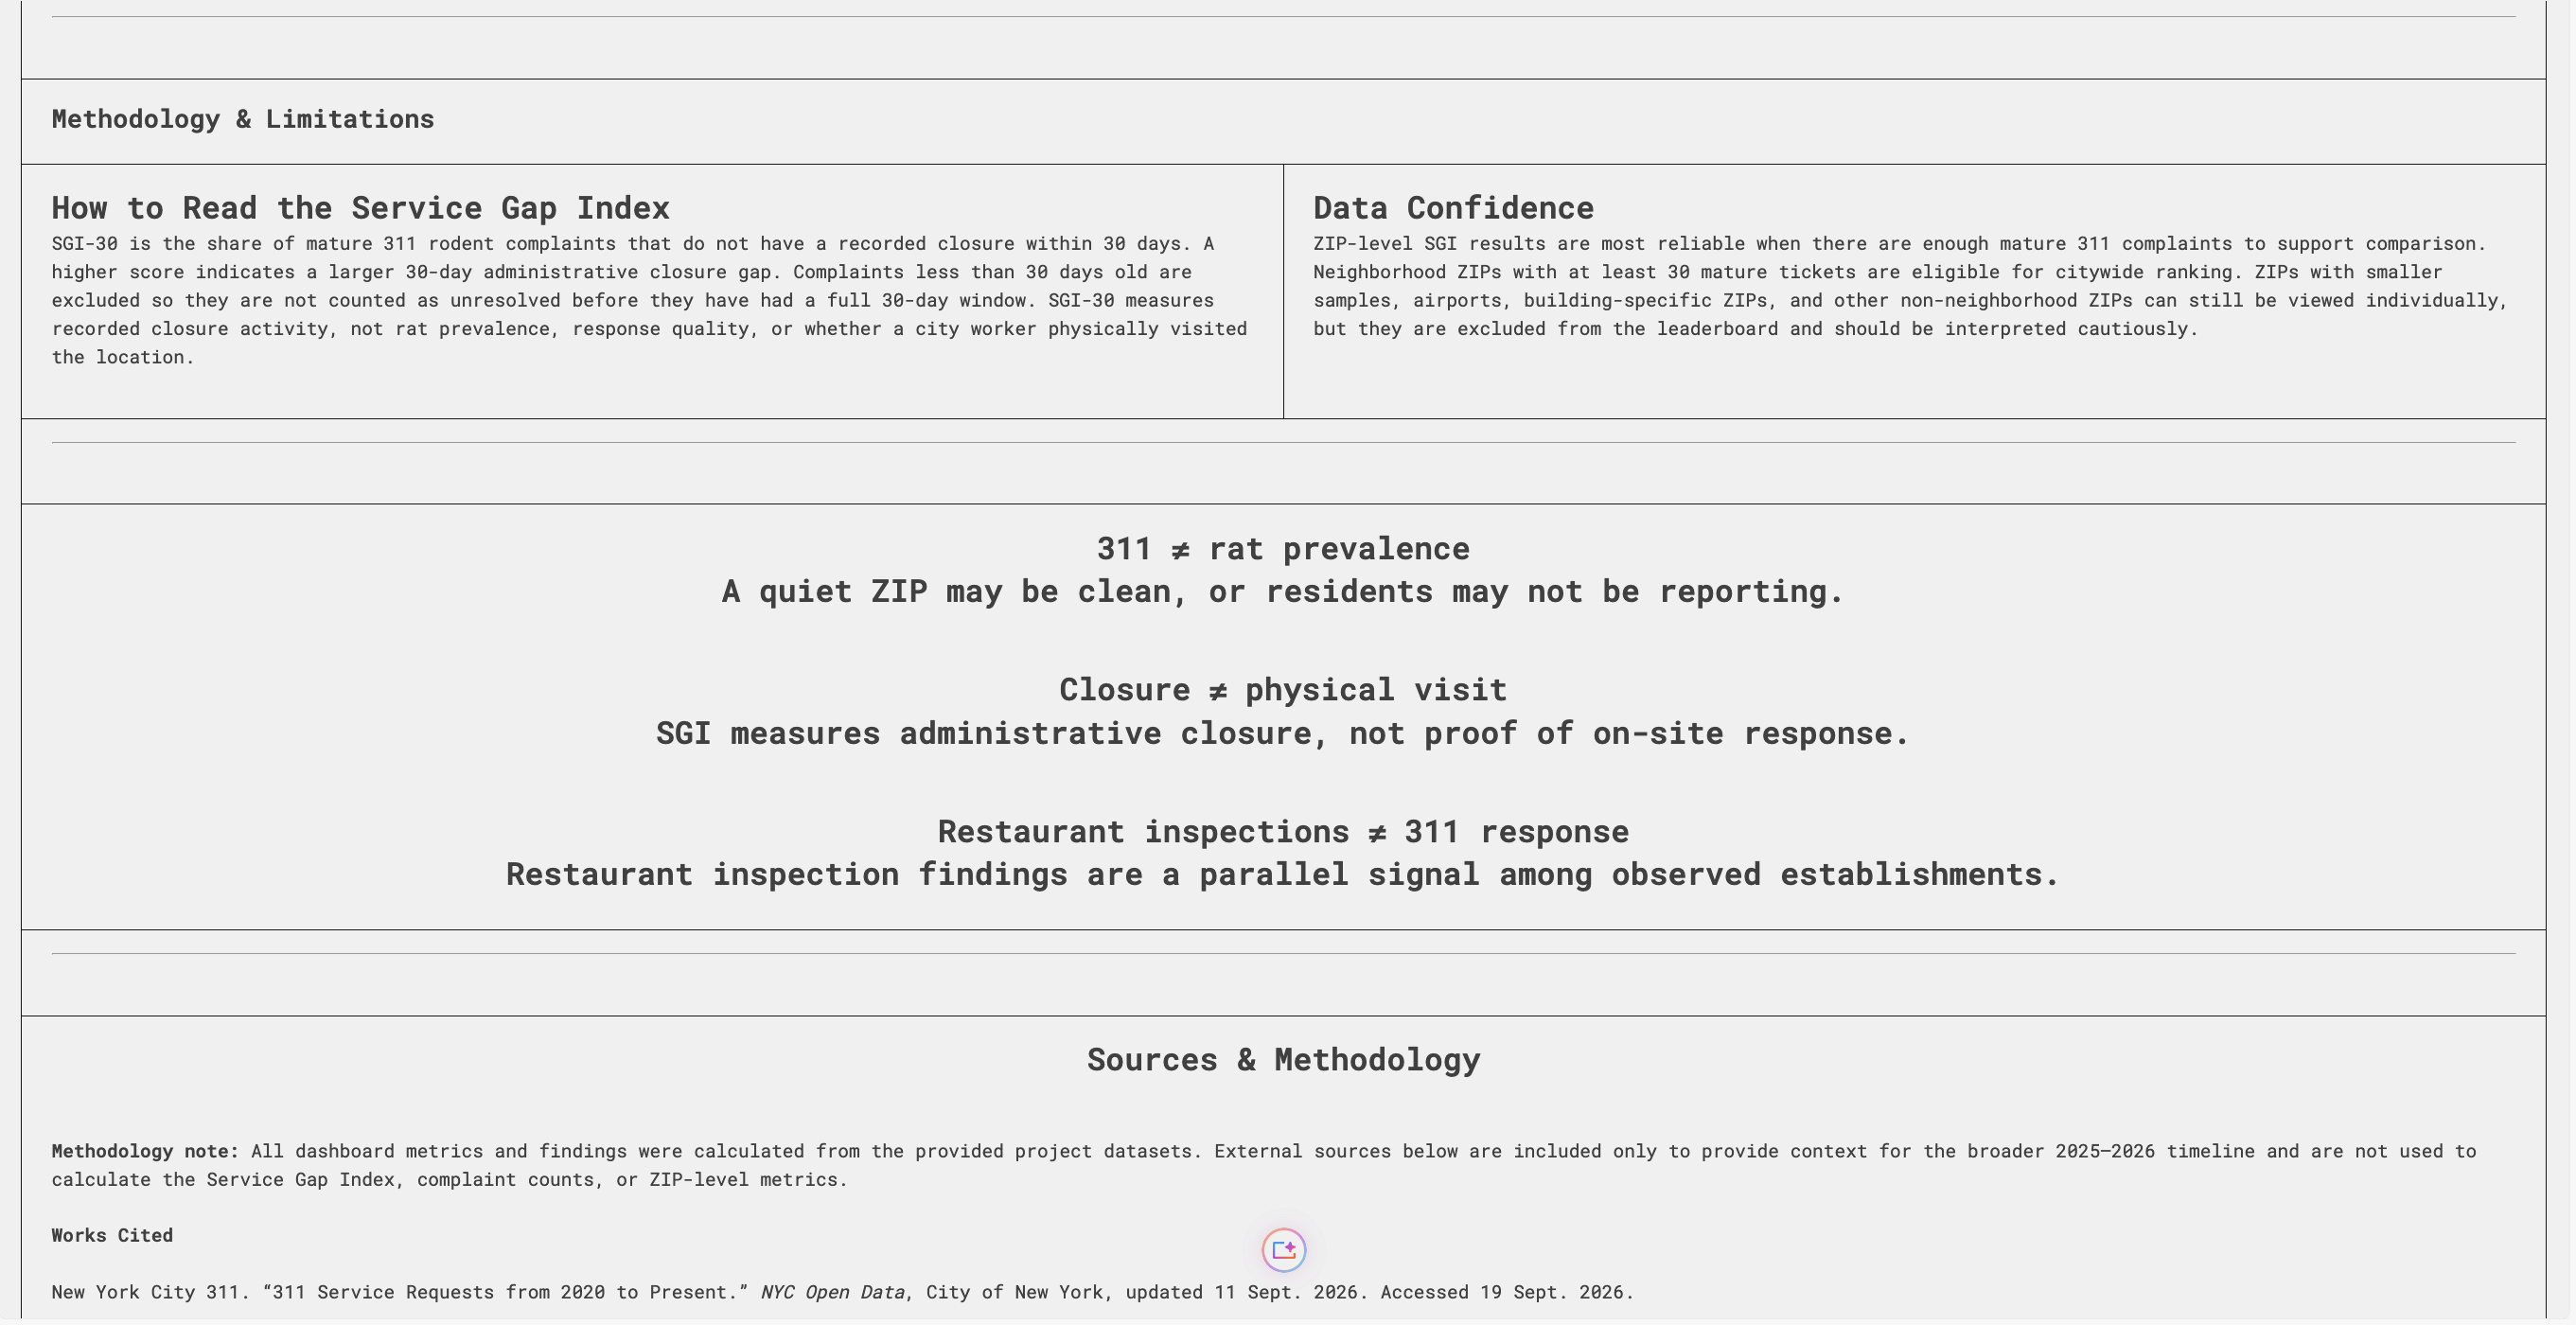
Index table: gold_zip_index: one row per ZIP with SGI-30 (share of complaints older than 30 days with no recorded closure), complaint breakdowns, kitchen context, GPS cluster analysis, and rank eligibility. Complaints older than 30 days are right-censored. Borough scores use pooled aggregation, so small ZIPs do not outweigh large ones.
Creating a metric instead of a map: SGI-30 is the share of complaints older than 30 days with no recorded closure. Kitchen inspections sit beside it as context, not inside it. No ticket ID links a 311 call to a restaurant visit, so we drew no causal arrow.
Right-censoring: Complaints younger than 30 days are excluded, so new tickets are not unfairly counted as unresolved.
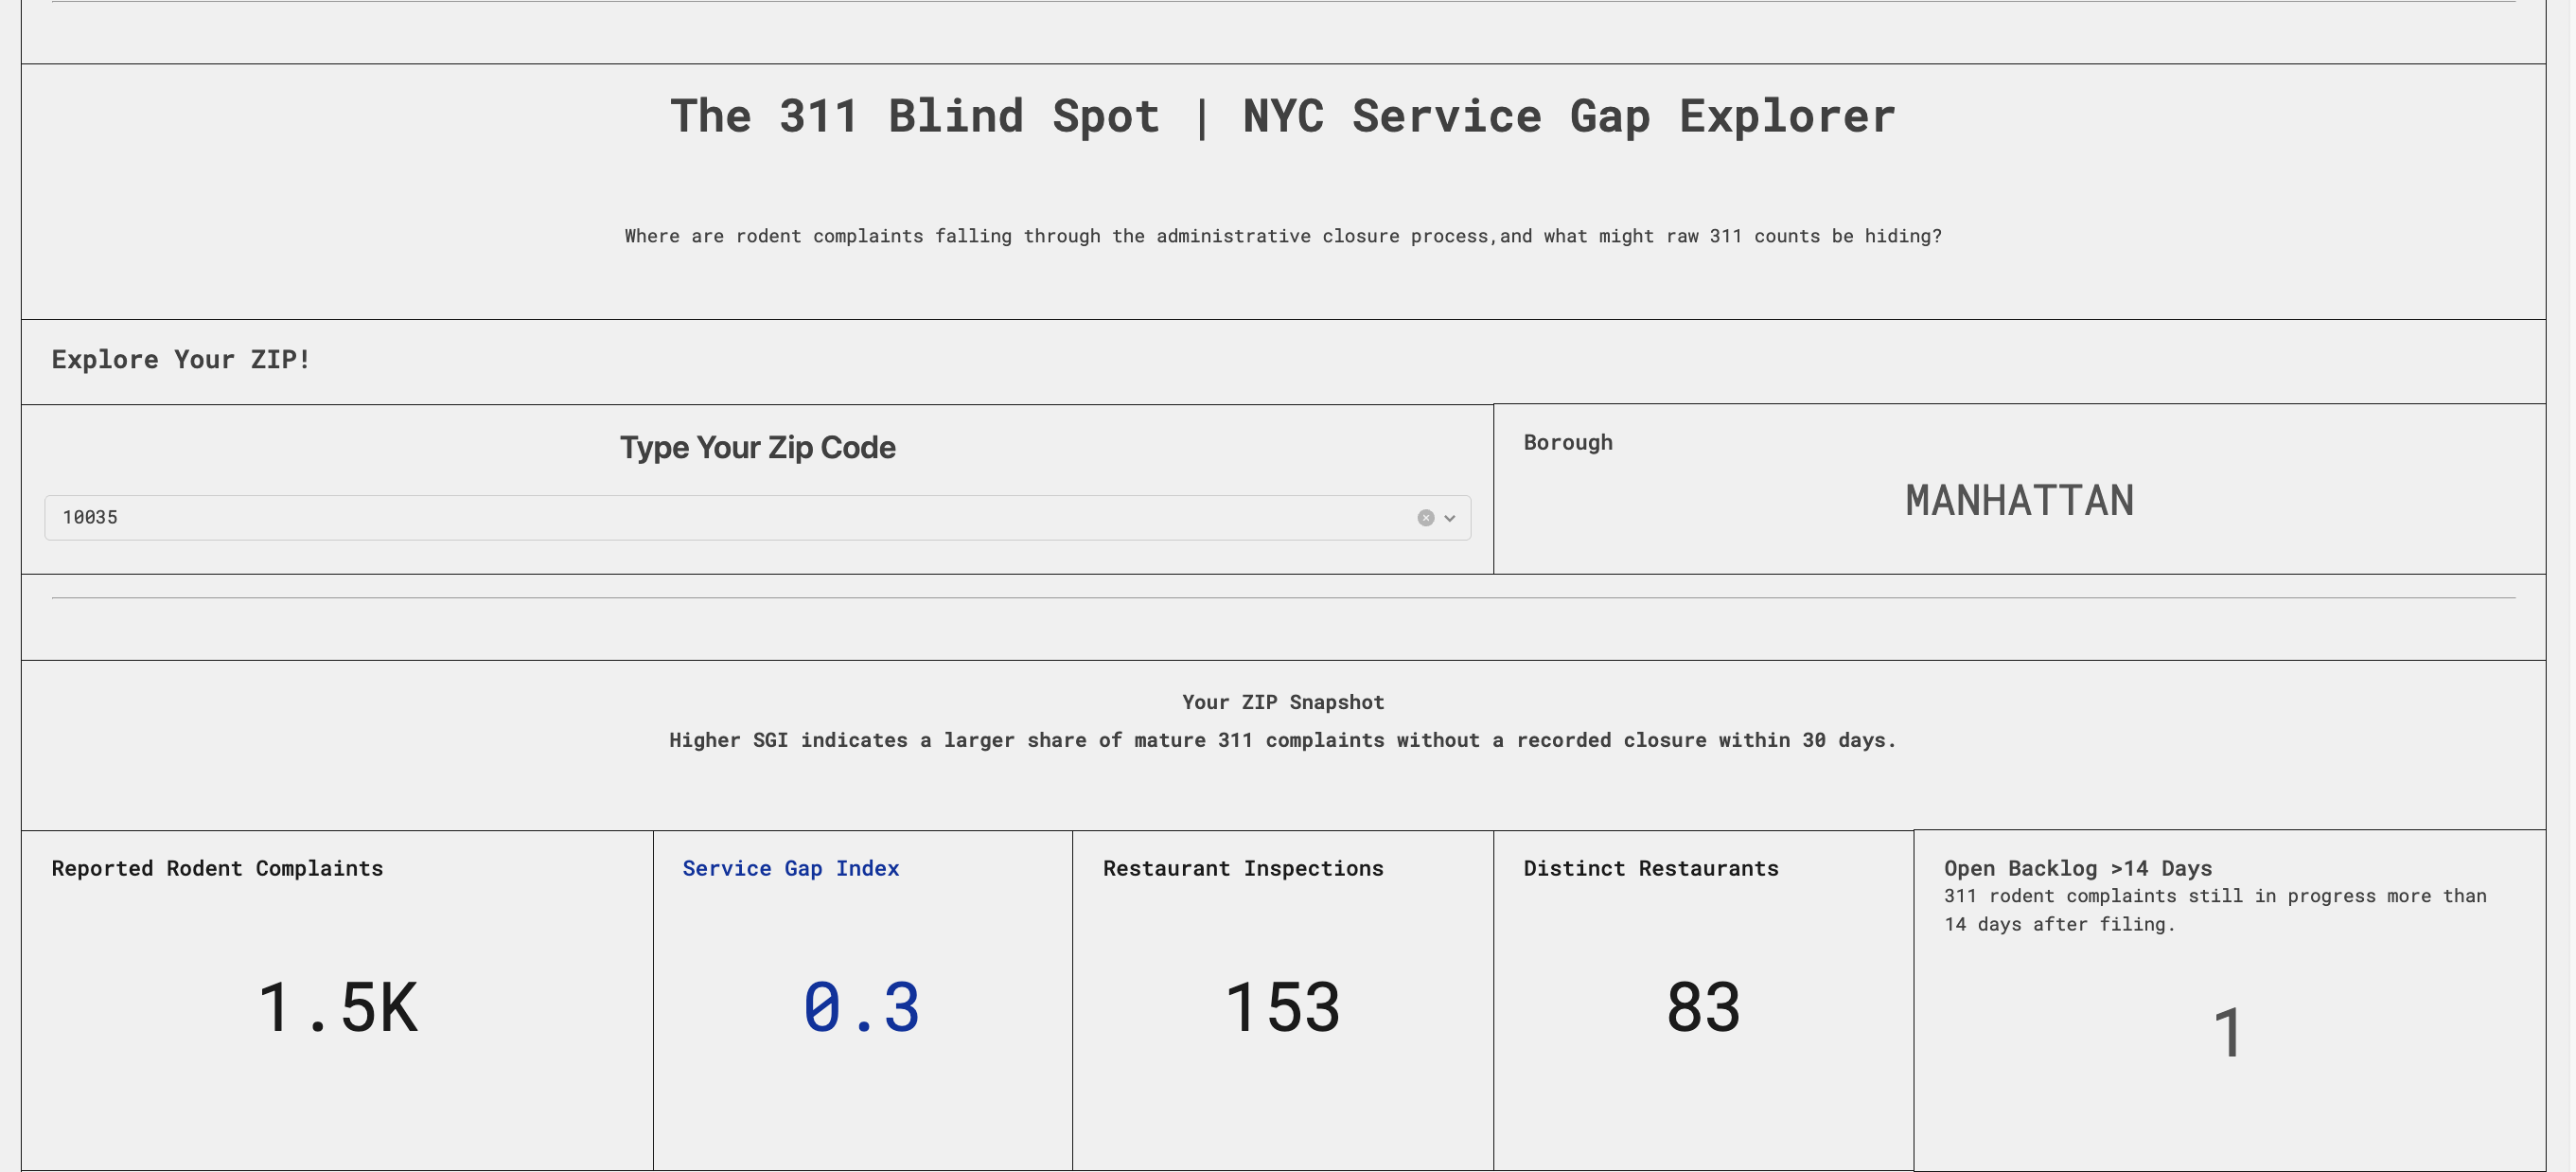
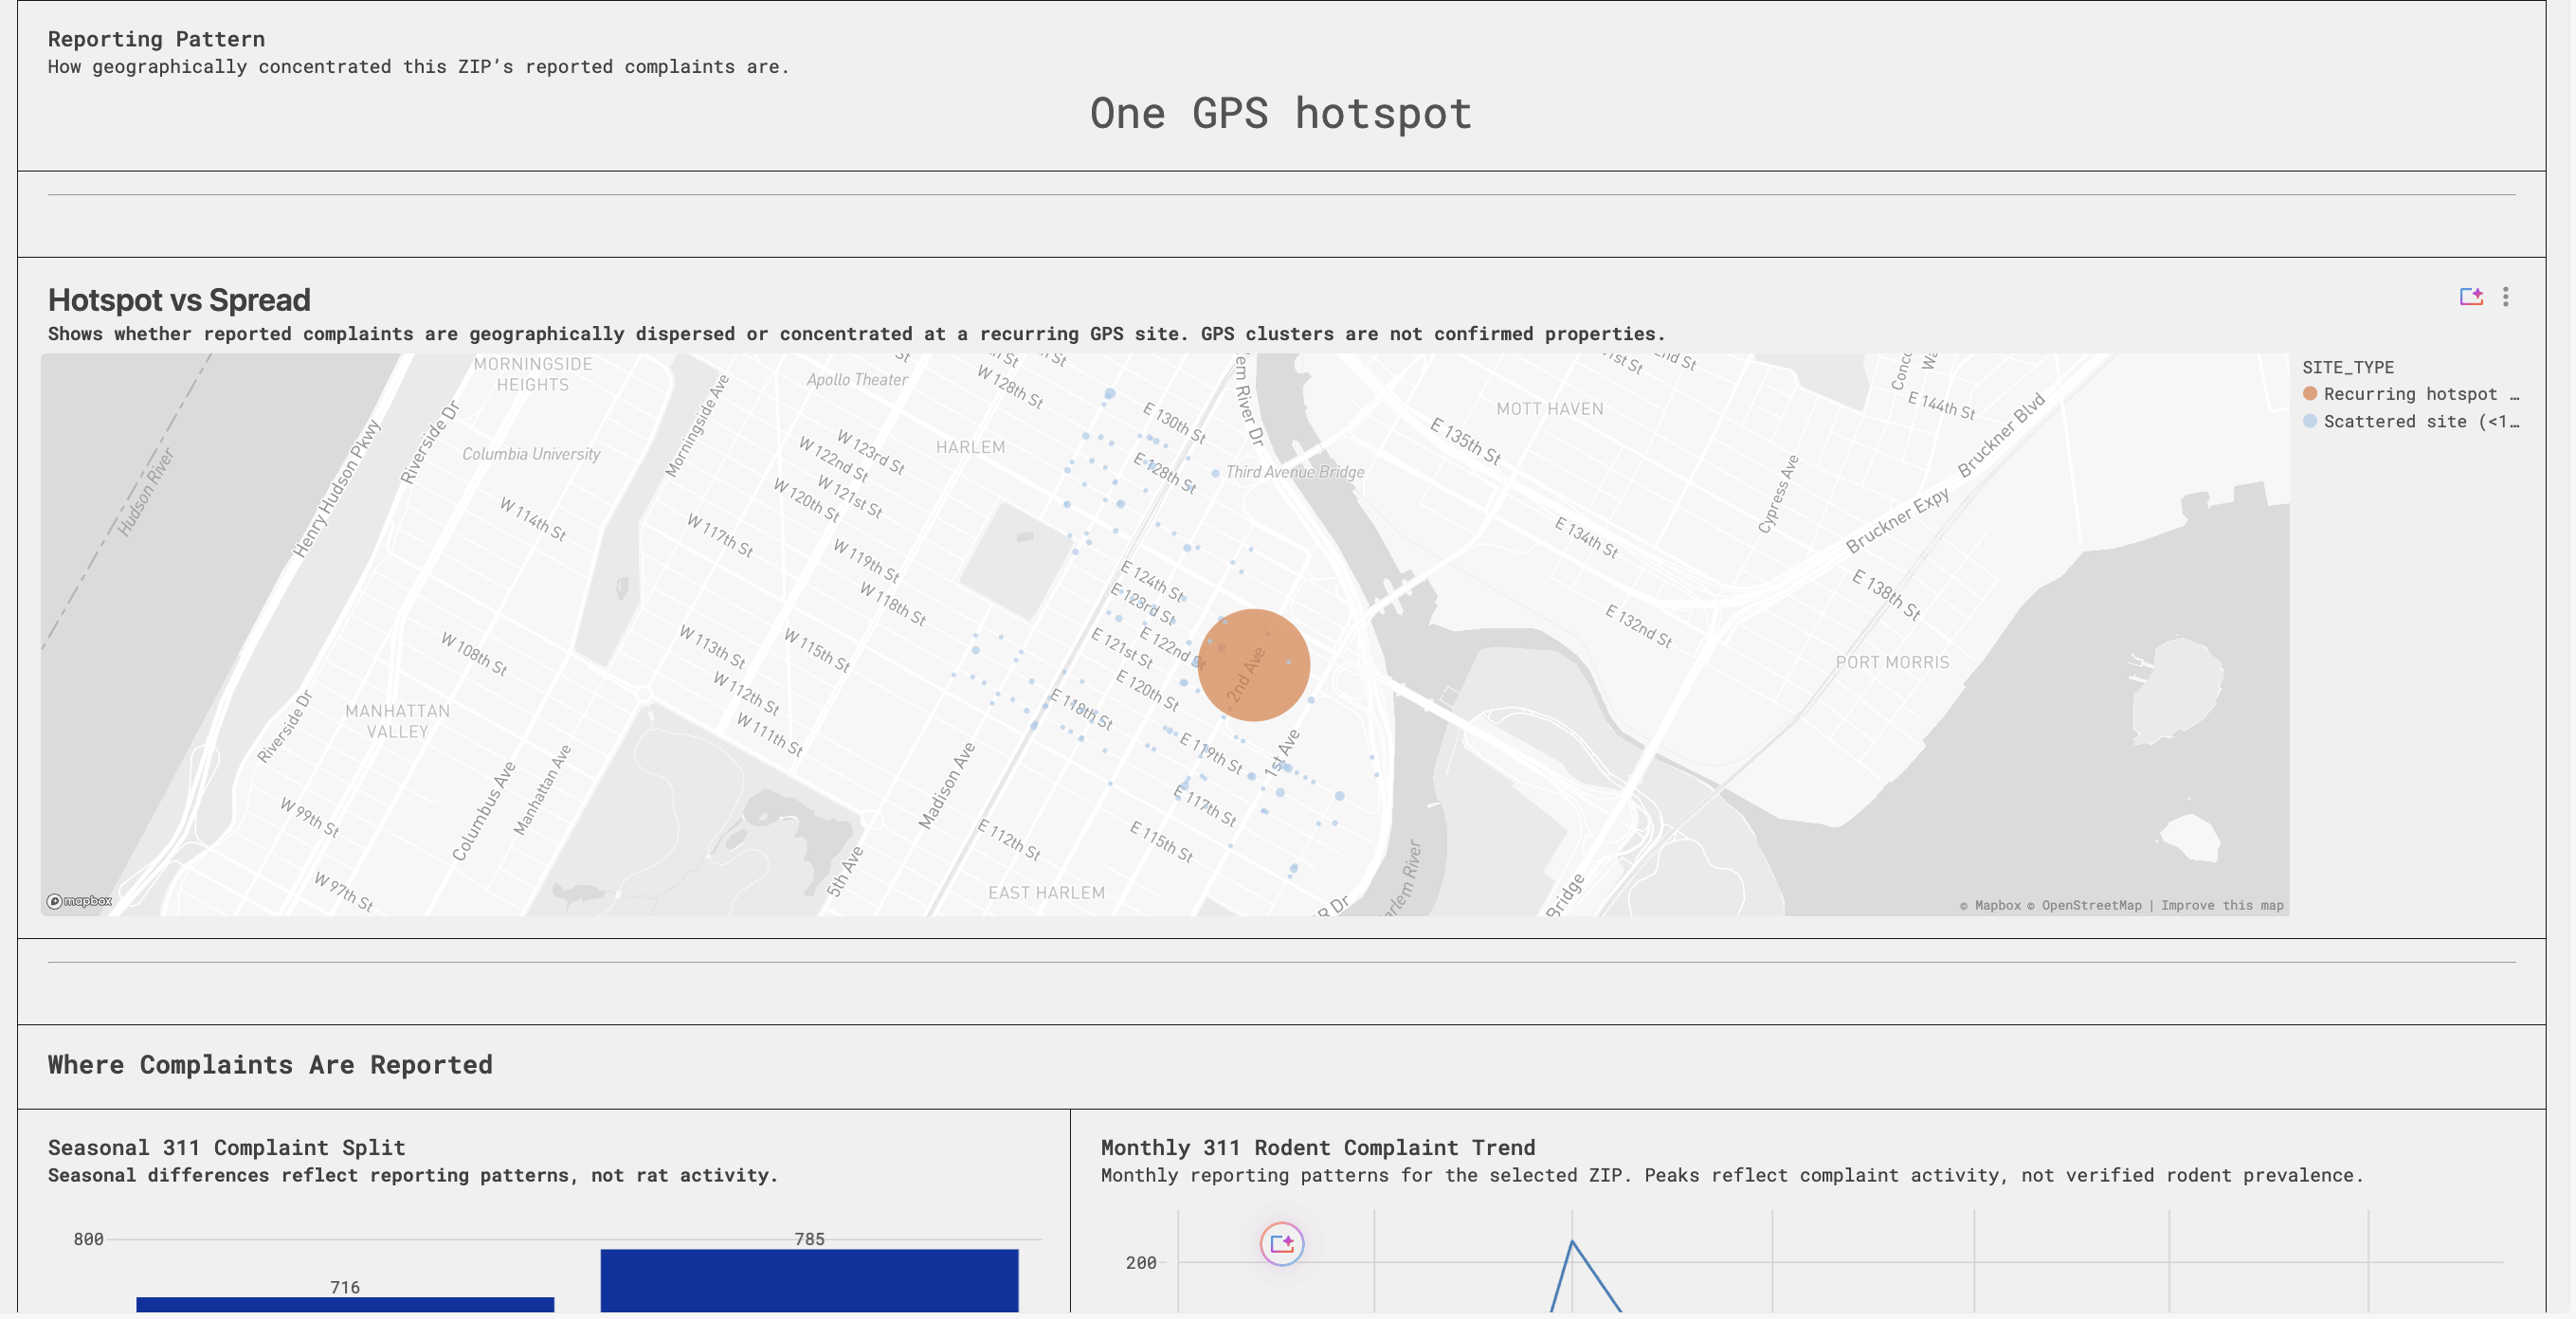
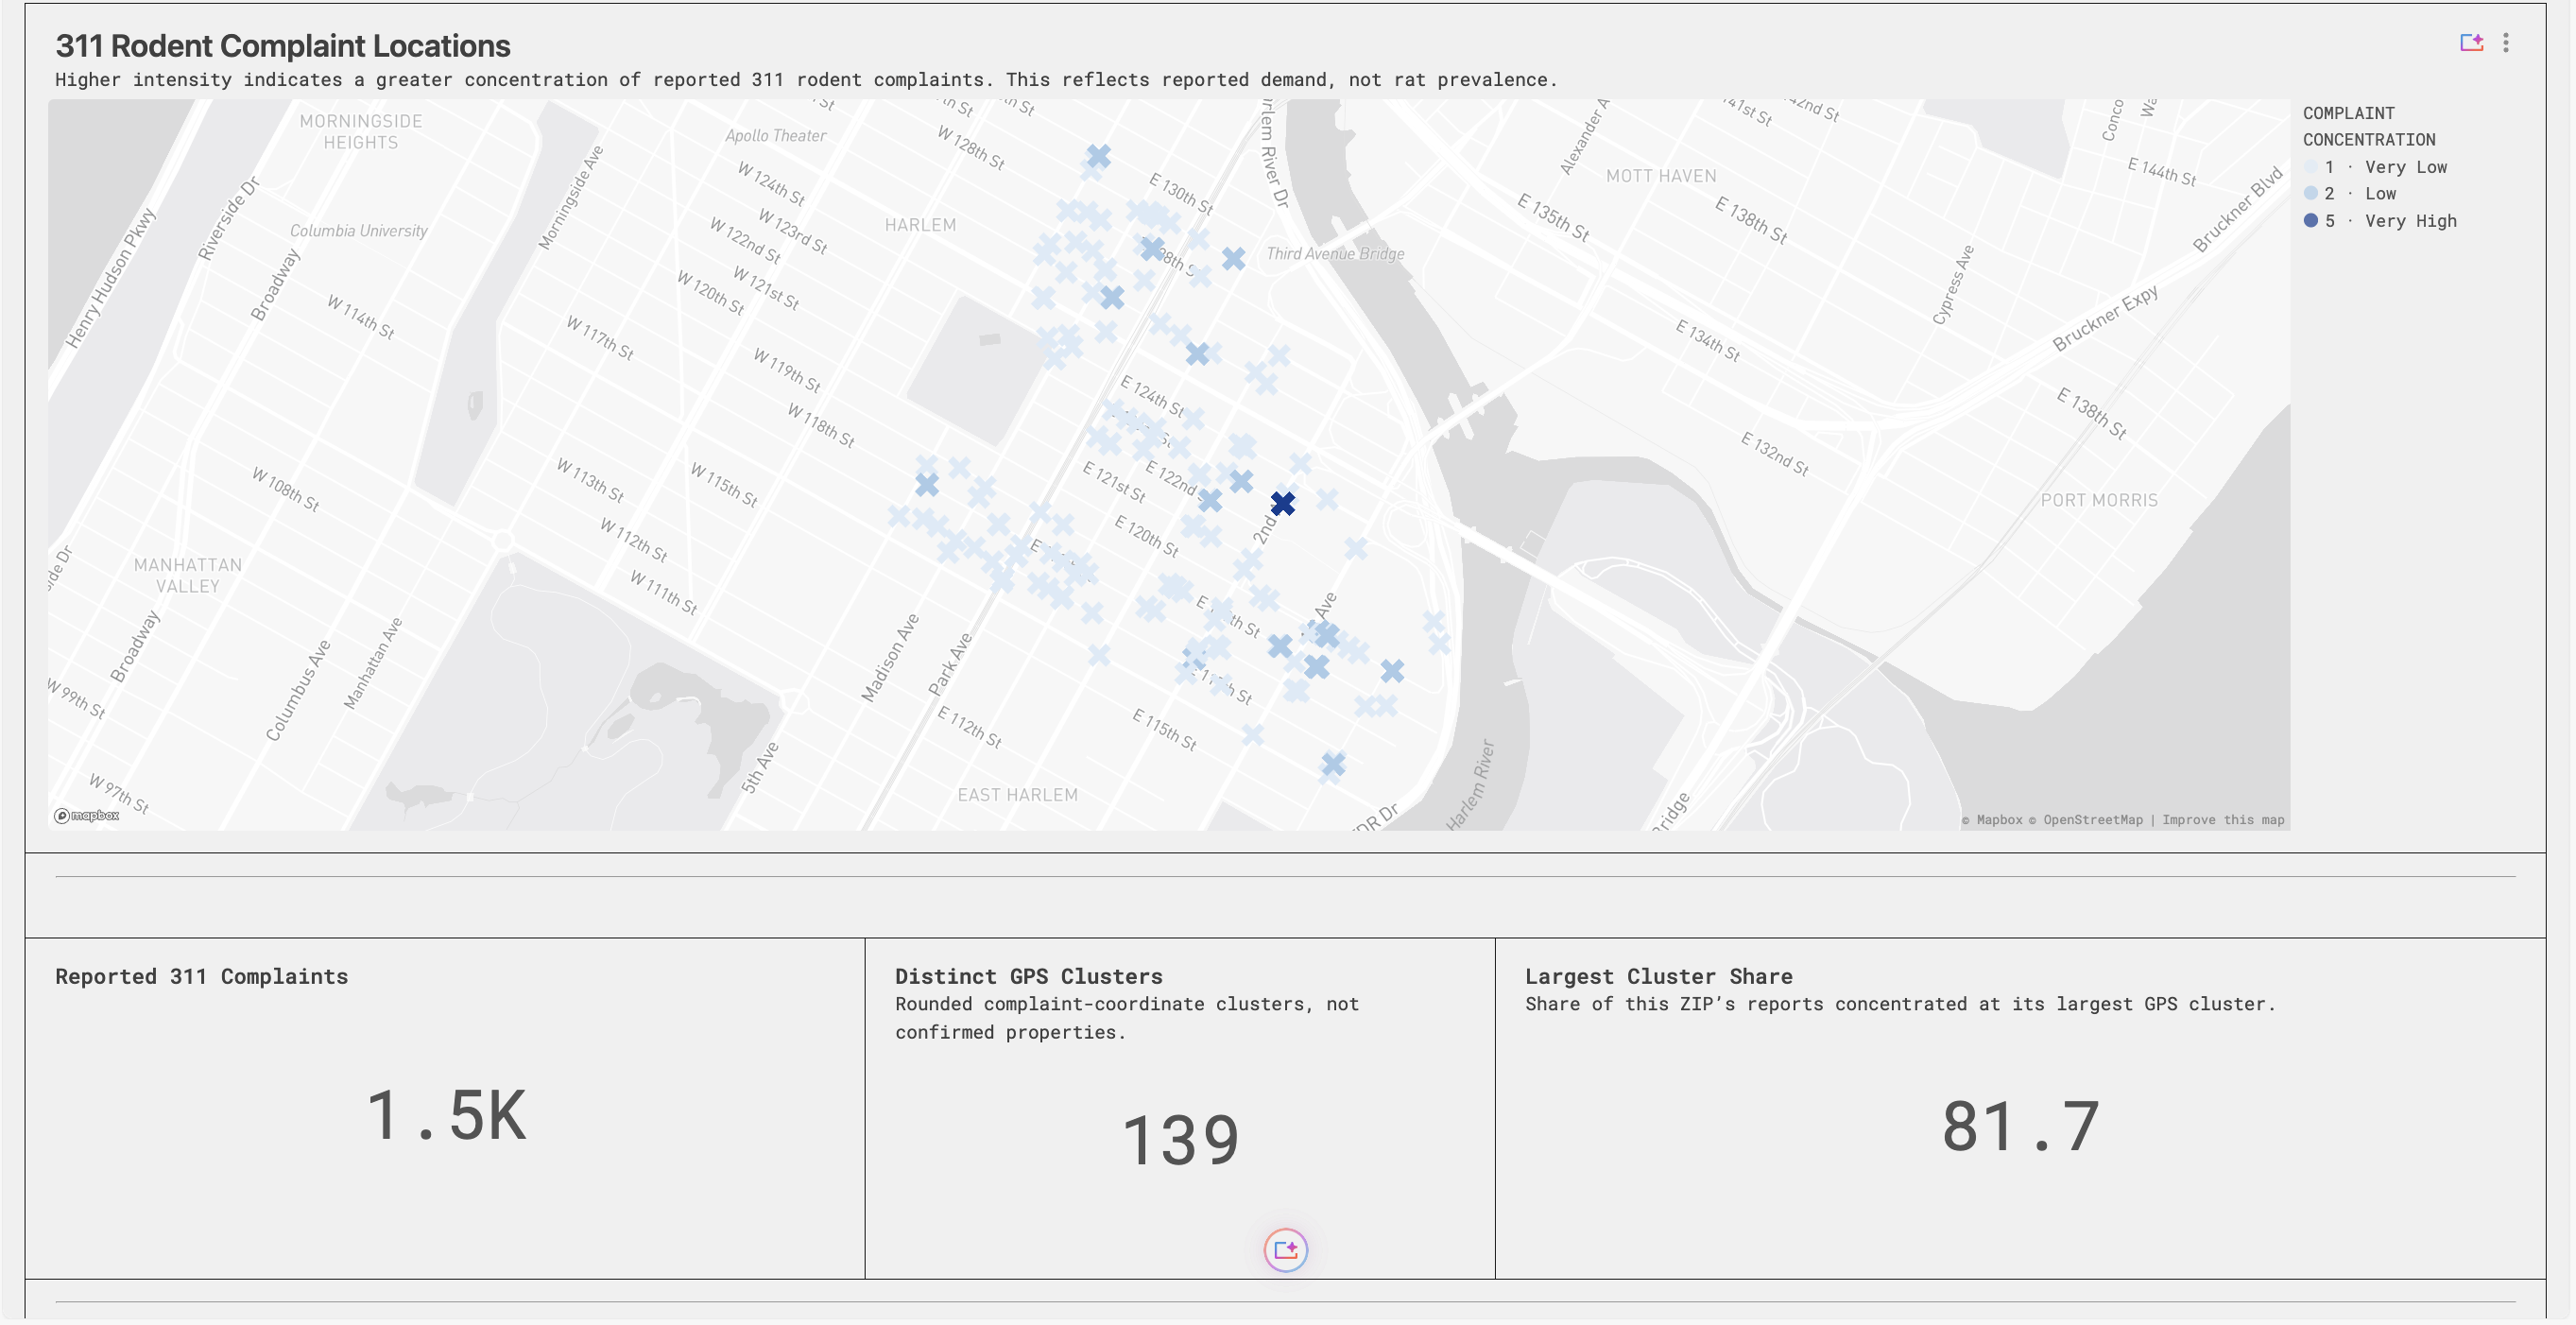
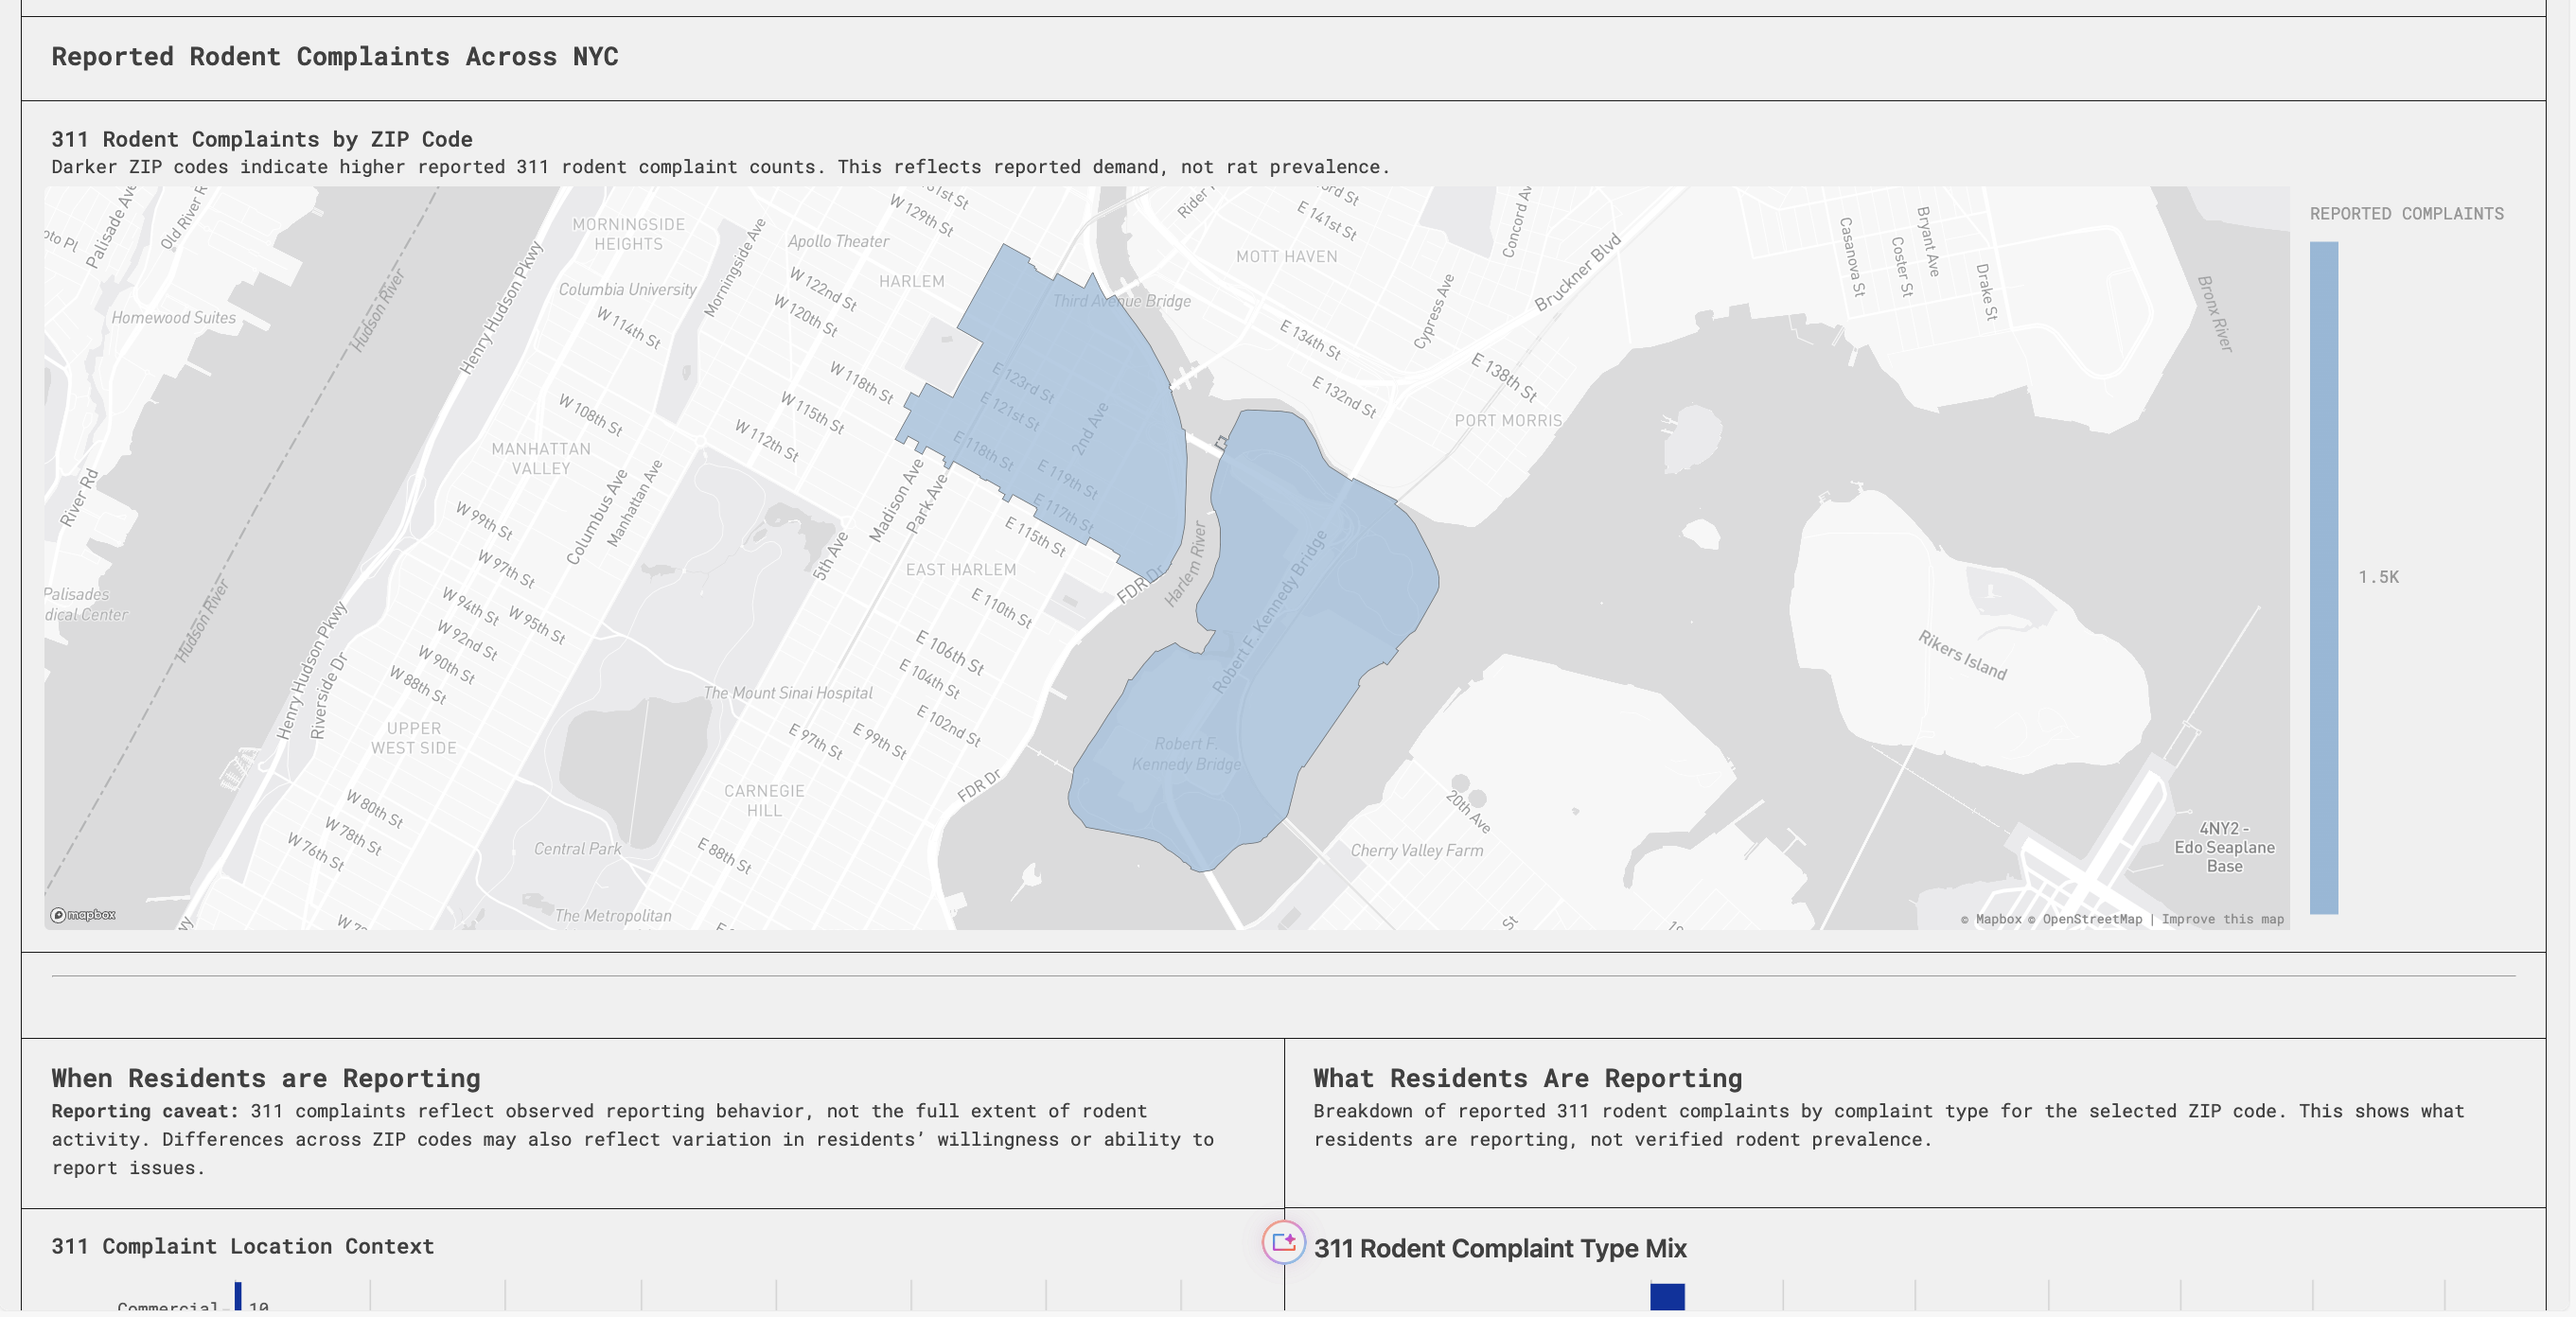
Detecting single-site dominance: GPS clustering revealed that 82% of ZIP 10035's 1,501 complaints come from a single coordinate. Without this, it looks like the worst ZIP in the city. With it: one site, not a cursed neighborhood.
Structured our caveats as data: 29 limitations live in a queryable table. Genie cites them directly instead of guessing. 311 measures who calls, not where rats are. Closed is a timestamp, not proof of a visit.
Describing every column: 56 columns with plain-English comments, plus a glossary table defining every technical term for non-analysts.
4. DATA CAVEATS
Our analysis can’t do the following:
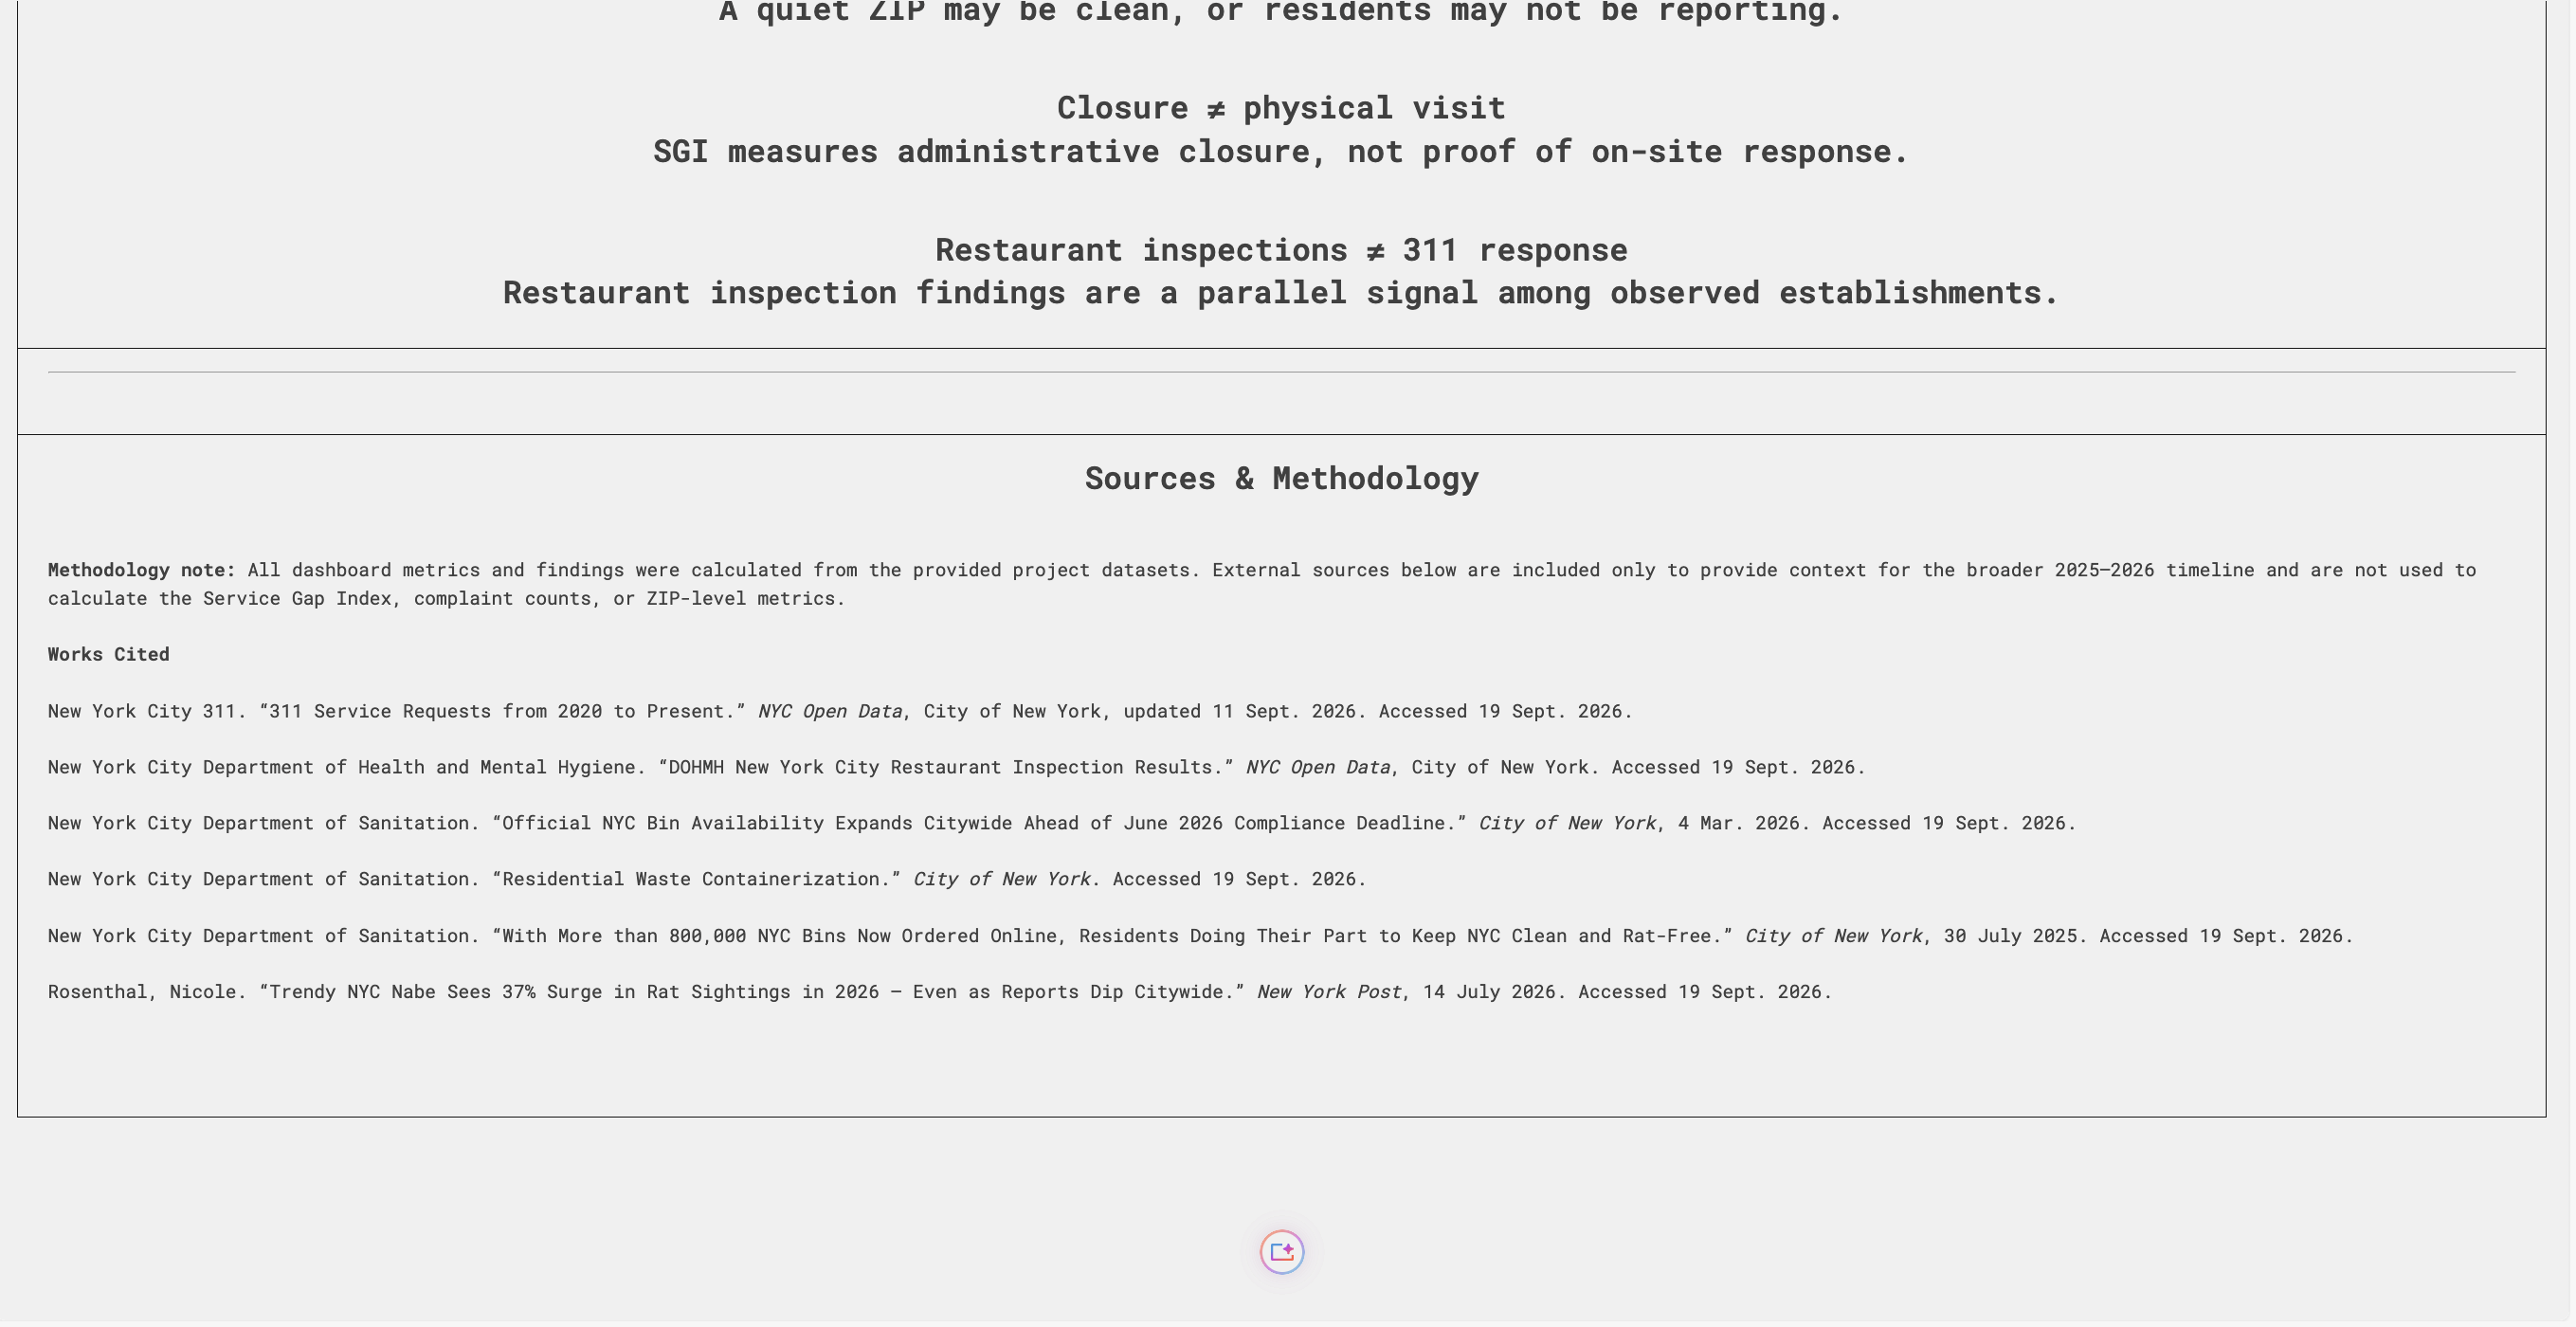
First, SGI-30 measures the paperwork, not the rats. A closed ticket is a timestamp, not proof that someone showed up. About 22,000 tickets close at the exact second they were opened.
Second, 311 measures who calls 311. Language, trust, tenure, and fear of a landlord all shape who files. A quiet ZIP may be clean, or it may have given up due to mistrust of the system.
Third, kitchen inspections are a separate city program. An inspection on Tuesday is not the response to Monday's 311 call. We kept them beside the index, not inside it. No causal arrows.
Fourth, not every ZIP code is a neighborhood. Some belong to a university or a hospital. No residents means no one to call 311.
Lastly, we have no data on population, income, or language. We cannot say whether the gaps follow demographic lines. Someone should check.
5. CONCLUSION
If I worked for the city, I would audit the 311 rodent closure pipeline starting from January 2025, because our data shows the citywide closure gap went from under 1% to 25% in twenty months, and that gap is concentrated in Queens and Staten Island, where people are still calling, but tickets are not closing.
To conclude, a simple chart is not a finding. A finding is something somebody could act on. The 311 Blind Spot is actionable: the pipeline slowed down; we can see when and where.
What’s next? Fixing the pipeline.


Log in or sign up for Devpost to join the conversation.