-
-
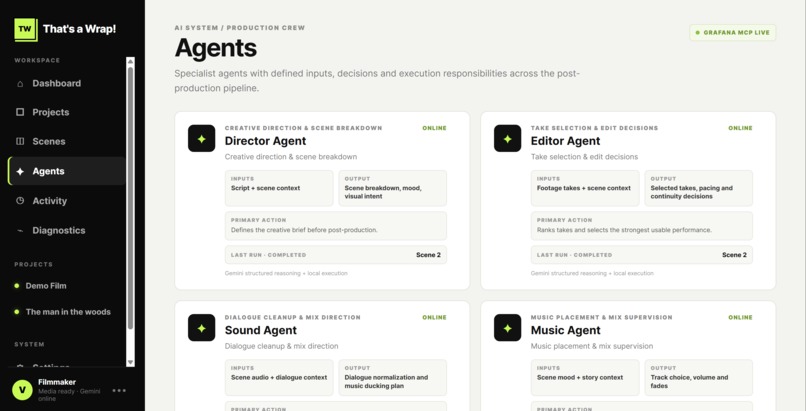
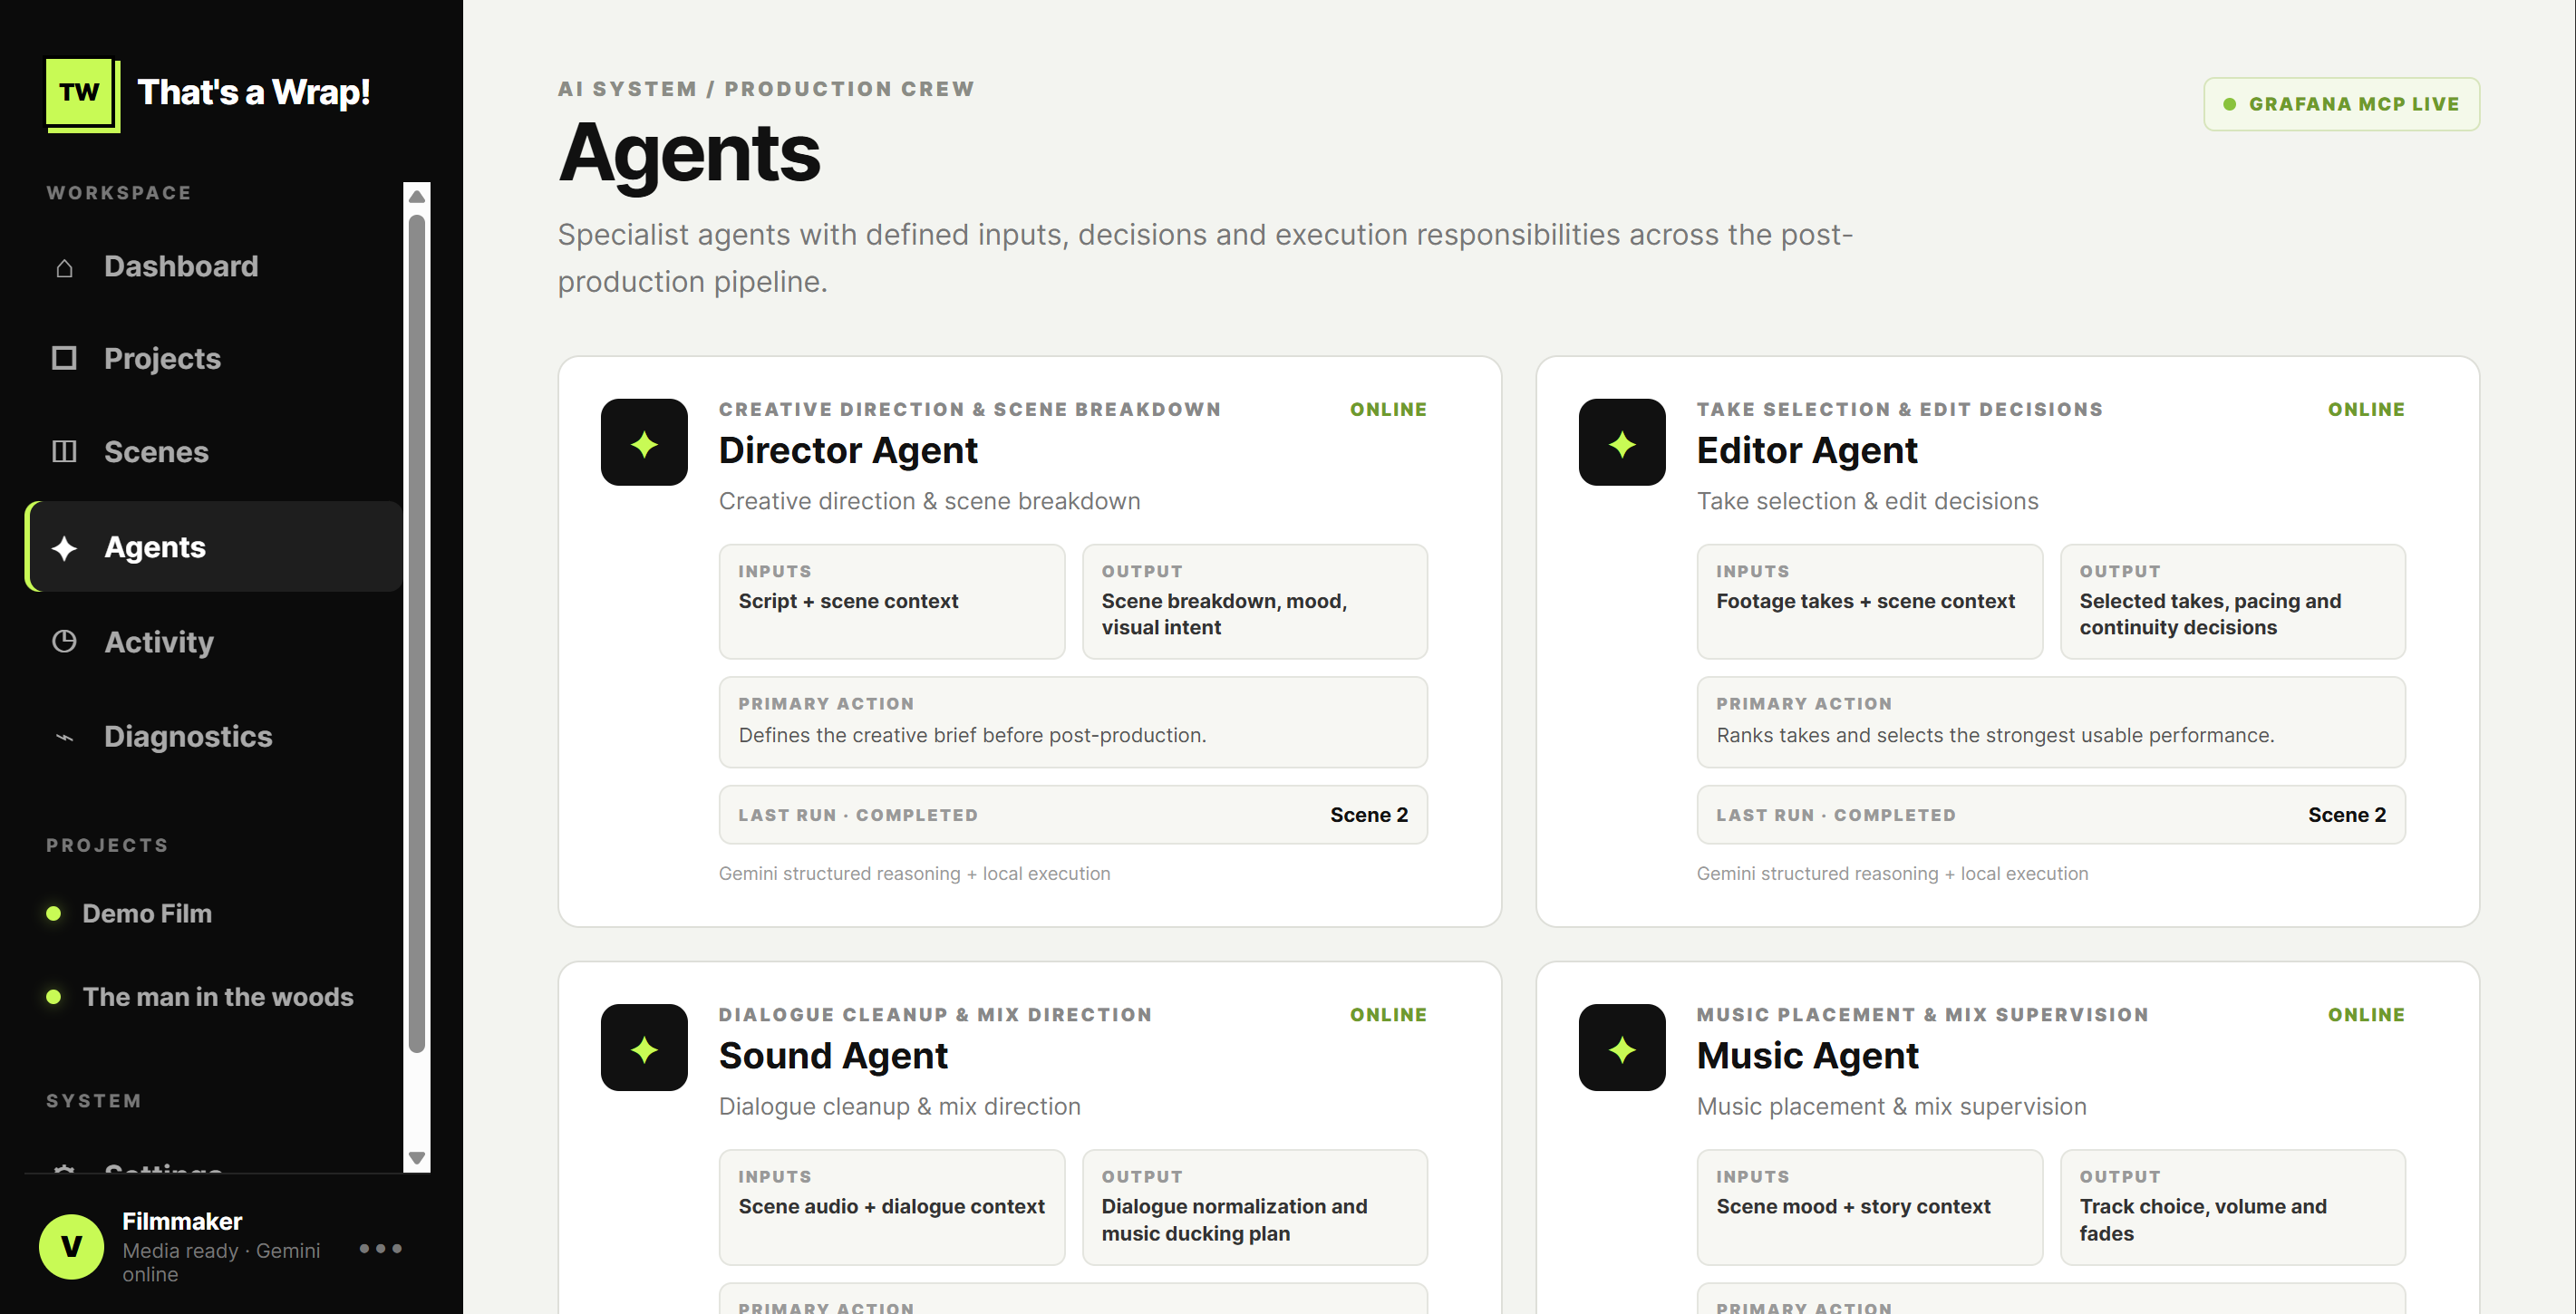
Agents dashboard
-
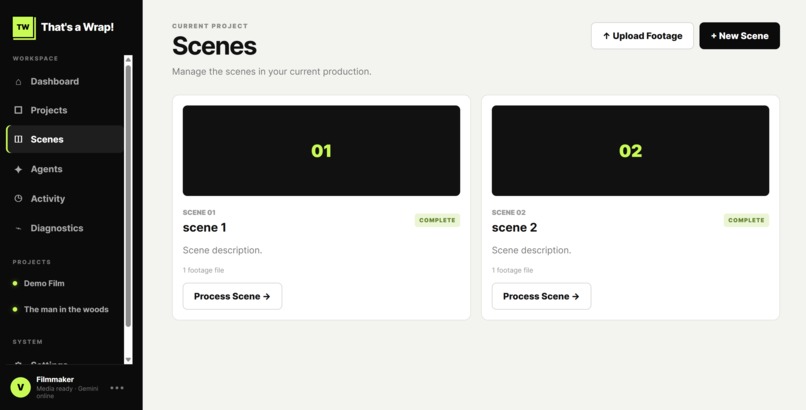
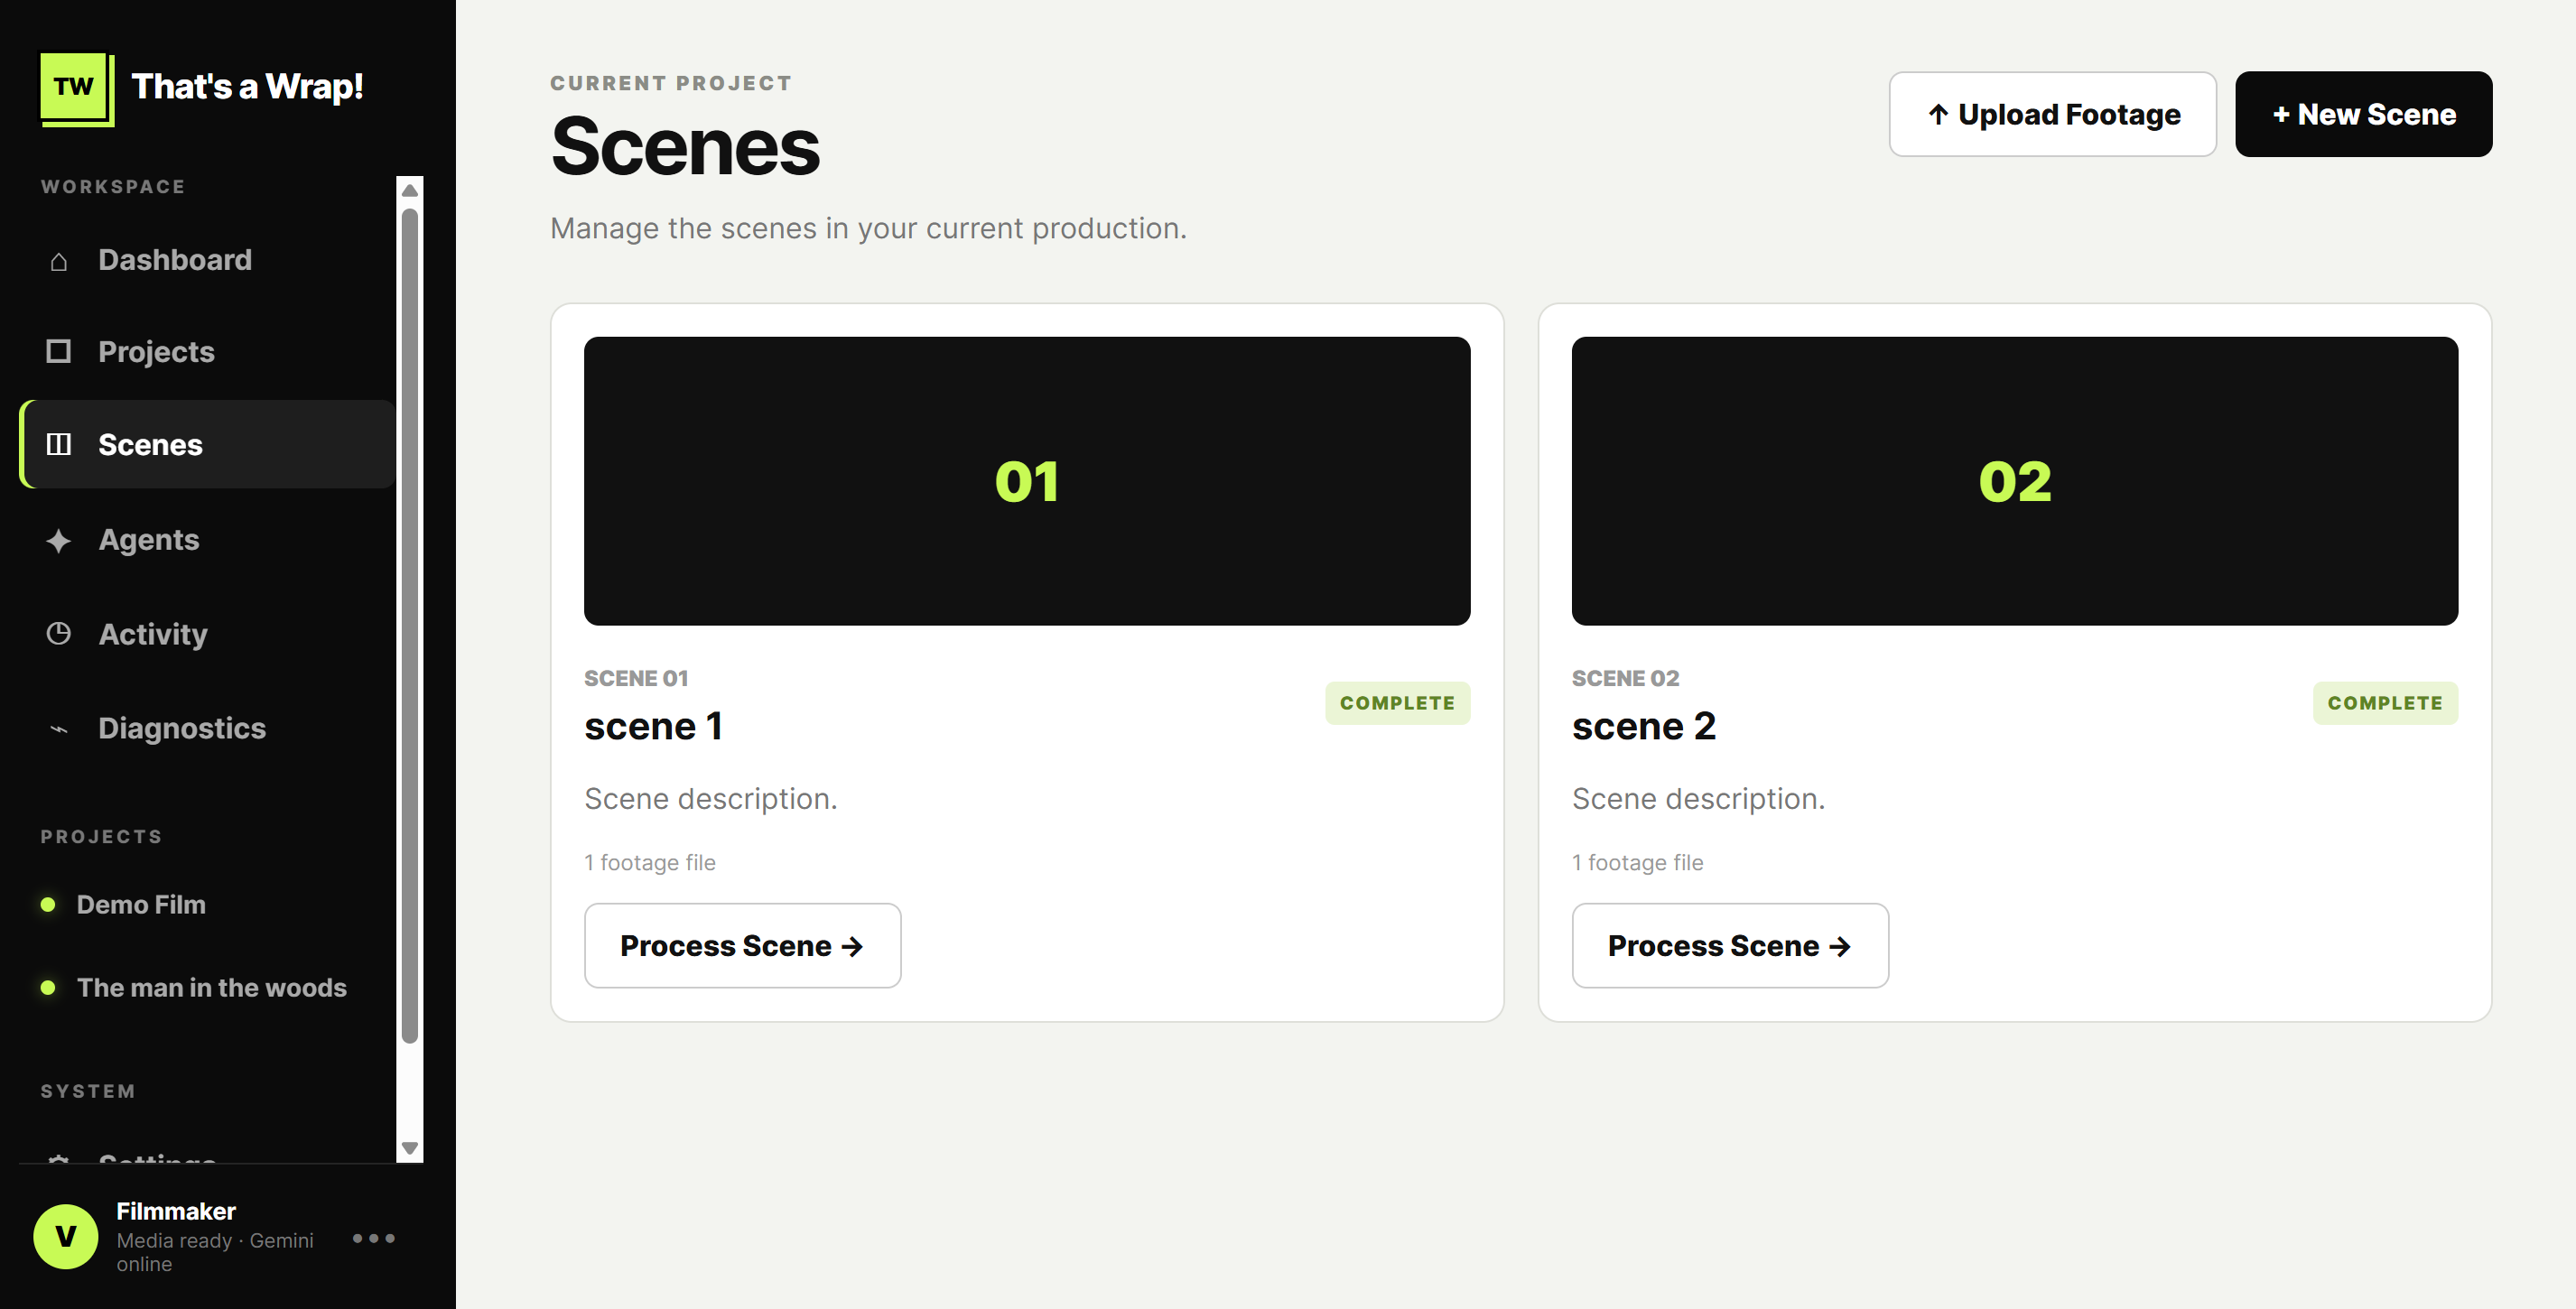
scenes
-
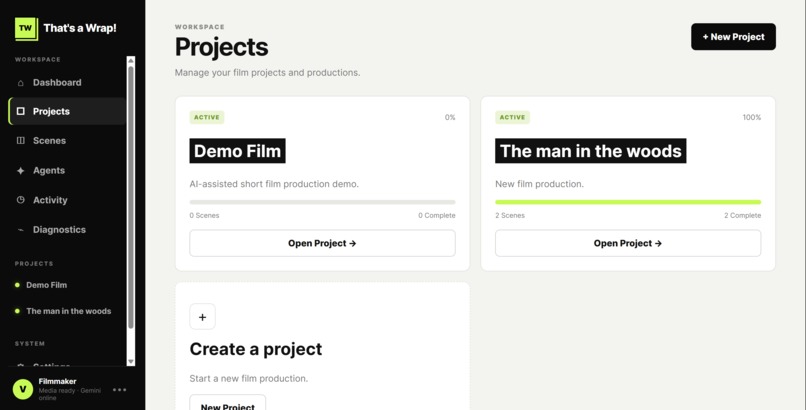
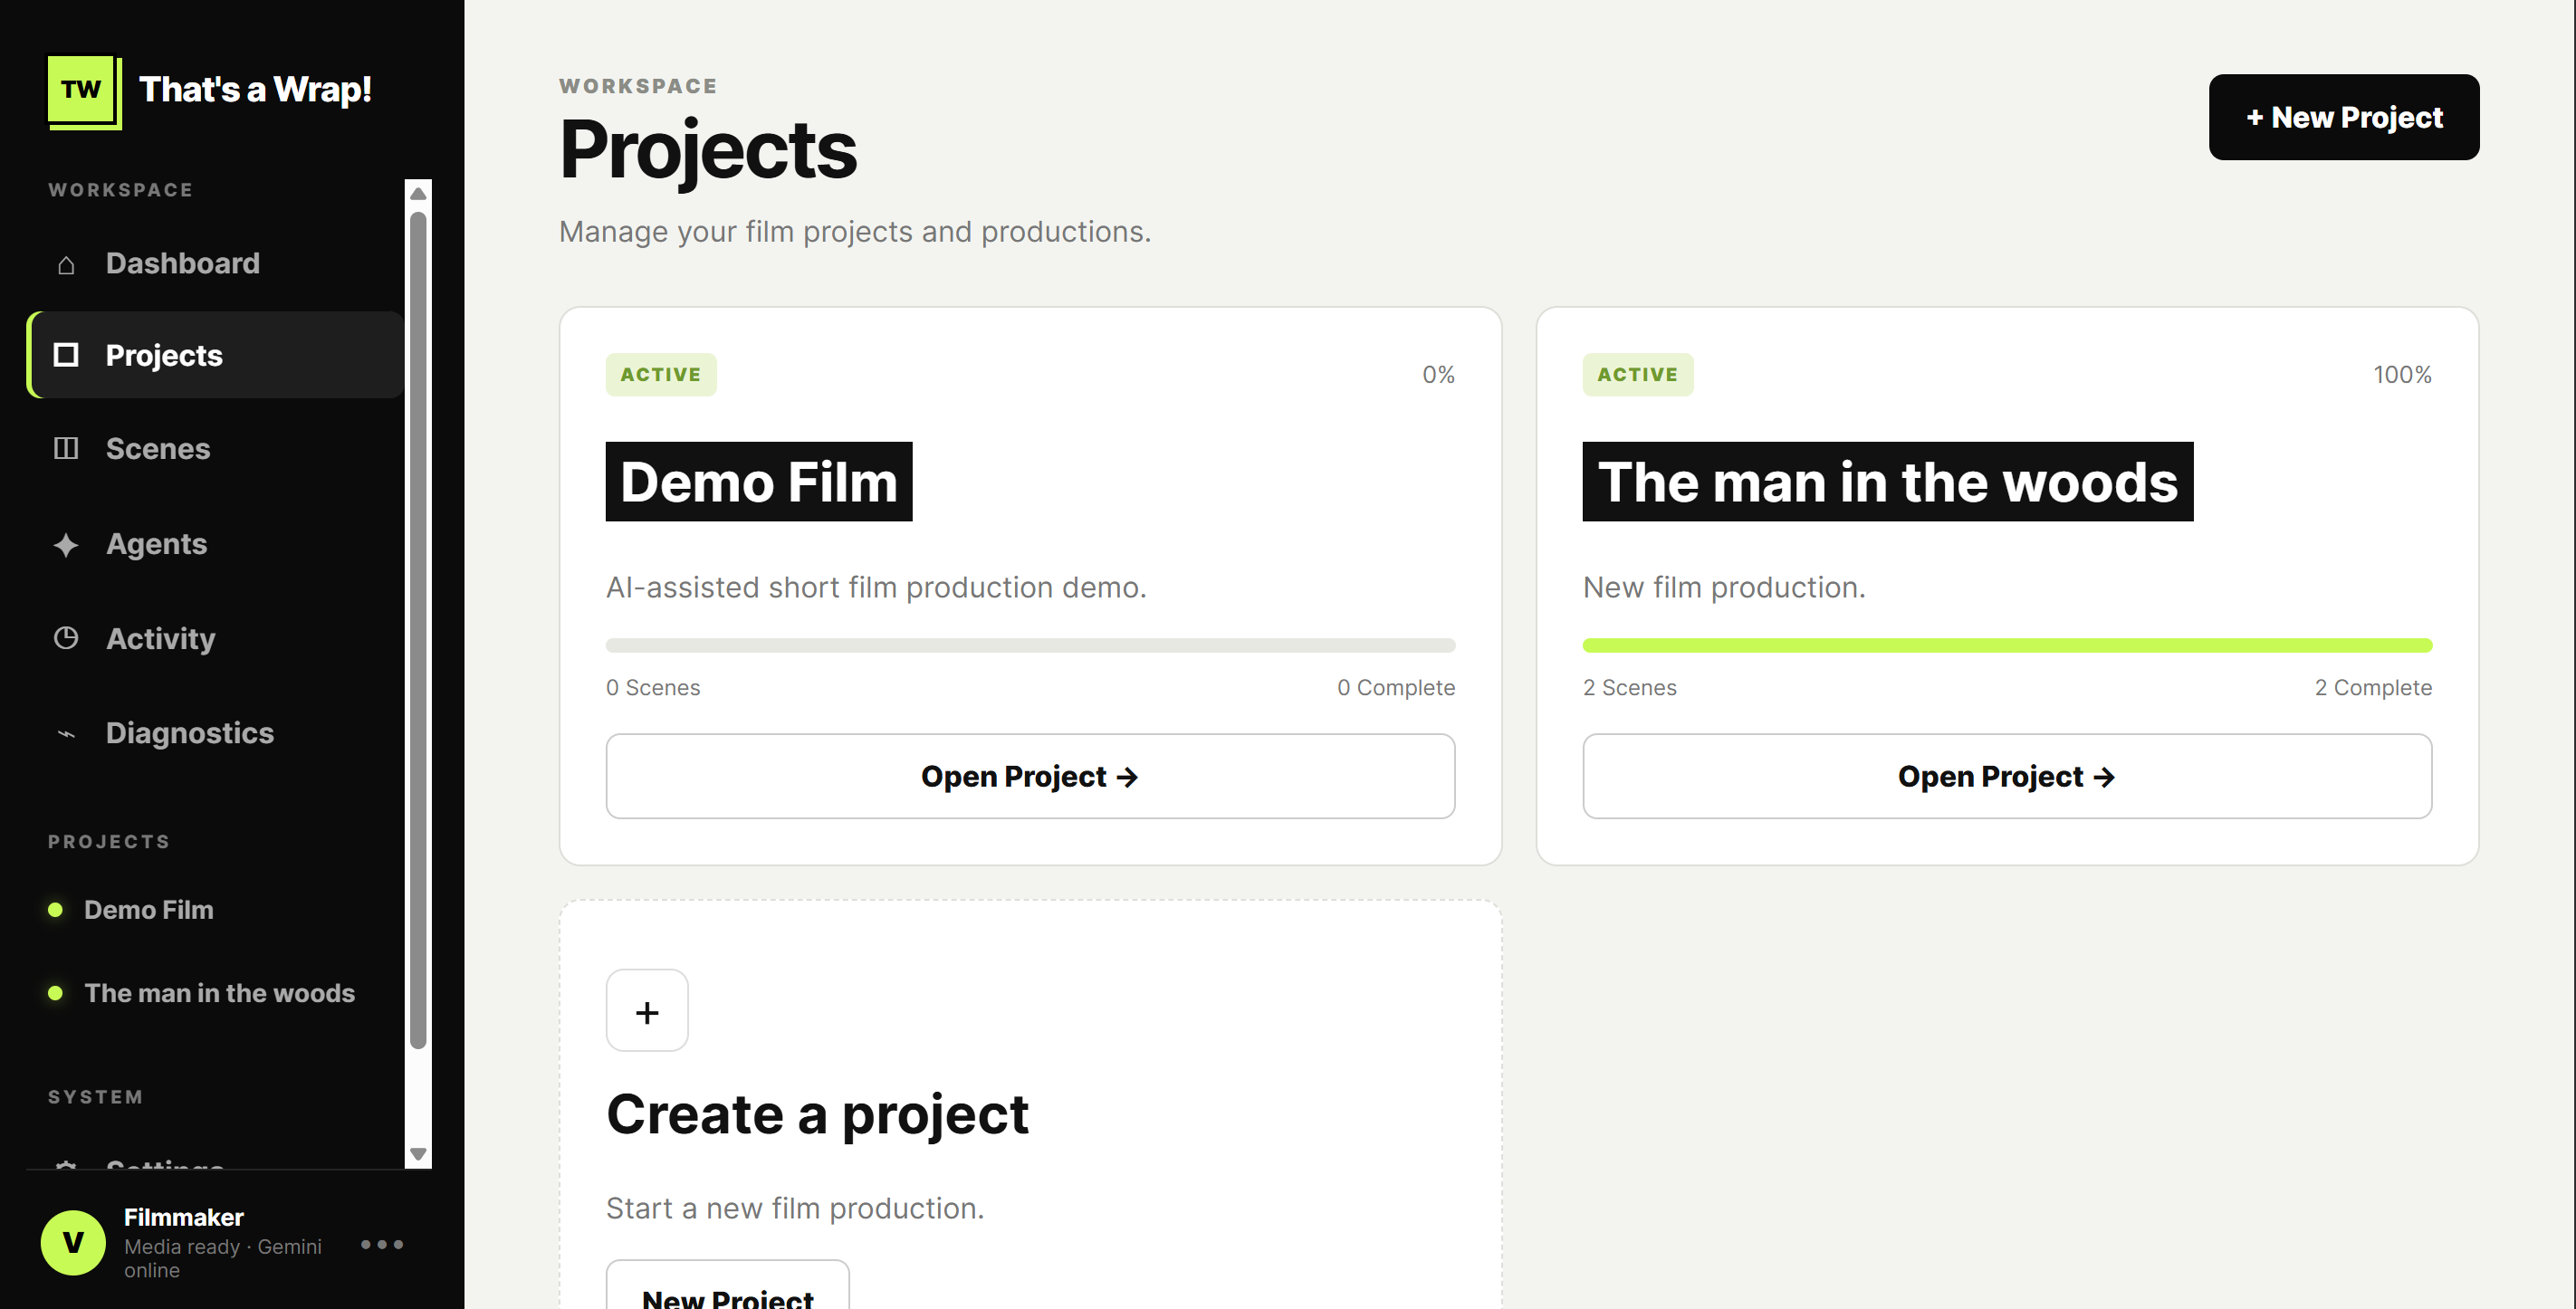
project page
-
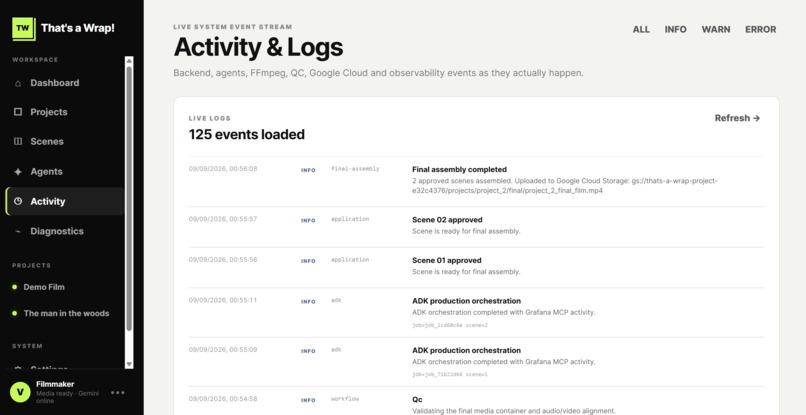
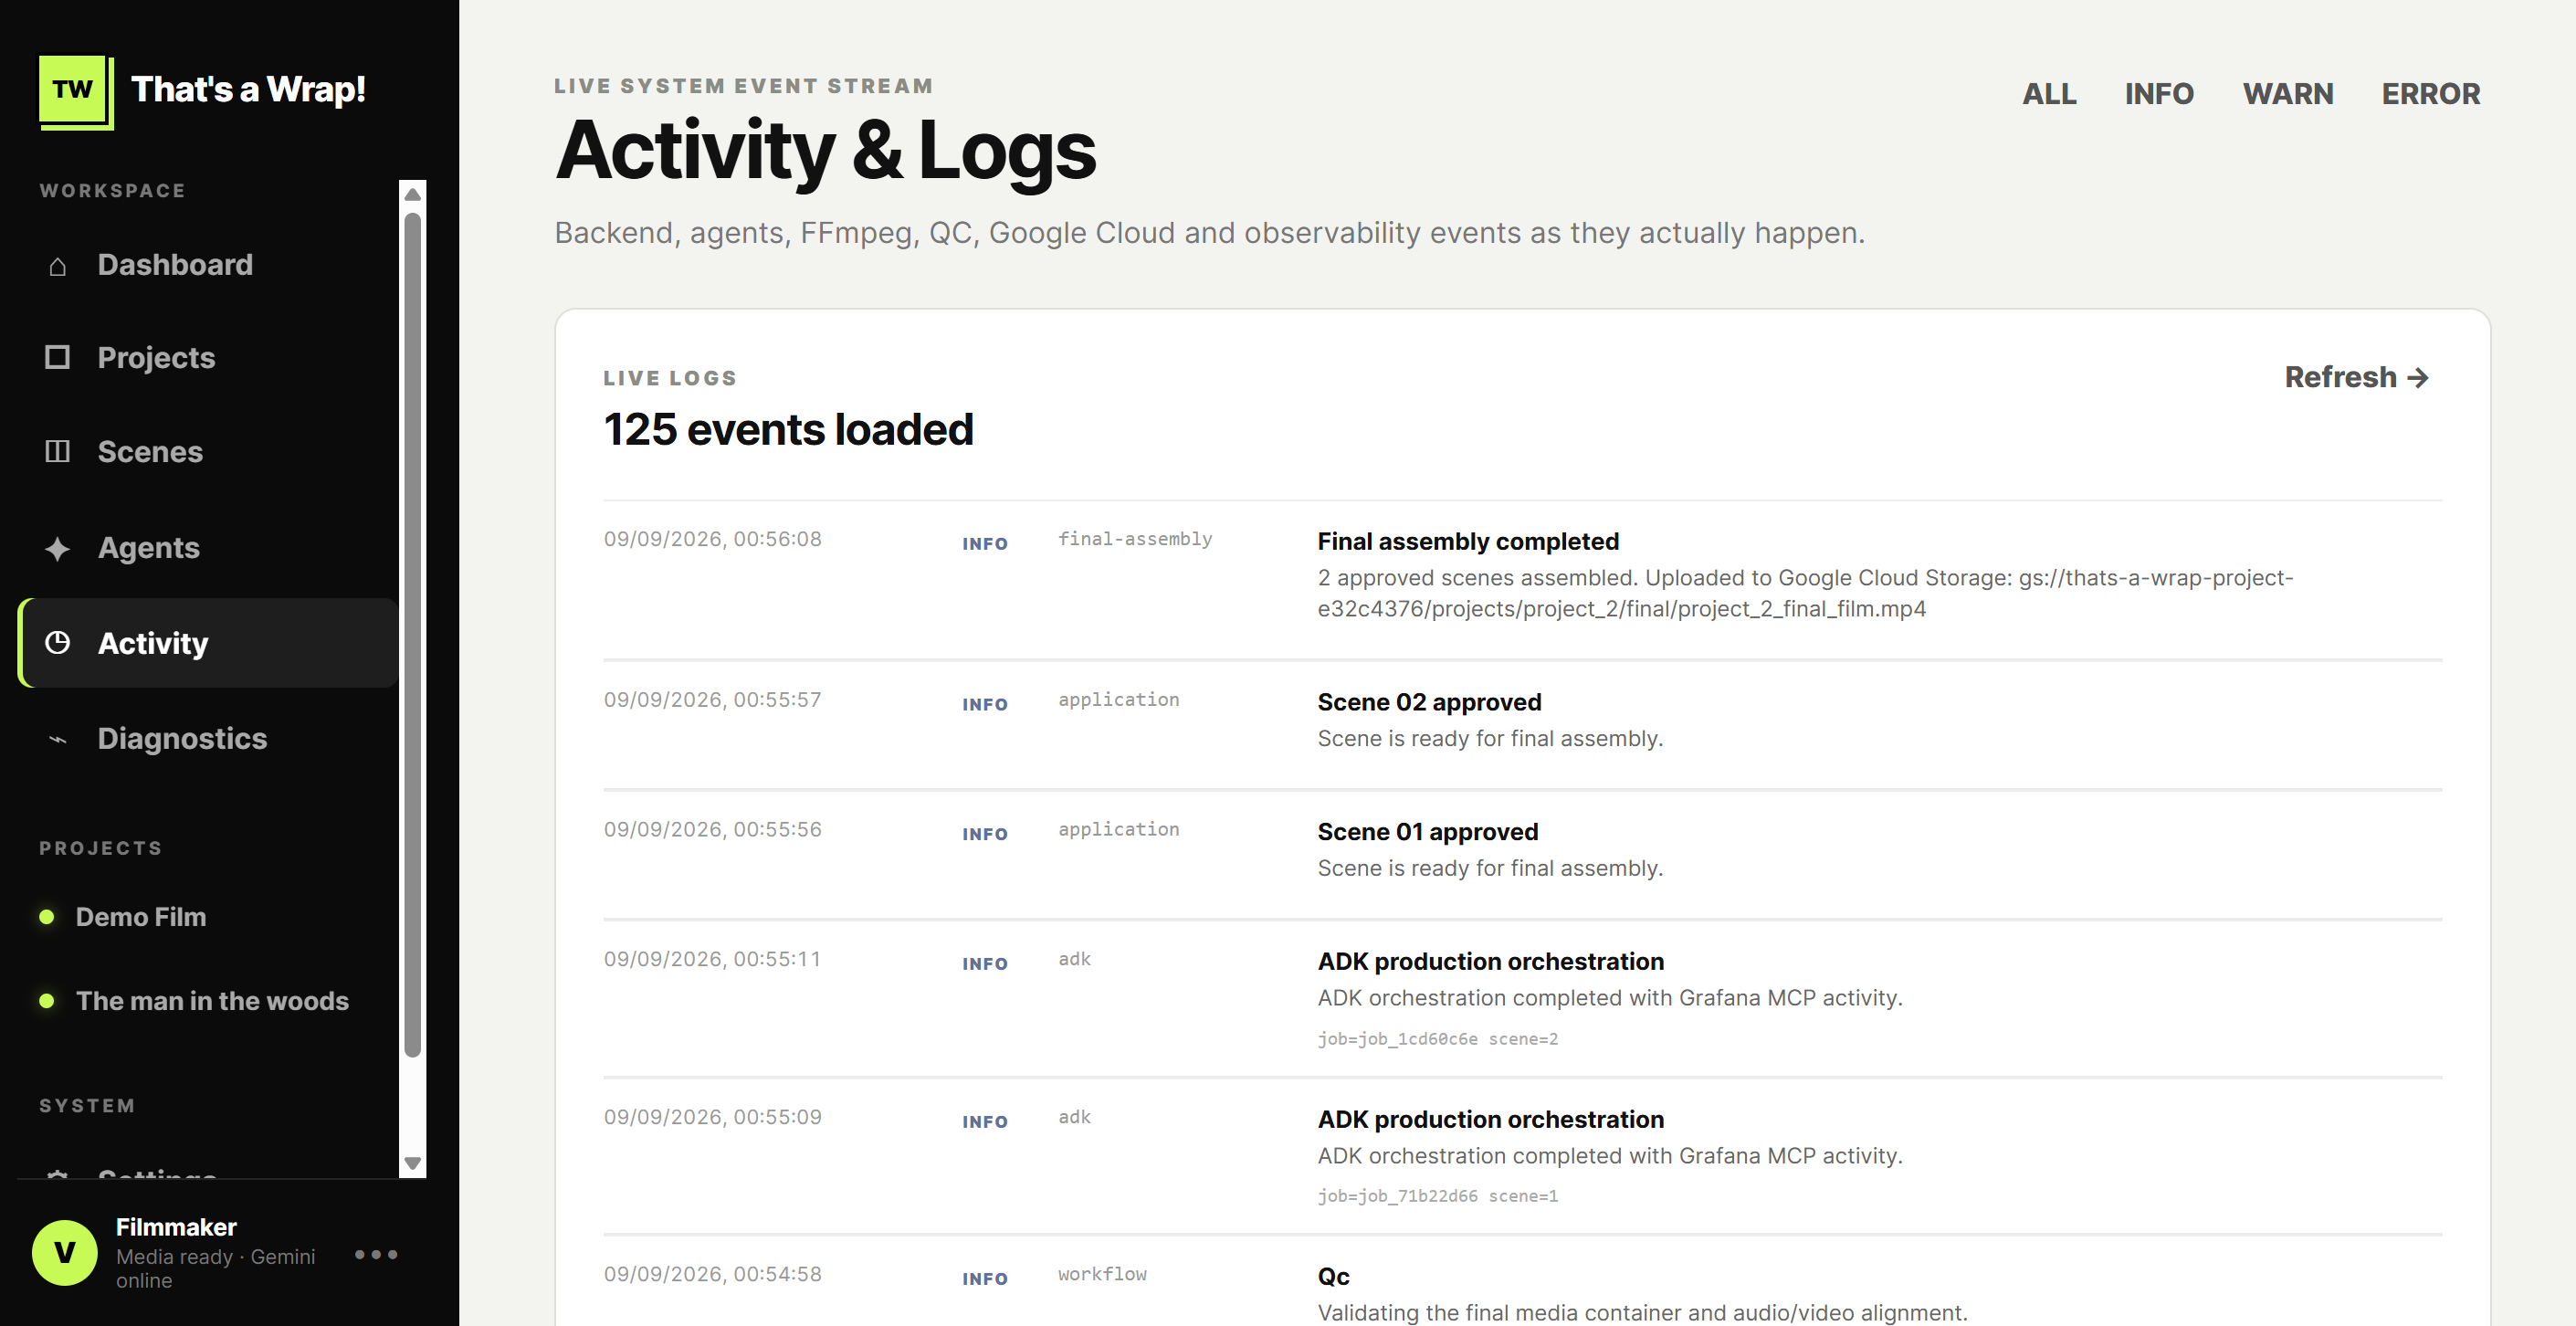
activity page
-
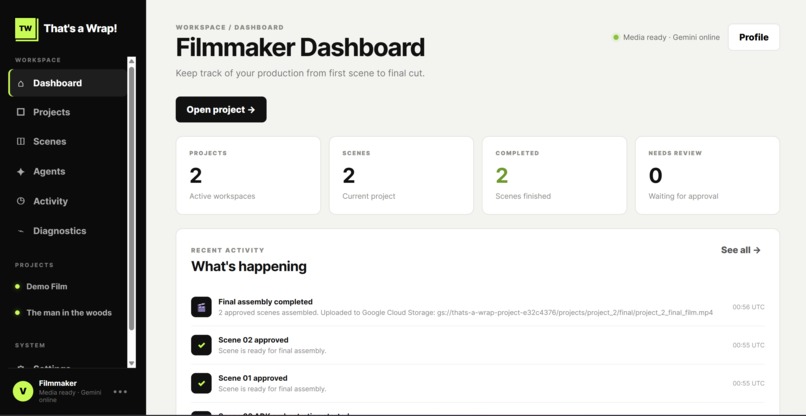
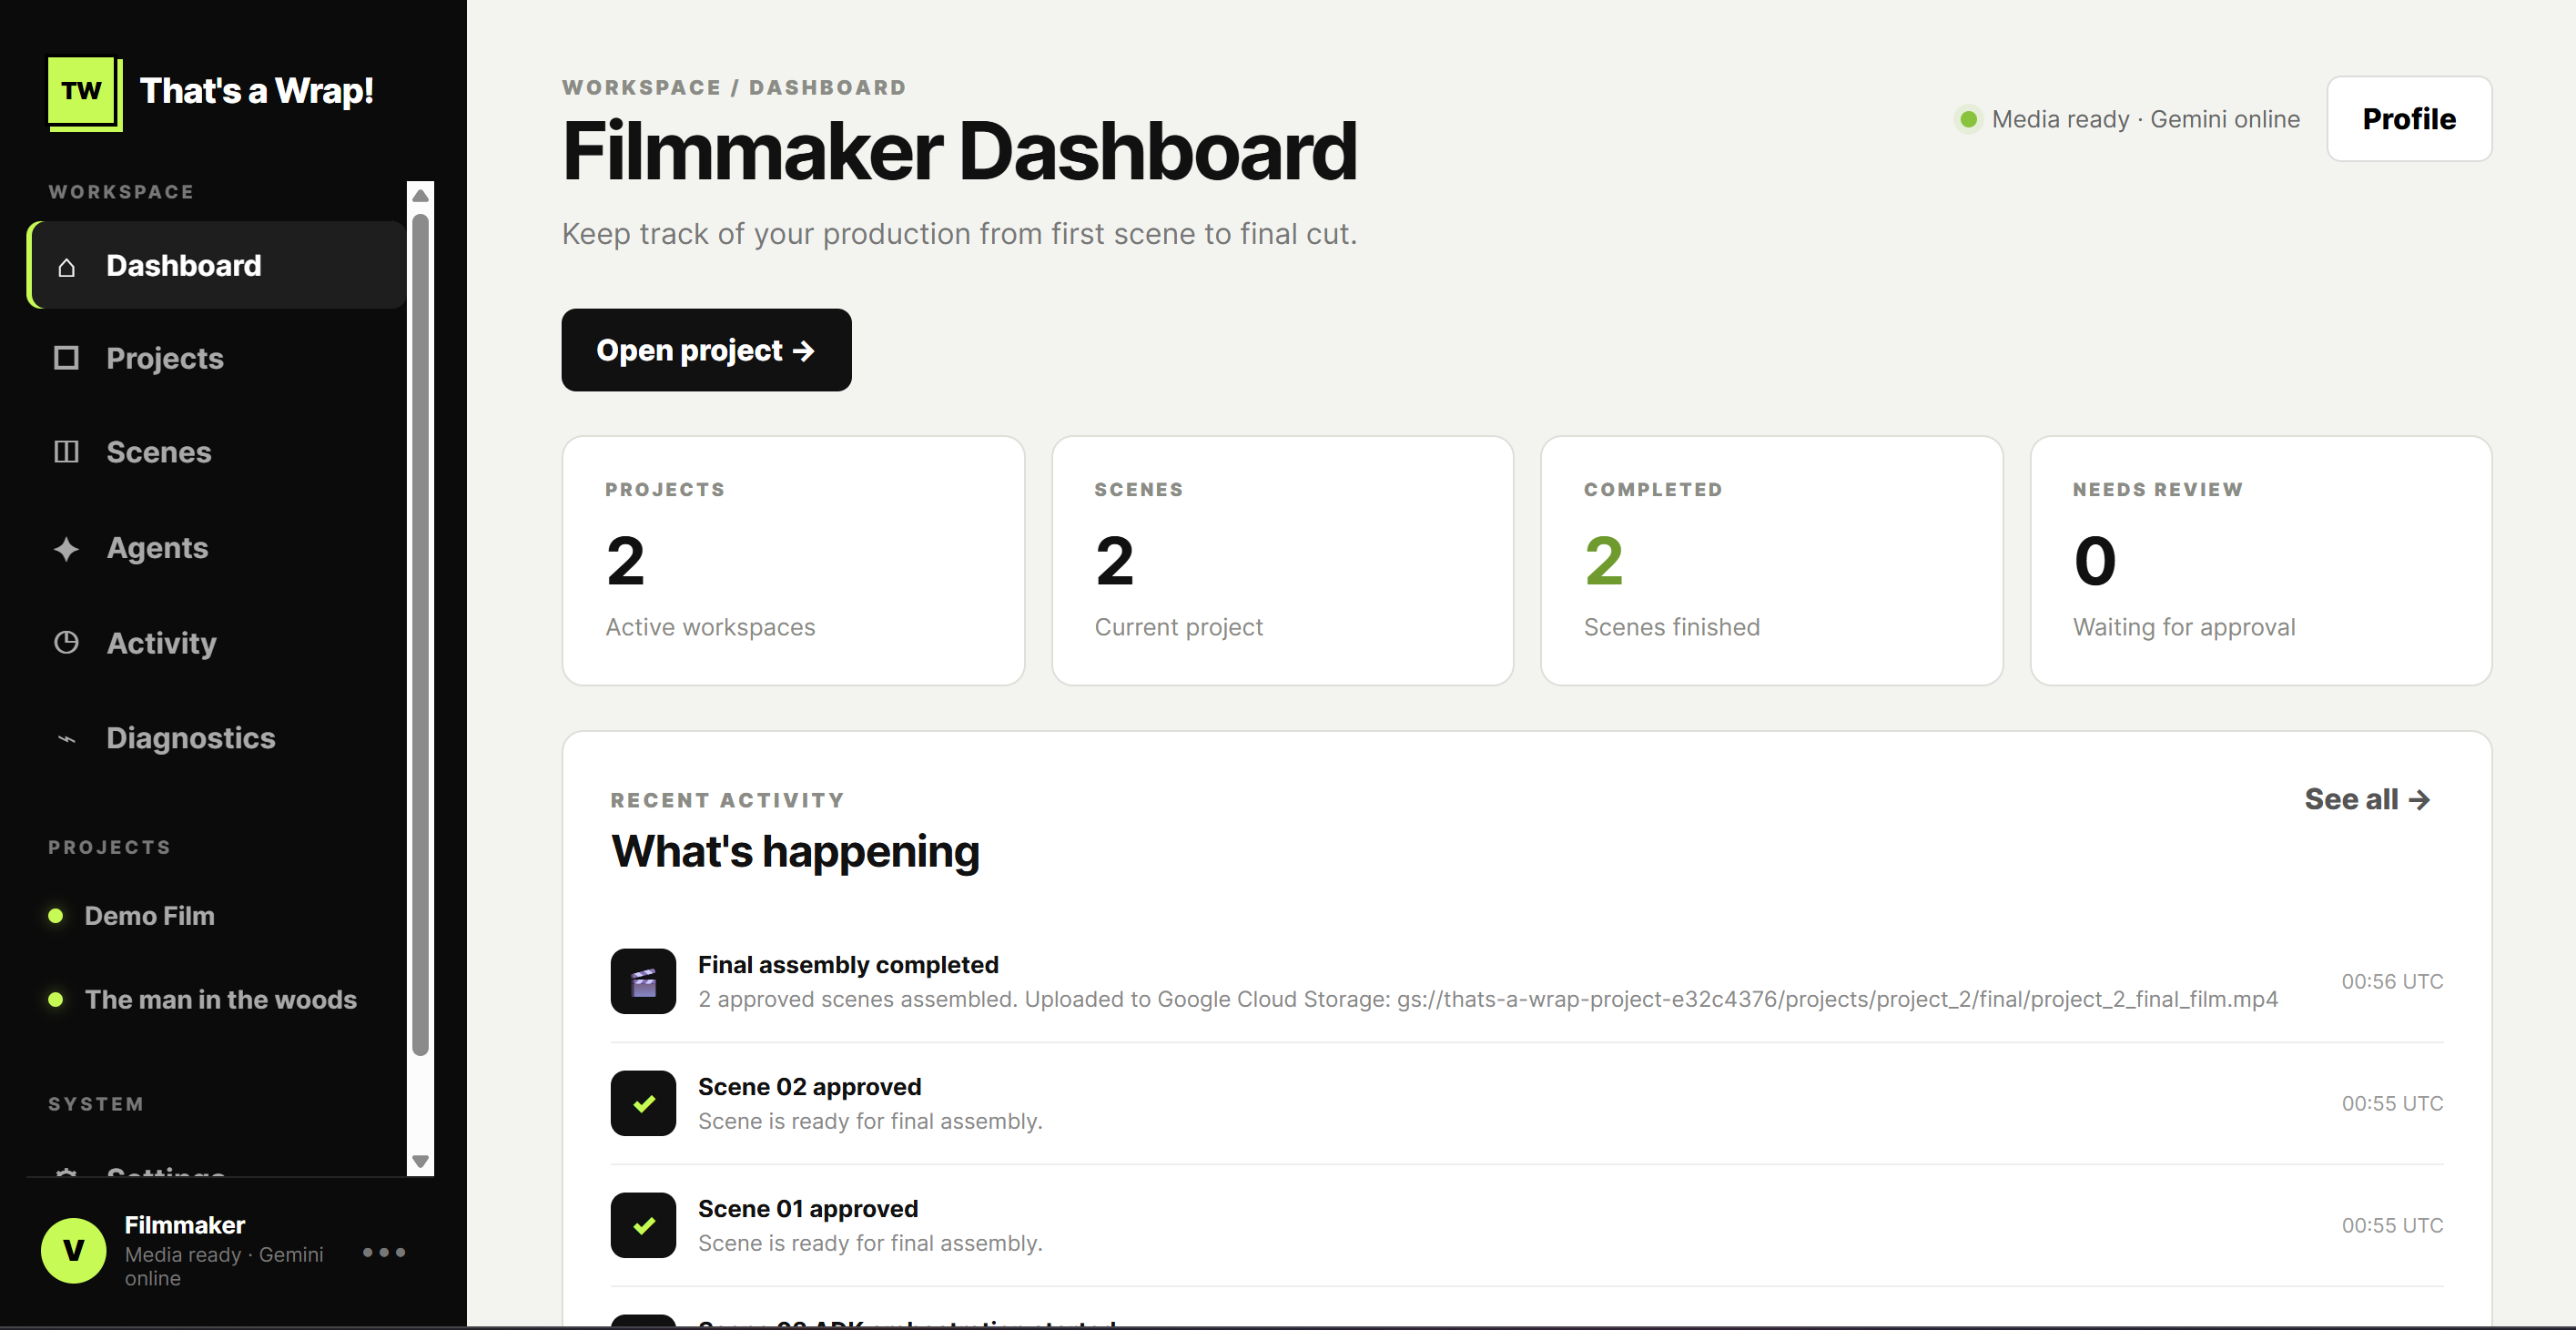
main dashboard
-
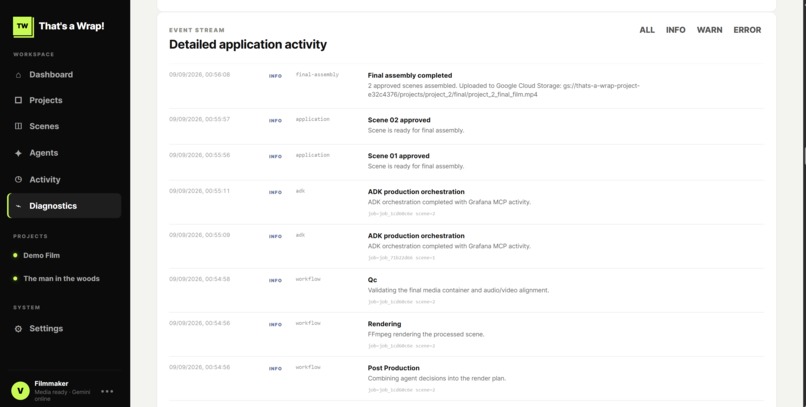
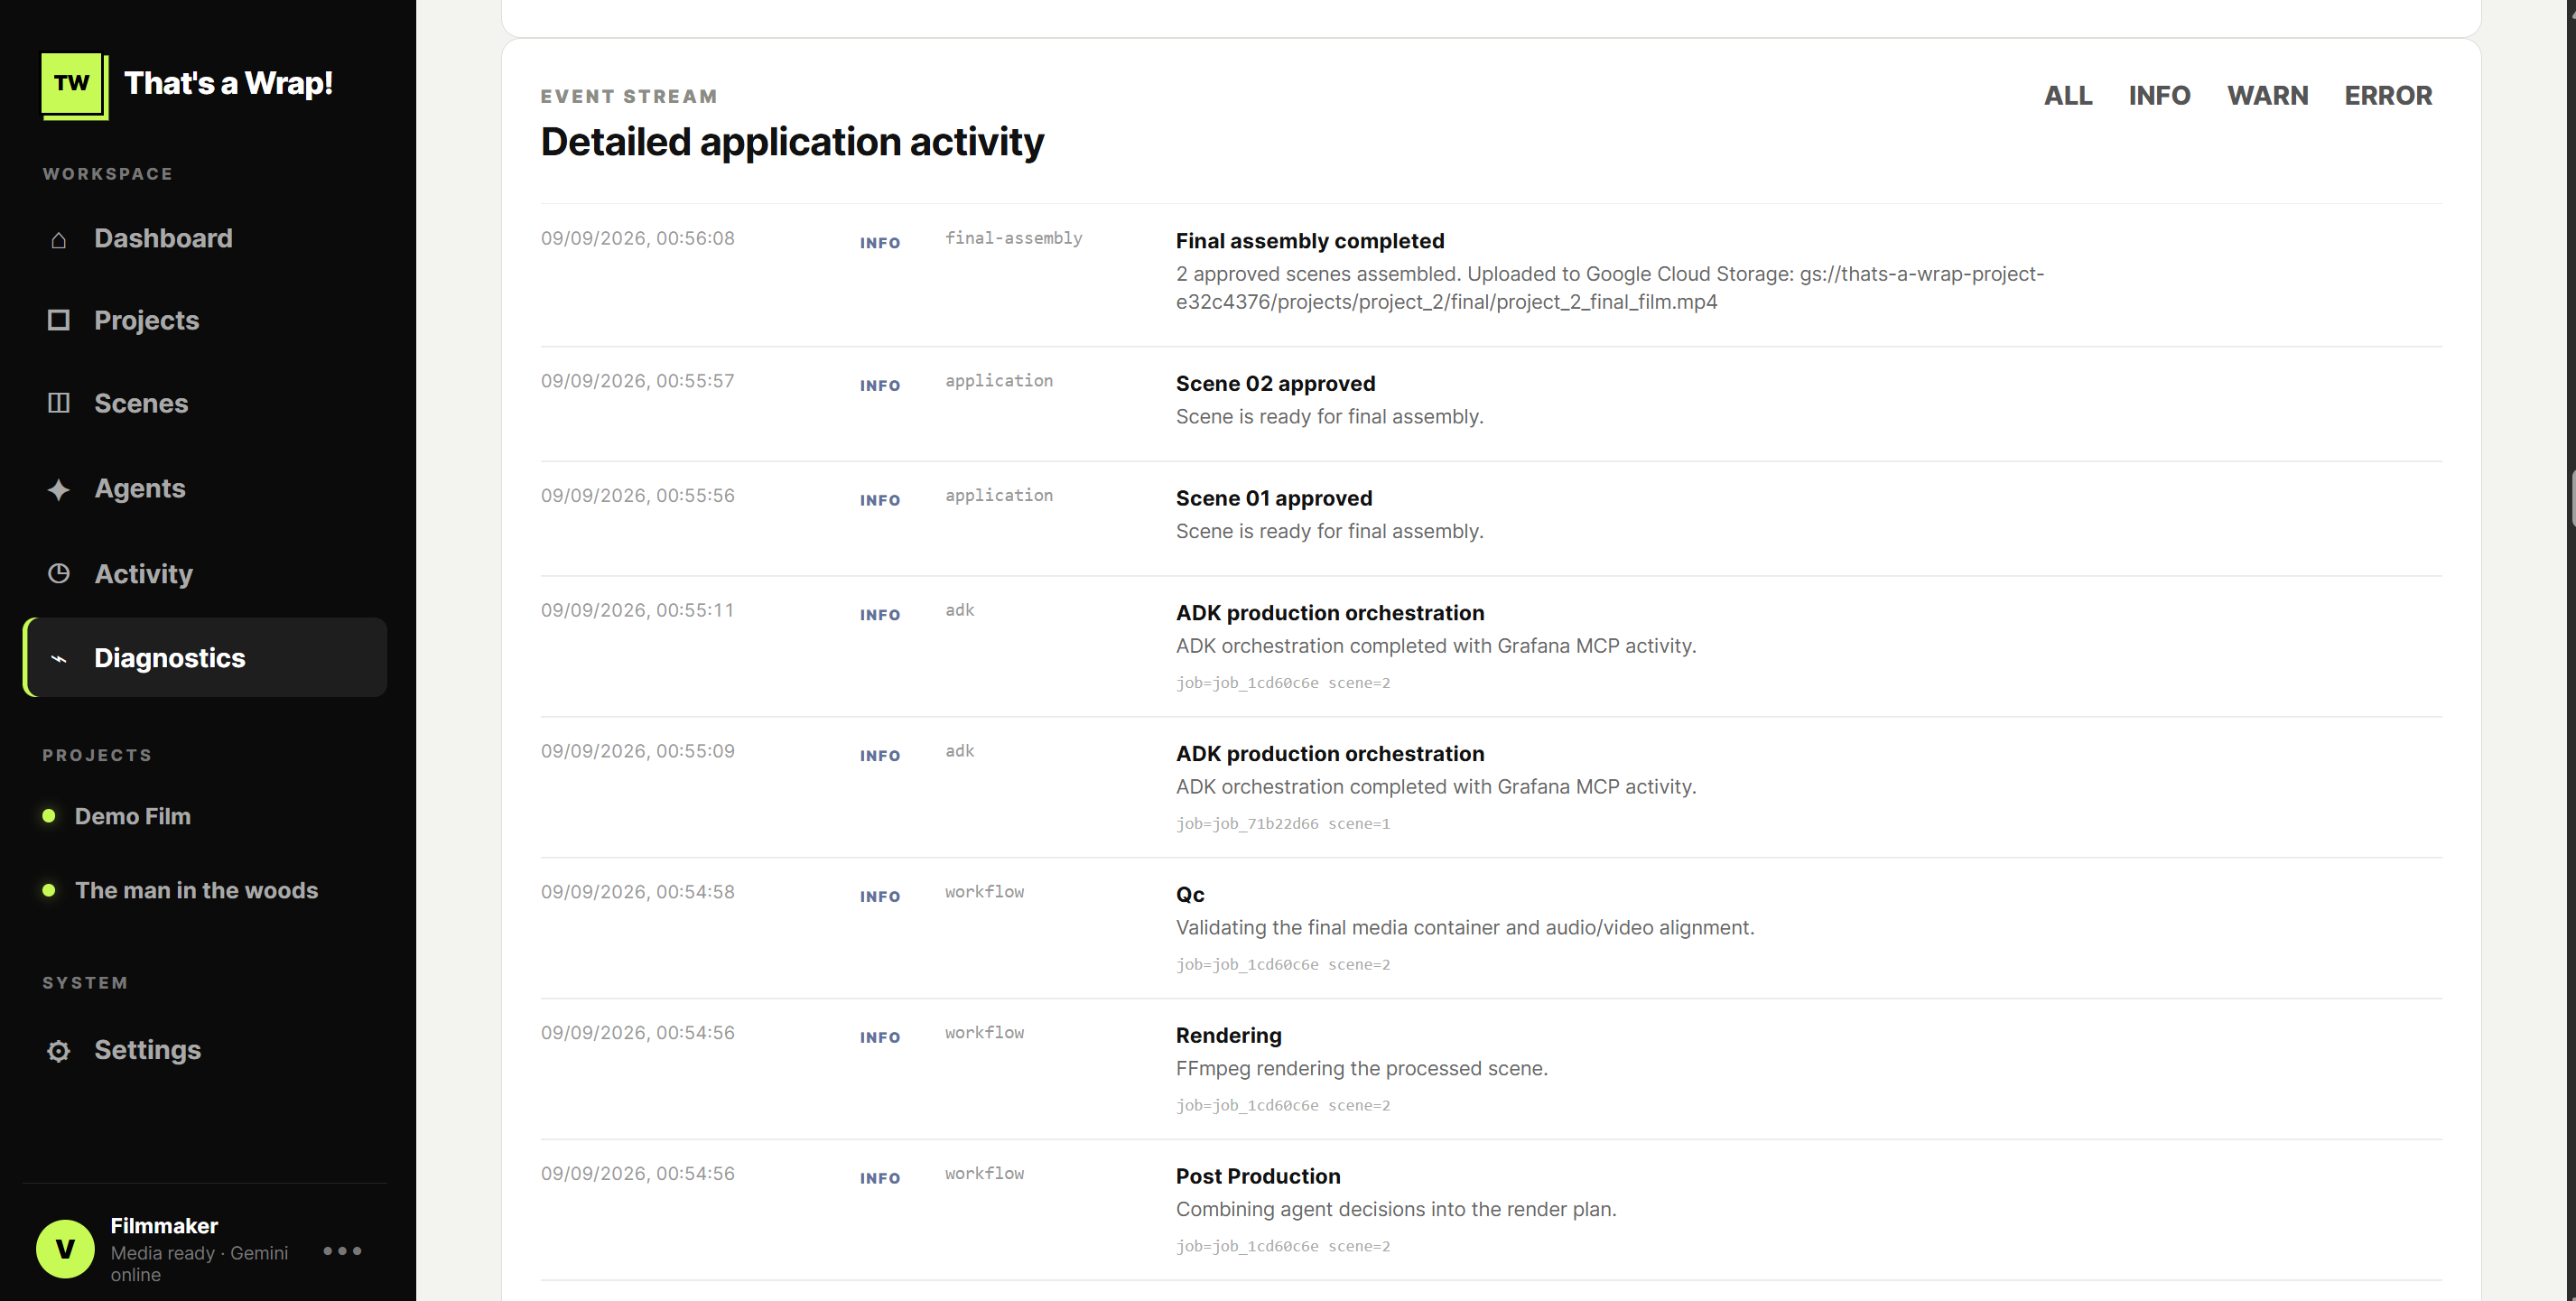
Application Activity page
-
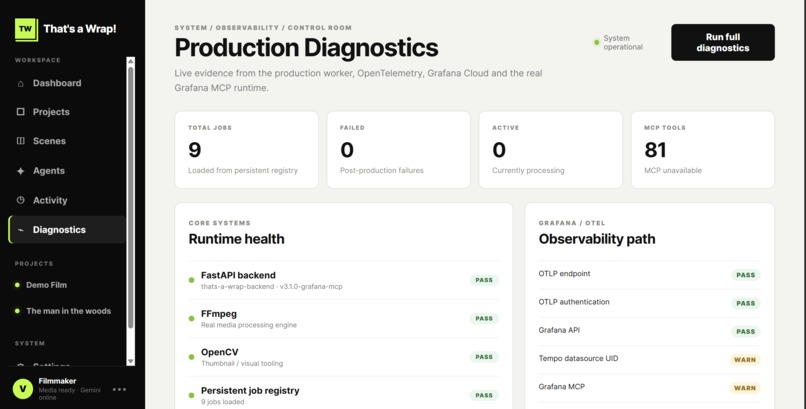
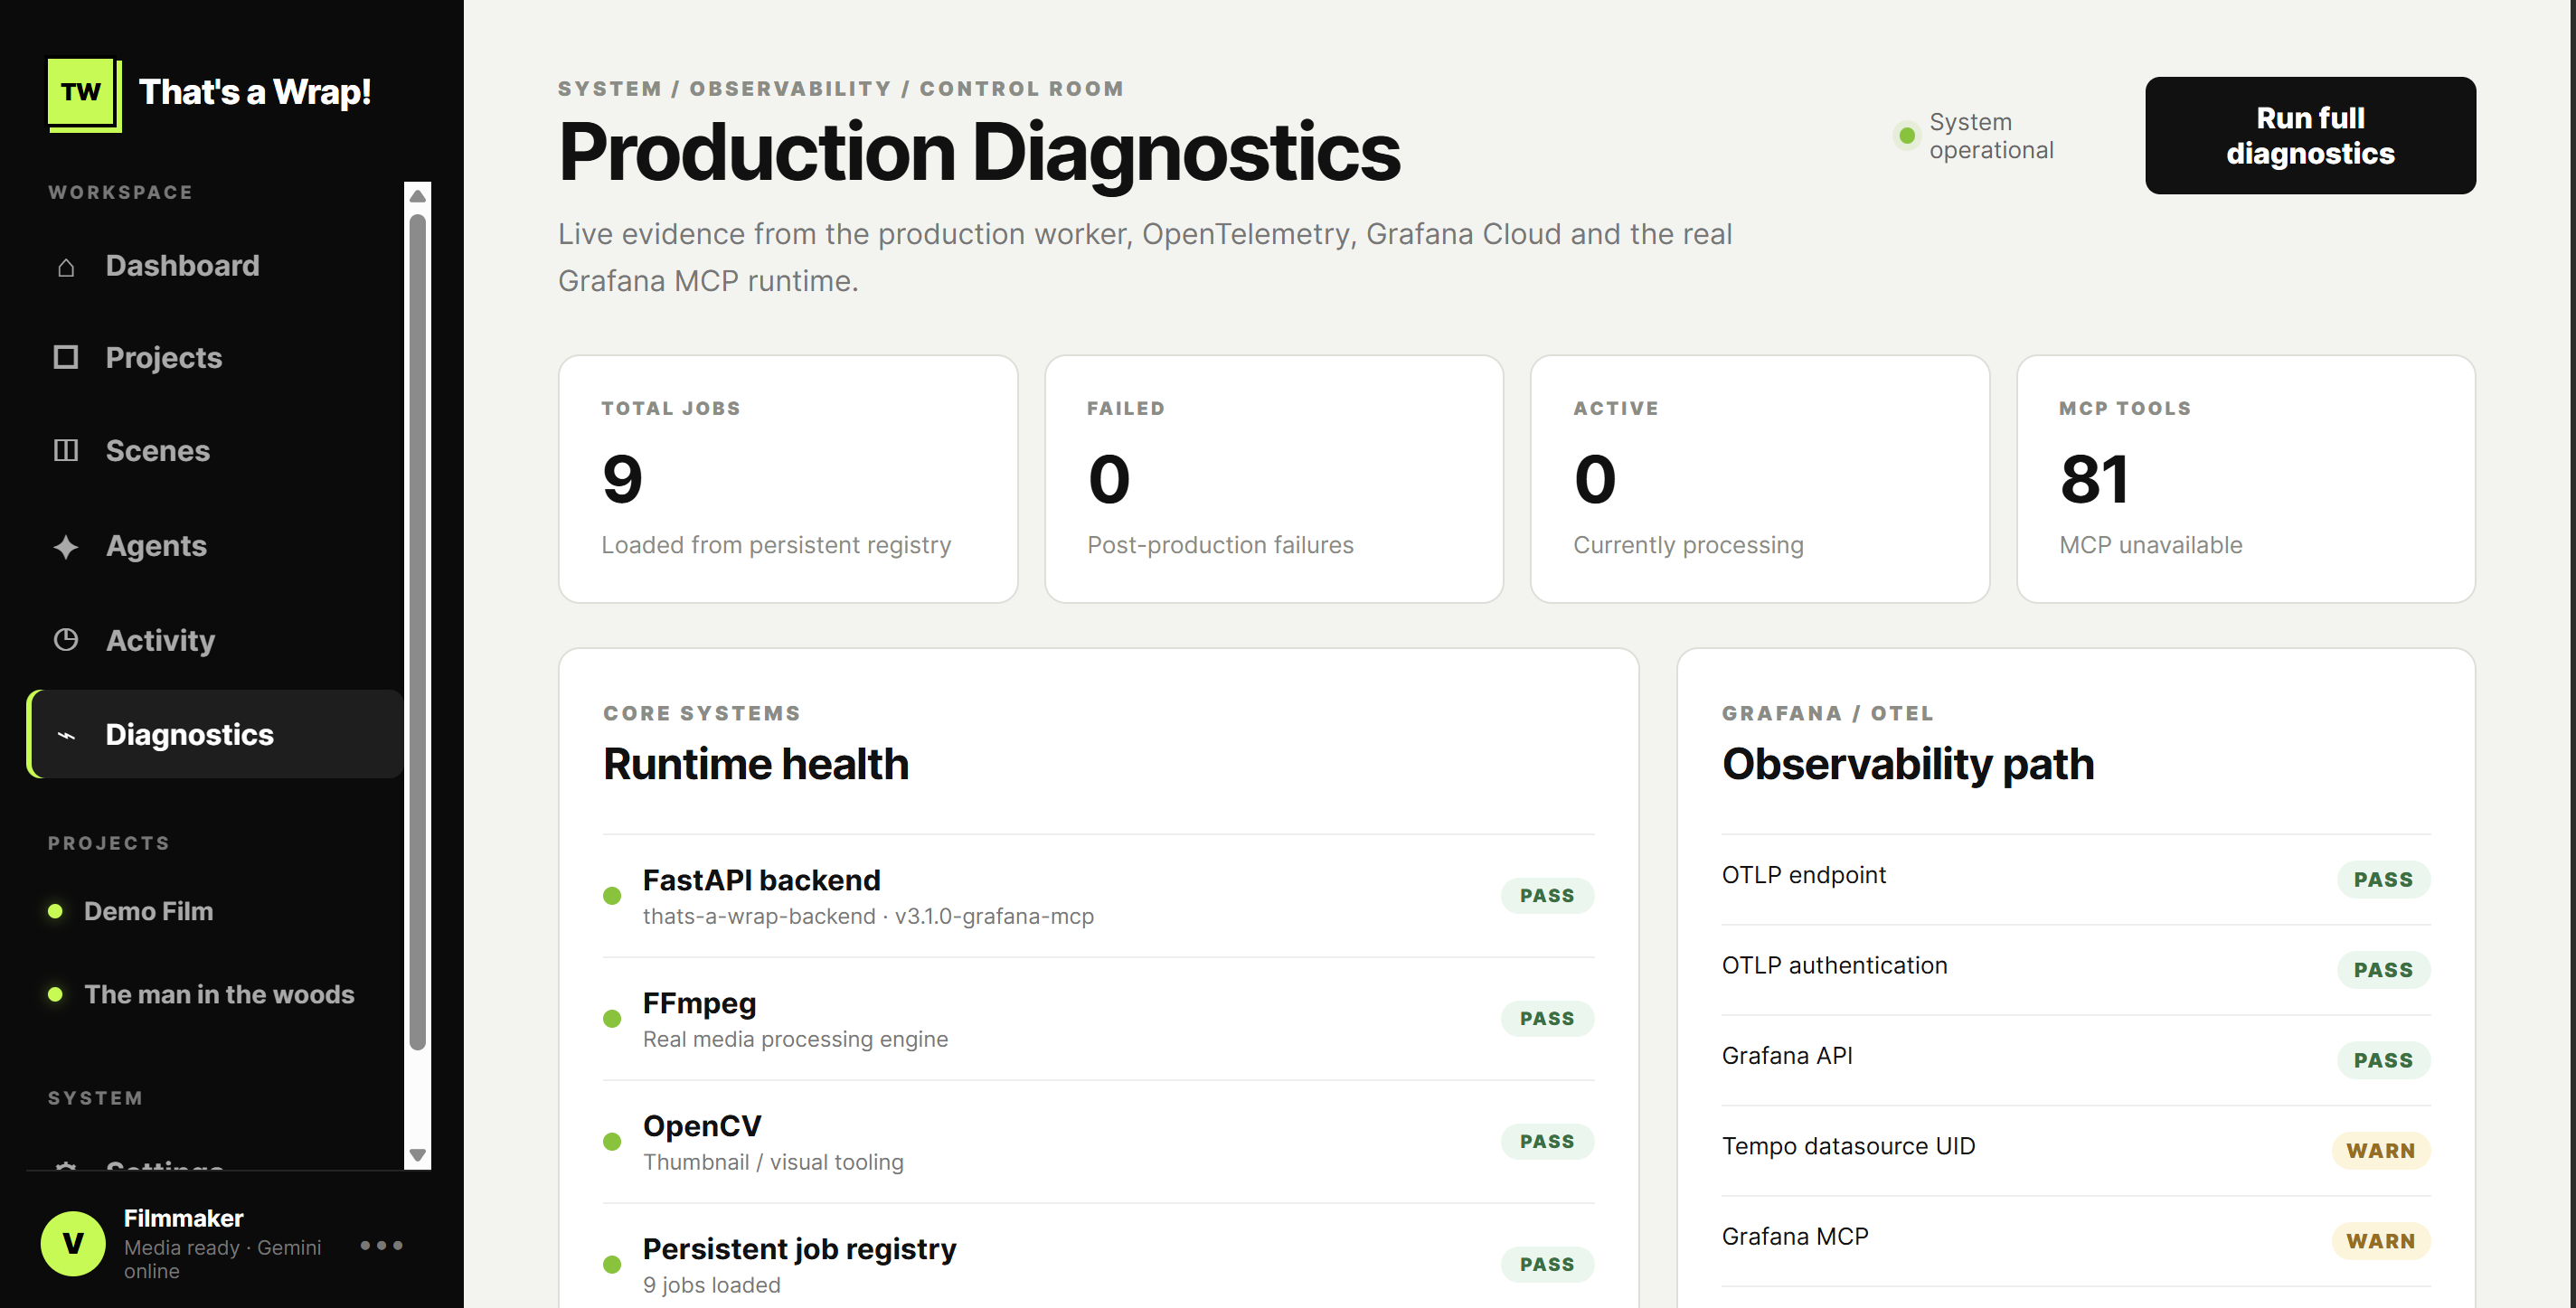
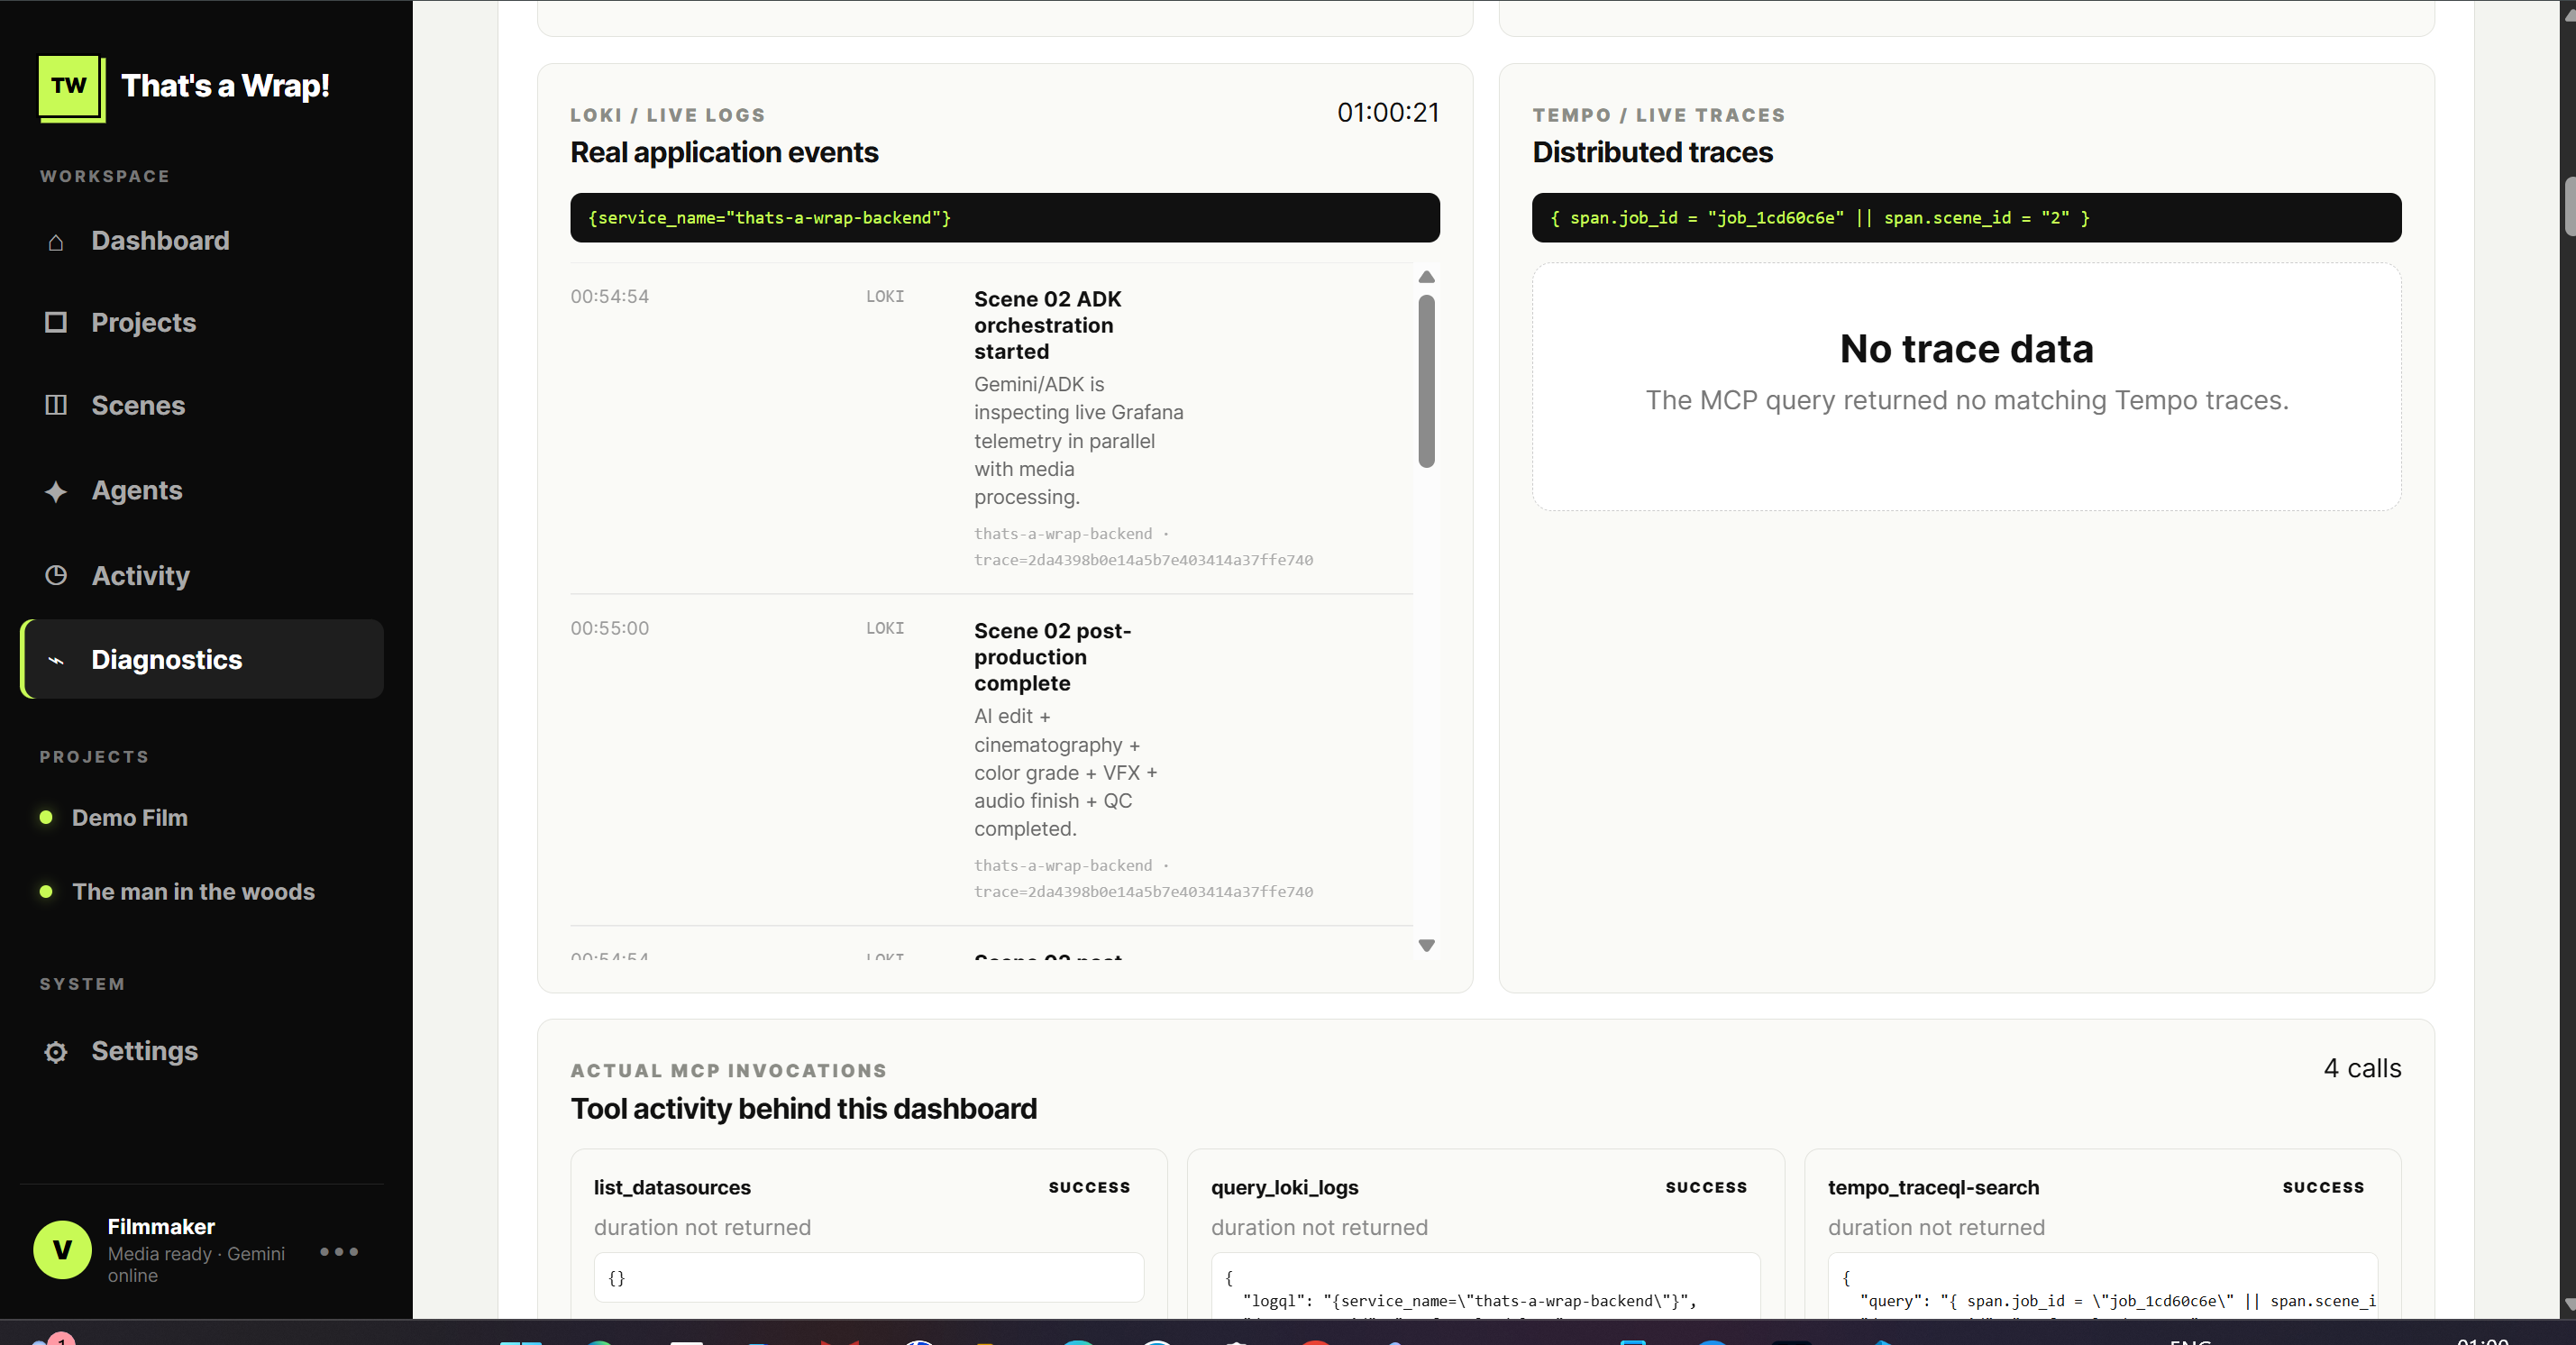
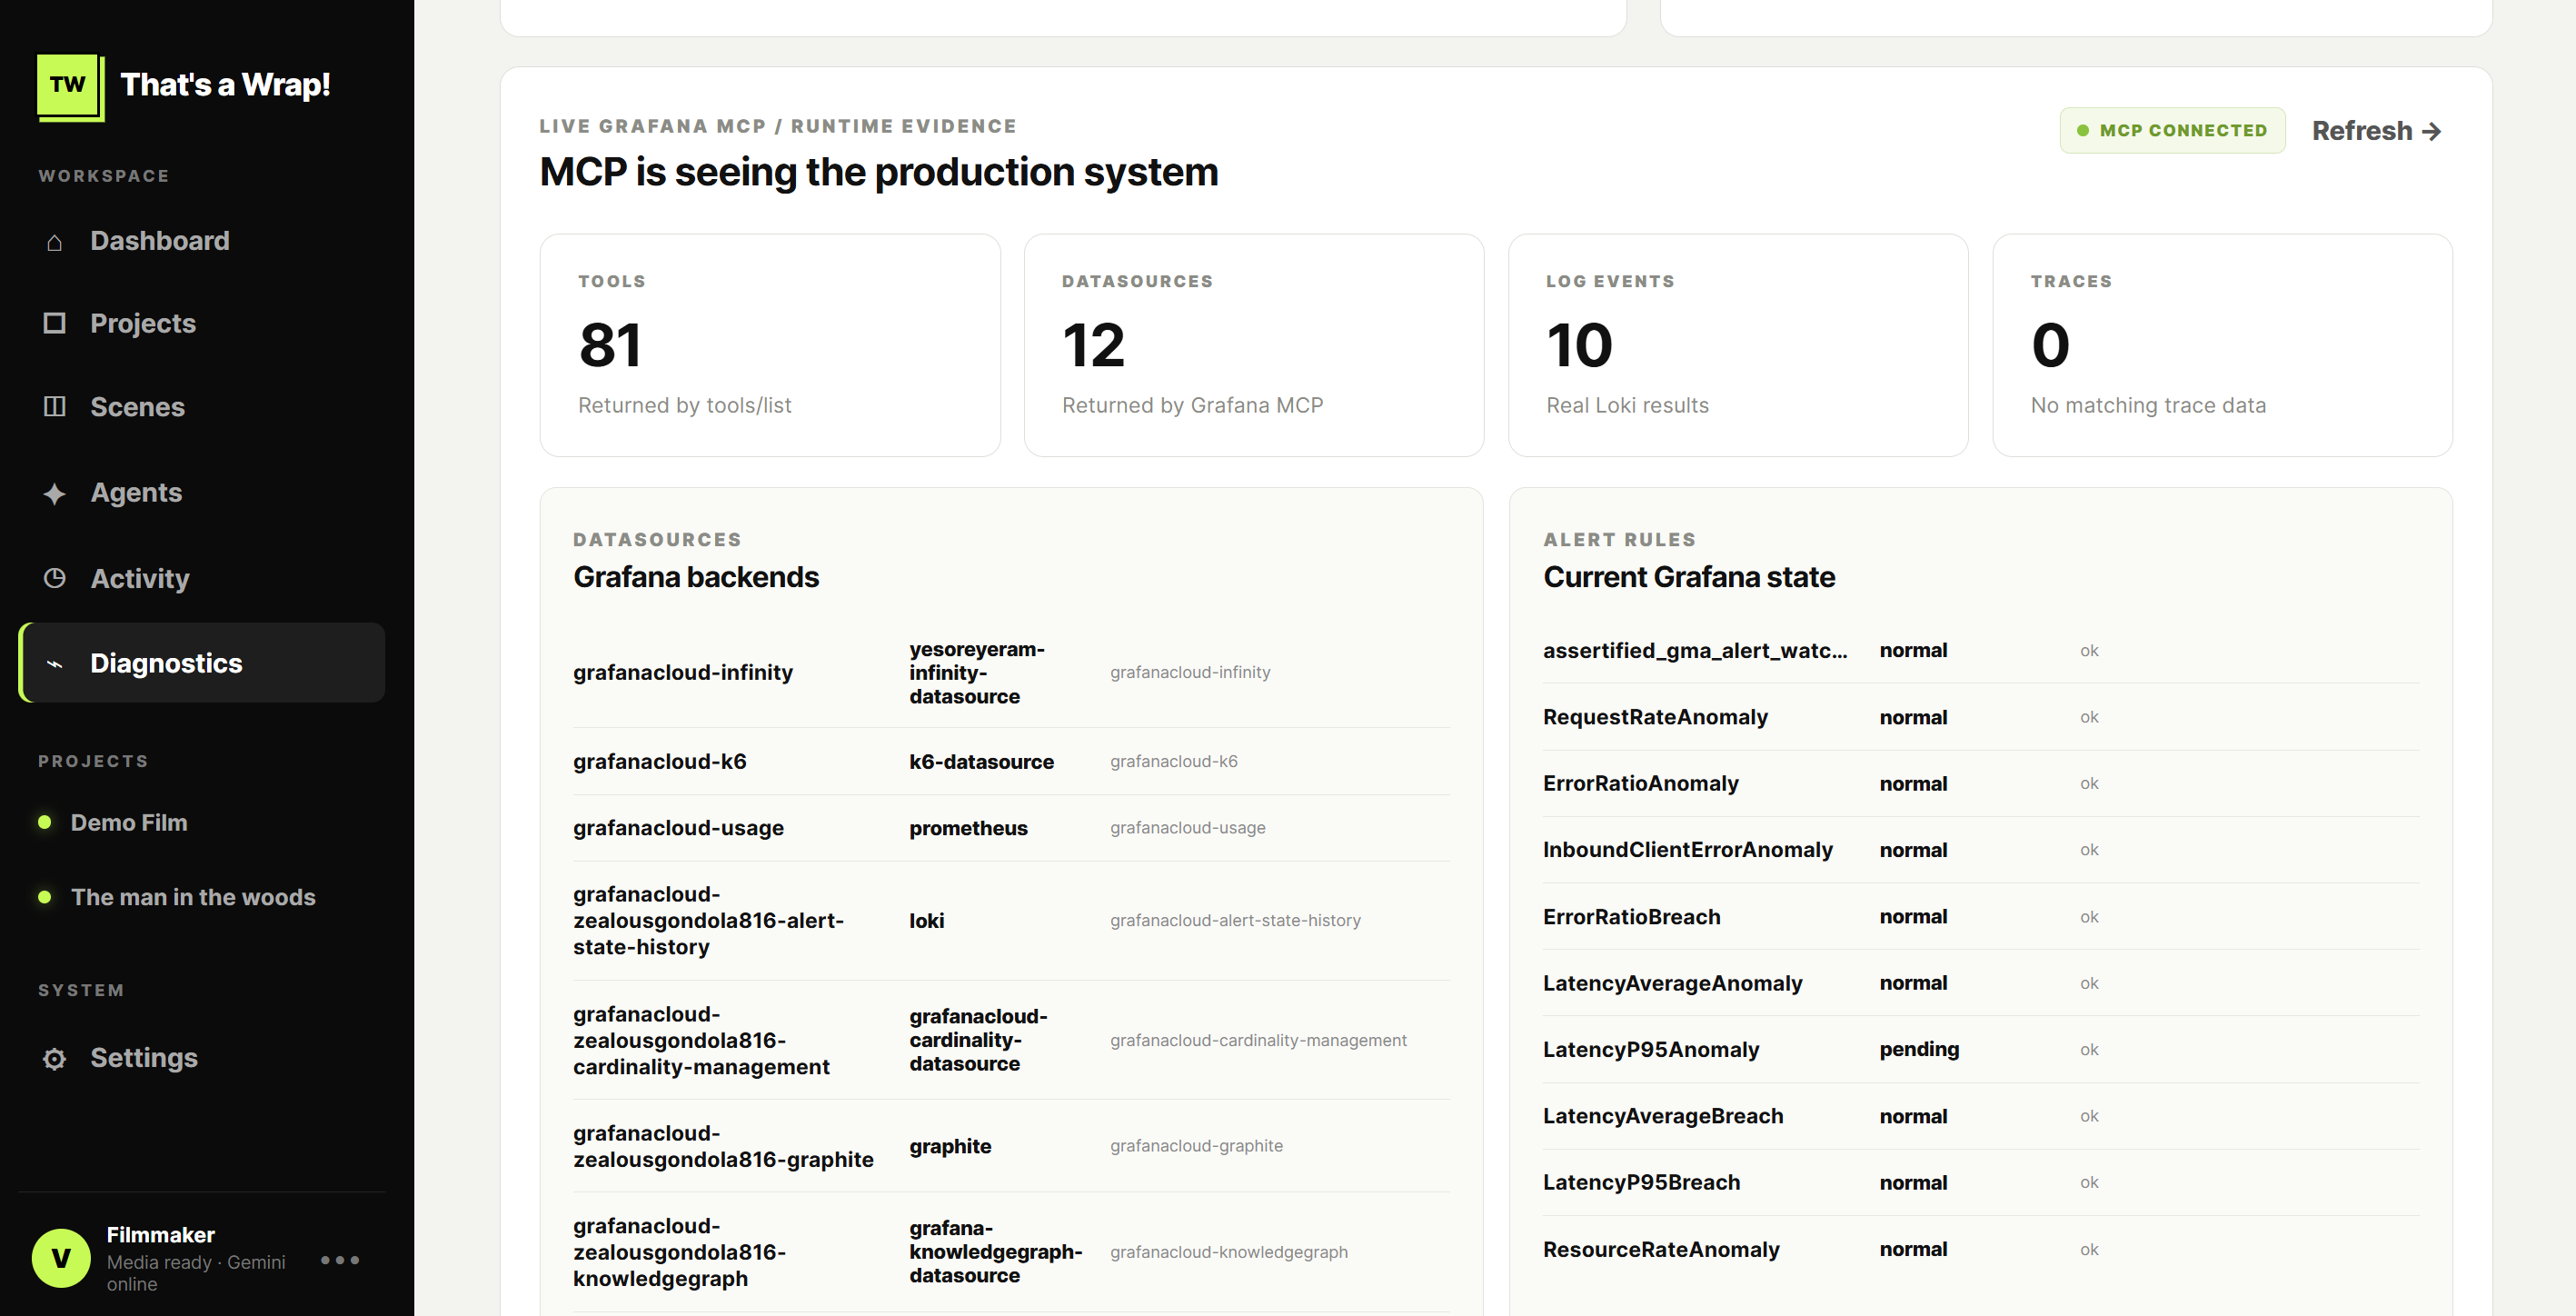
production diagnostics main page
-
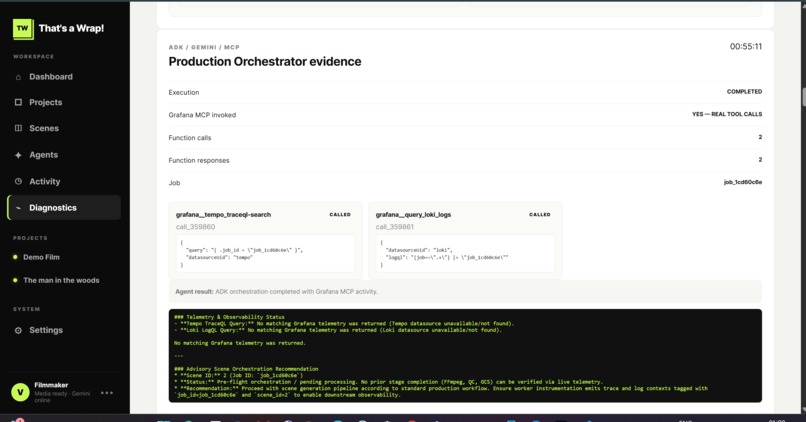
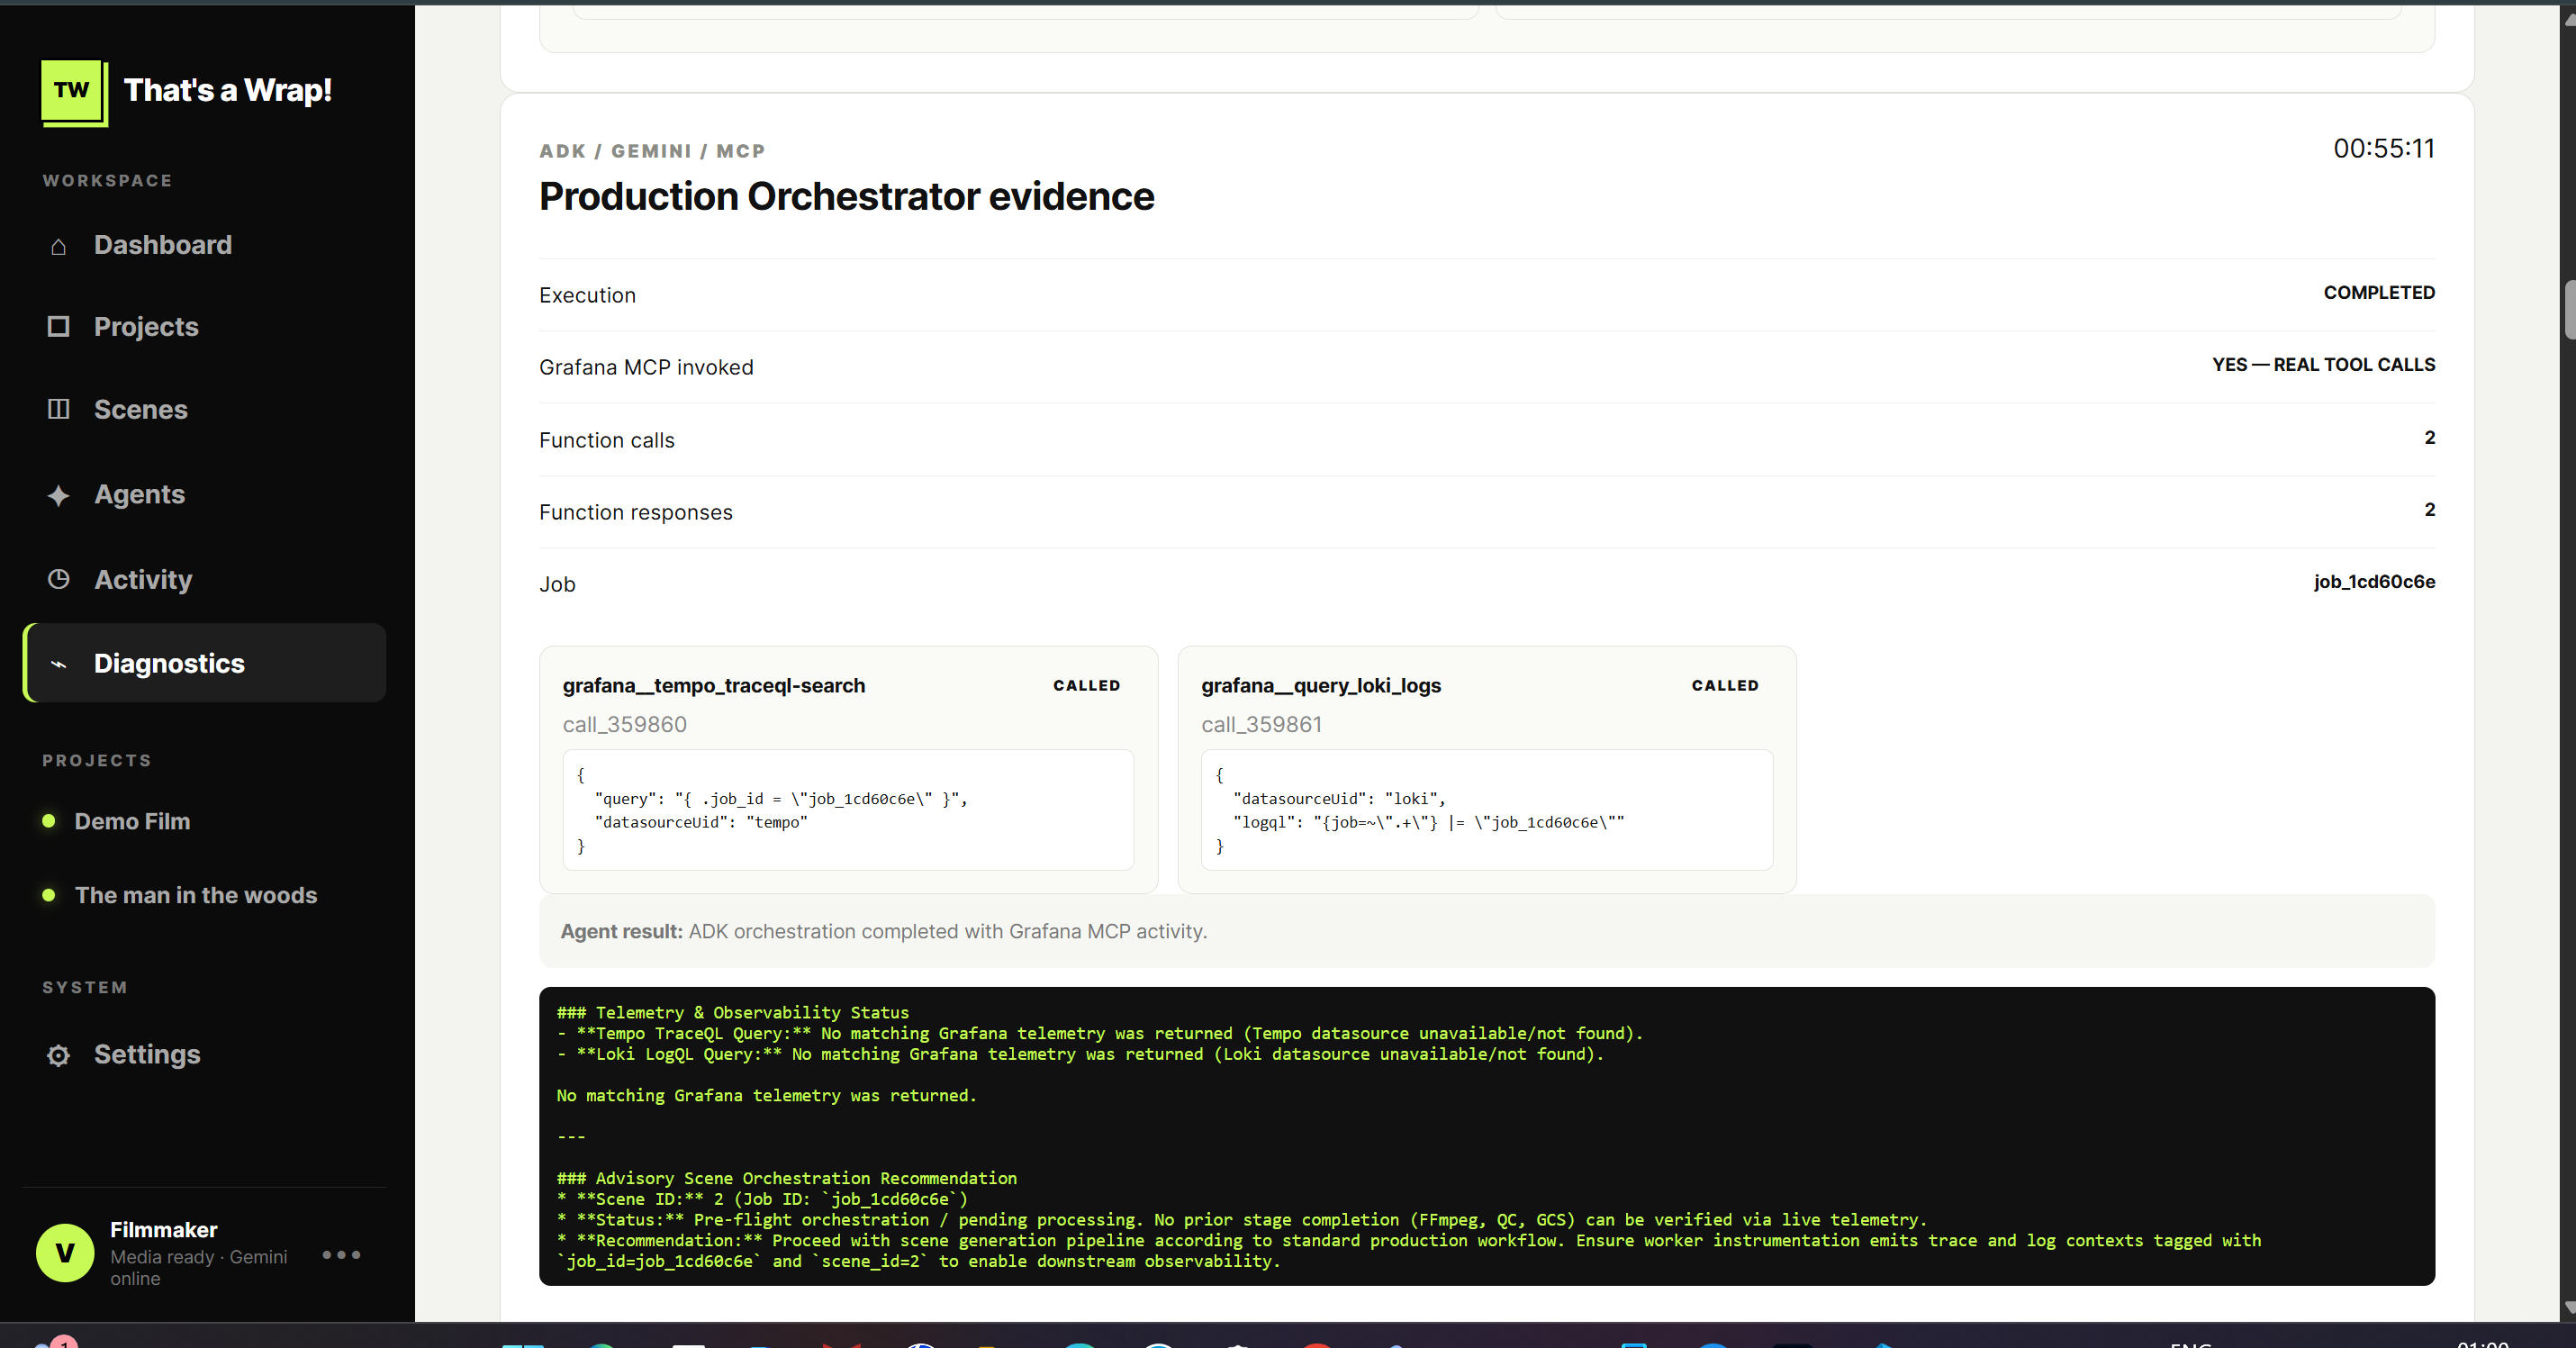
Production dash board evidence with live data
-
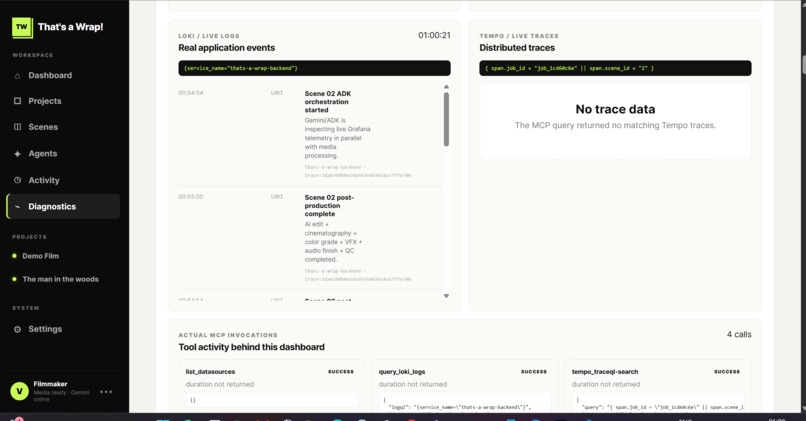
loki data from grafana
-
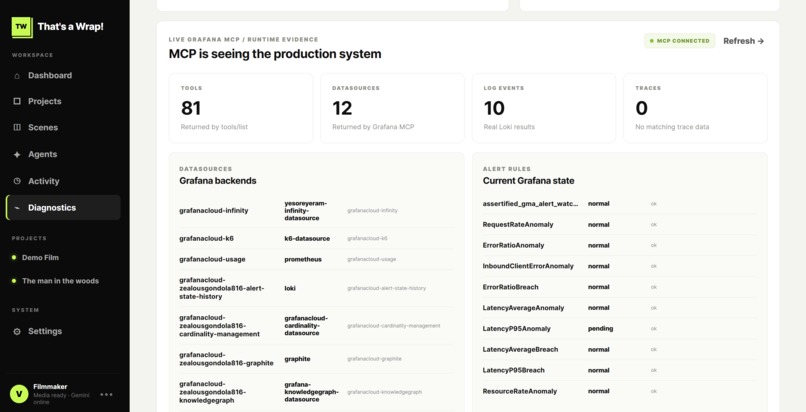
mcp data and tools information from grafana
-
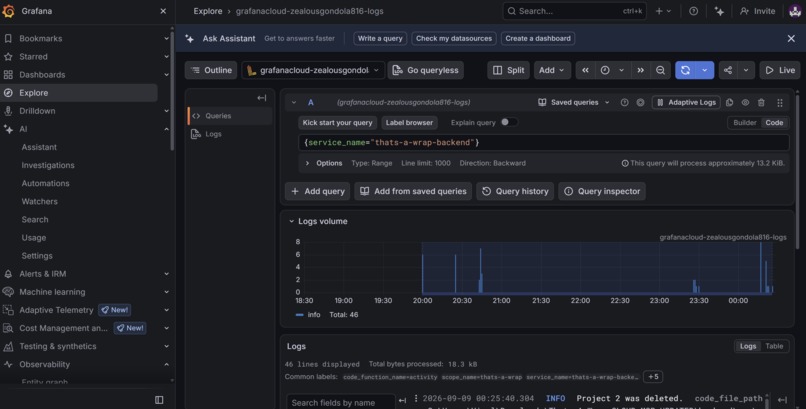
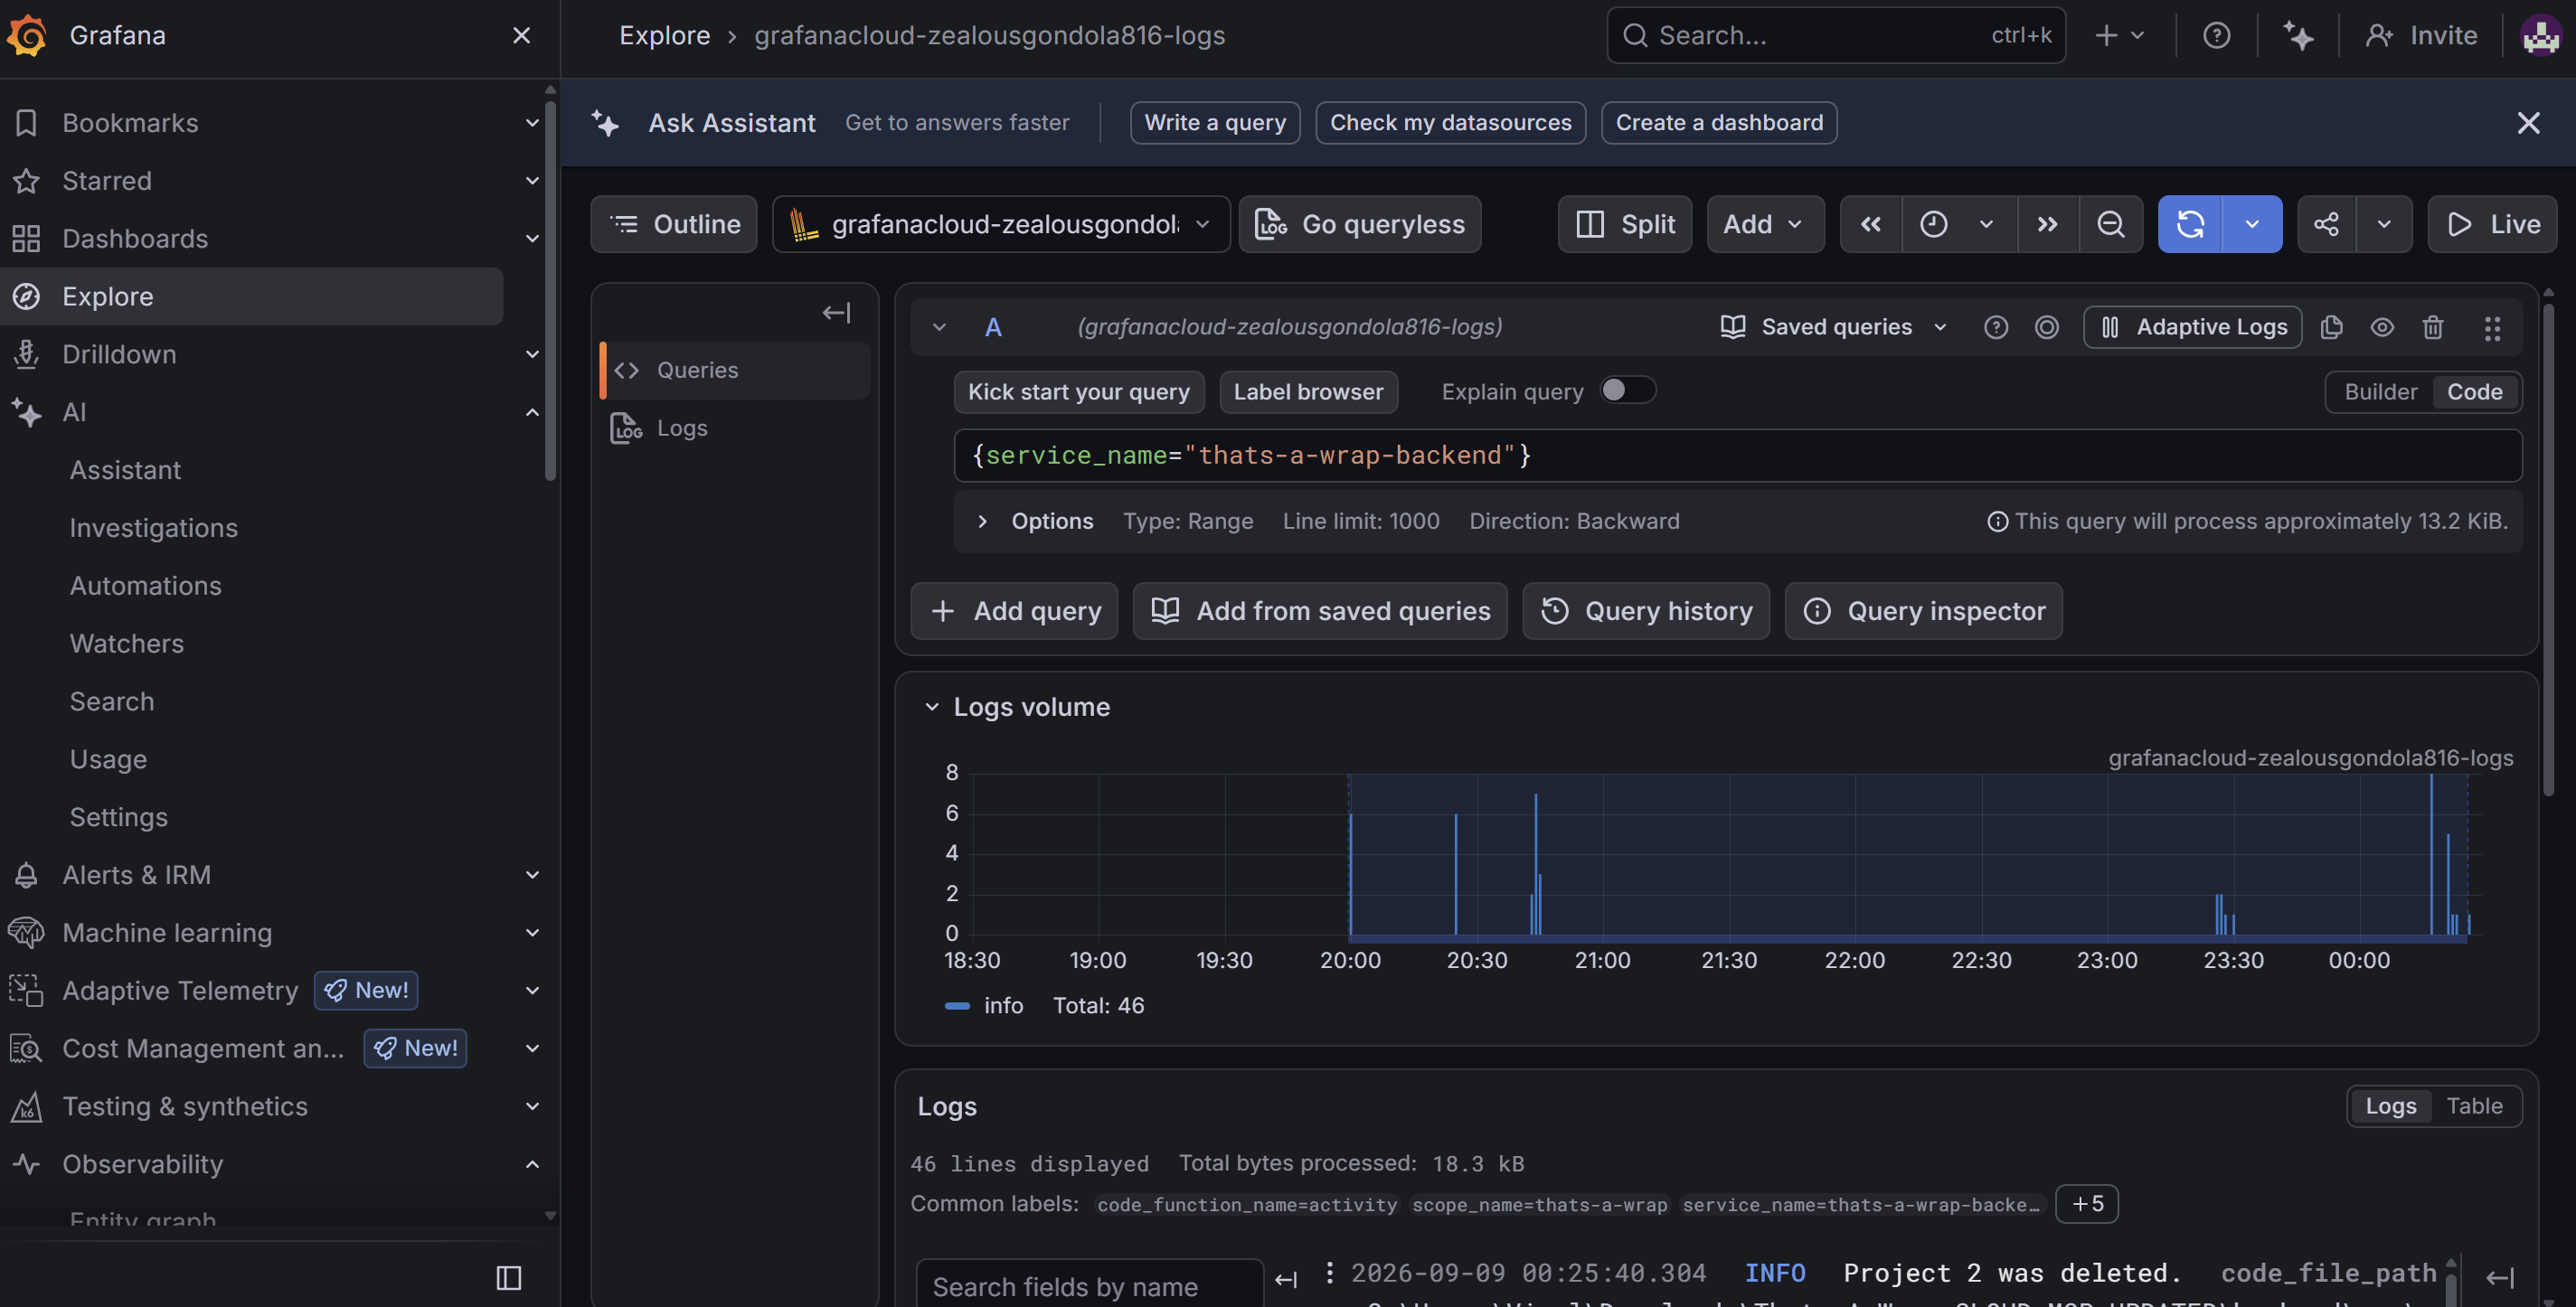
grafana explore page showing logs
-
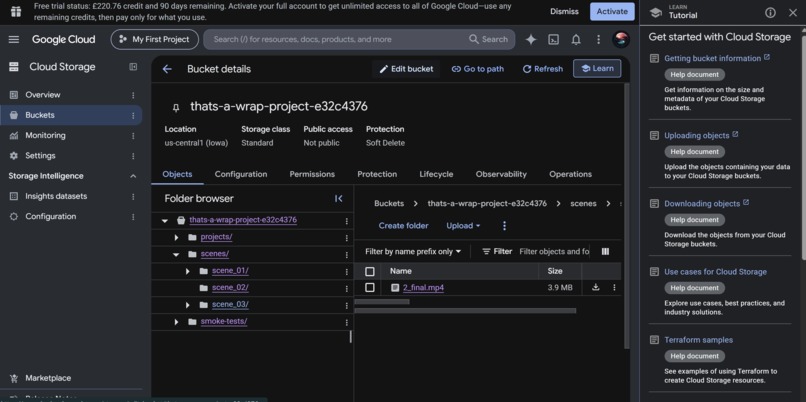
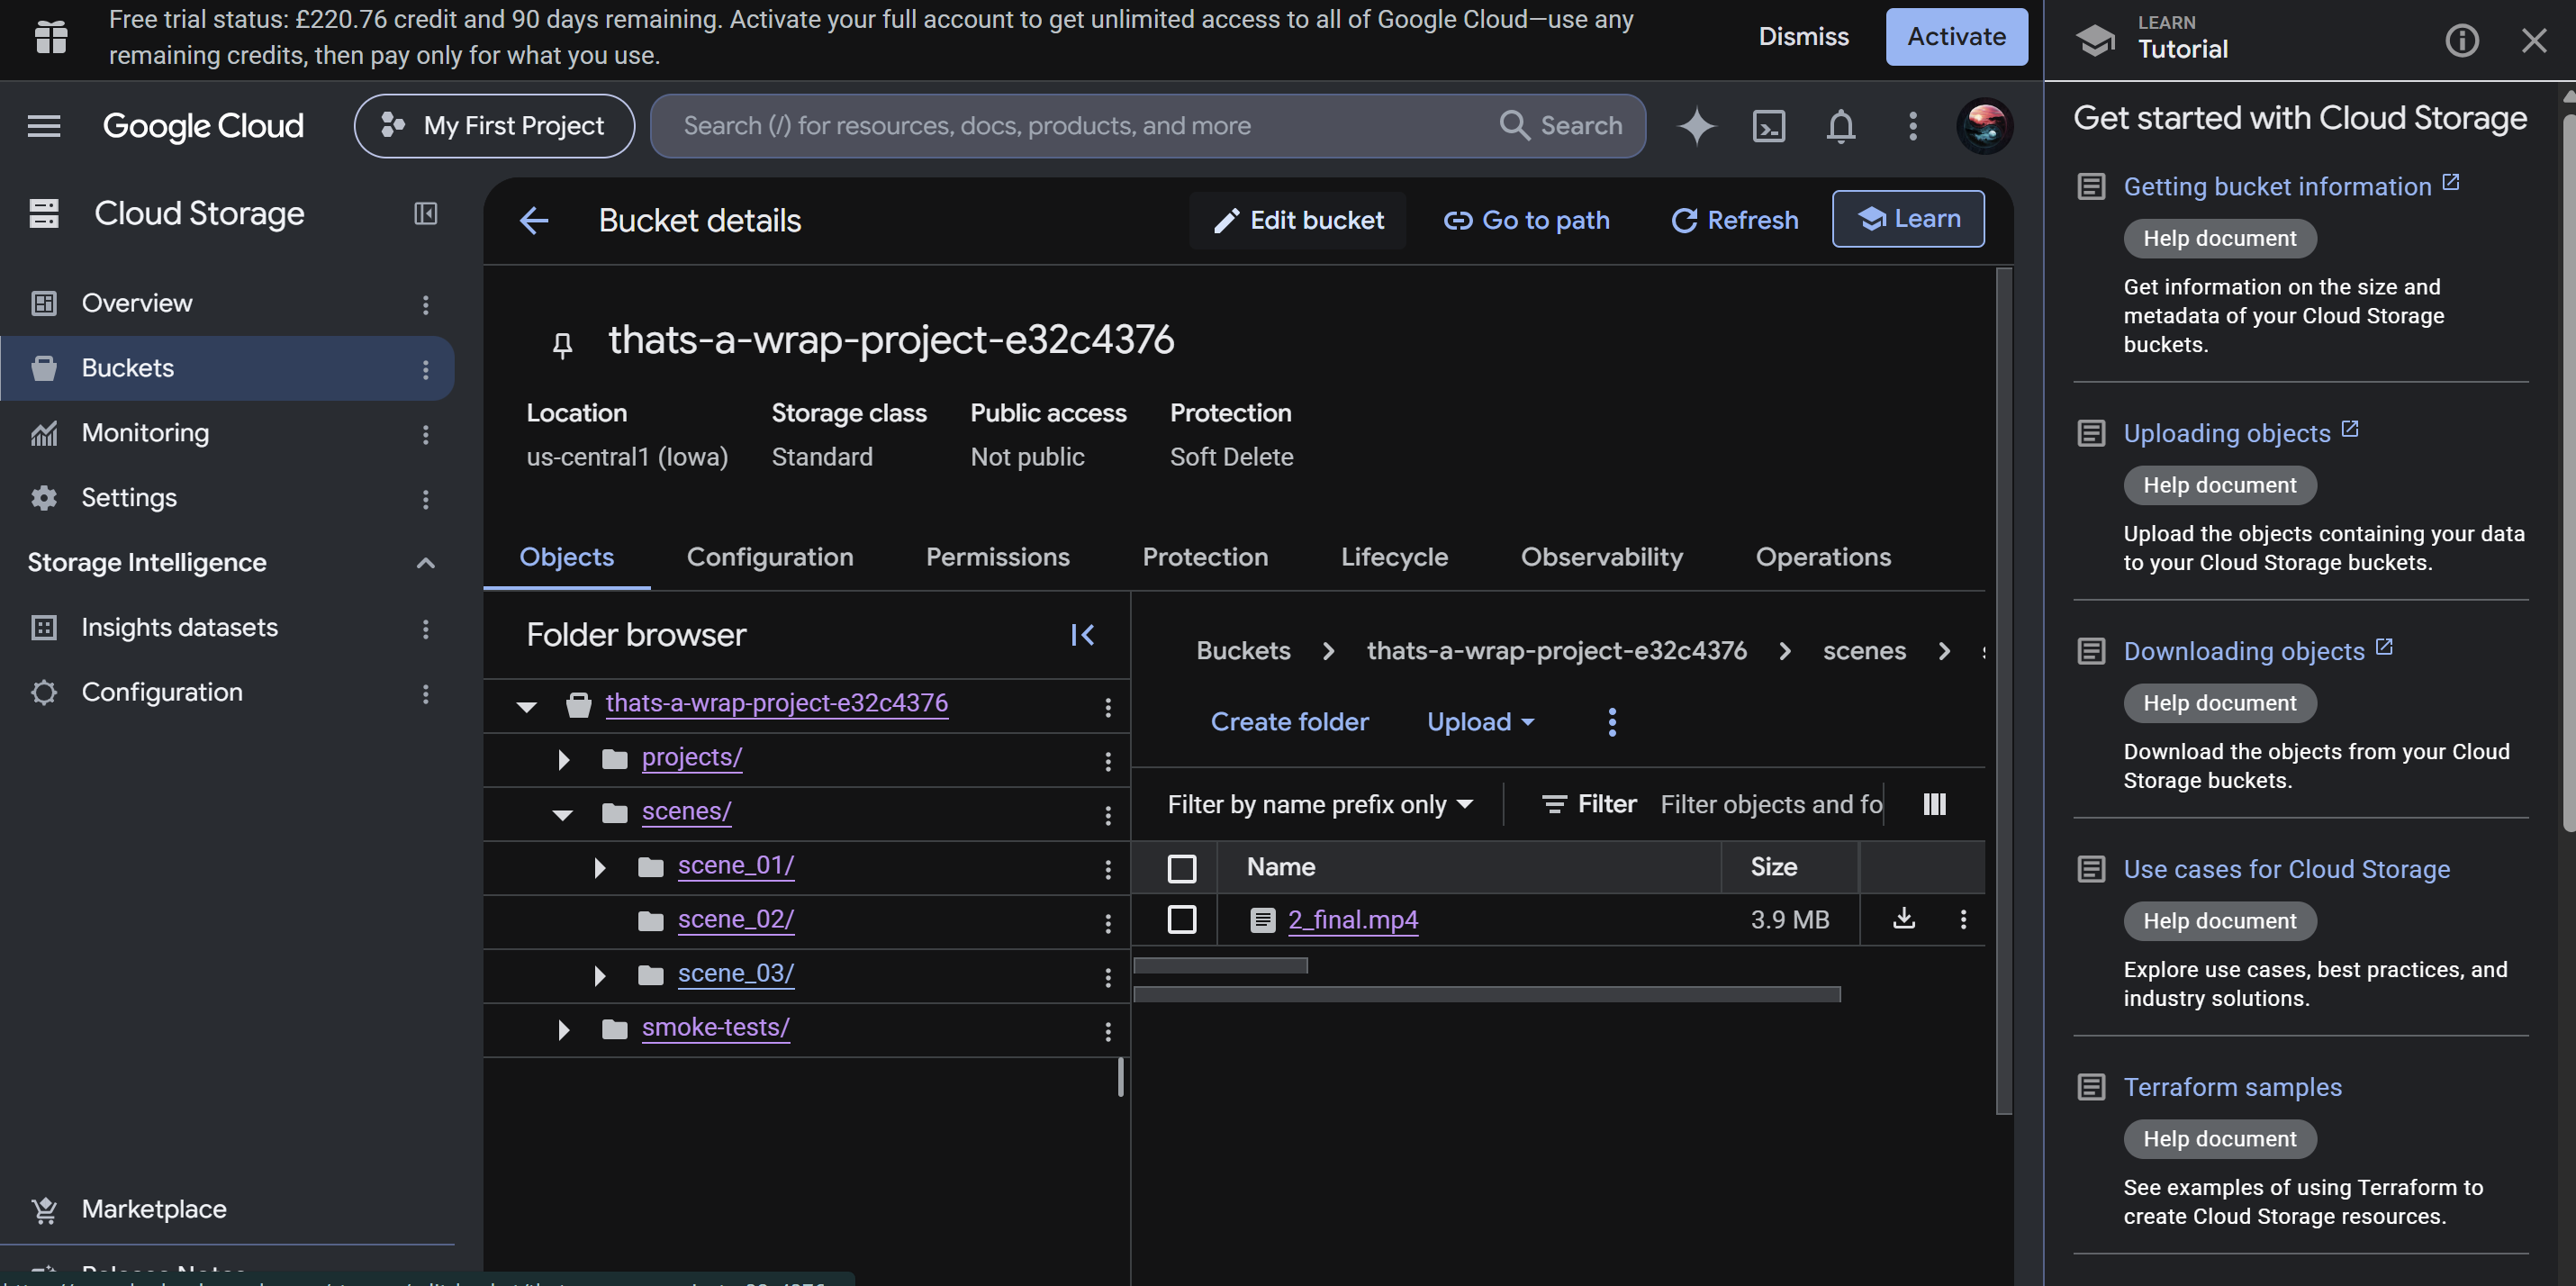
google cloud dashboard showing stored final films and scenes
Inspiration
The Story Behind That's a Wrap!
Inspiration
Film production is a messy process.
Even a short video can involve dozens of steps: organizing footage, understanding scenes, making editorial decisions, generating or selecting music, processing sound, rendering the final cut, and checking the result. We wanted to build something that could bring these steps together into a single intelligent production workflow.
But there was another problem that became just as important to us: what happens when AI makes a decision and something goes wrong?
Traditional creative tools can show you the final result, but they don't necessarily tell you what happened along the way. With an AI-powered production pipeline, that becomes even more important. If an agent says it analyzed a scene, queried a service, or completed a production stage, we should be able to verify that it actually happened.
That idea became the foundation of That's a Wrap!:
An AI filmmaking platform where production and observability are part of the same workflow.
We didn't want to build another interface that simply says "AI completed successfully." We wanted to build a system where the claims made by the application could be backed by real infrastructure evidence.
What We Built
That's a Wrap! takes uploaded footage and moves it through an AI-assisted production pipeline:
Footage → AI Analysis → Editor → Director → Music → Sound → Post Production → Rendering → QC → Final Film
Behind that workflow is a real backend built with FastAPI, Google ADK/Gemini, FFmpeg, OpenCV, Google Cloud Storage, OpenTelemetry, and Grafana Cloud.
The application also integrates with the Grafana MCP, allowing the AI workflow and production dashboard to interact with real observability infrastructure.
The result is more than an AI video editor. It's a production control room.
The Part We Care About Most: Trust
One of the biggest design decisions we made was that the application should never fabricate observability data.
For example, if we ask Grafana for logs and there are no matching logs, the application does not generate a fake success message.
It reports:
0 matching logs.
If there are no traces, it reports:
0 matching traces.
If an MCP tool wasn't actually invoked, the UI doesn't pretend that it was.
This sounds simple, but it changed how we built the entire system.
We treated telemetry as evidence rather than decoration.
Our diagnostics dashboard combines information from the actual backend, OpenTelemetry, Grafana Cloud, and the live Grafana MCP runtime. We can see things such as backend health, FFmpeg/OpenCV availability, persistent jobs, OTLP configuration, Grafana connectivity, MCP tools, datasource information, logs, traces, alerts, and actual MCP invocations.
The goal is simple:
If the system cannot prove that something happened, it shouldn't claim that it happened.
How We Built It
The frontend provides the filmmaking workspace and production dashboard.
The backend is responsible for processing footage and coordinating the production workflow. We use FFmpeg for media processing and OpenCV for video analysis and frame-level processing.
The AI workflow is orchestrated through Google ADK/Gemini, with different production stages represented as part of the workflow.
For infrastructure observability, we instrumented the backend using OpenTelemetry and send telemetry into Grafana Cloud.
We then connected the application to the real Grafana MCP runtime.
This allows the system to perform operations such as:
- Discovering live Grafana datasources
- Querying Loki logs
- Searching Tempo traces
- Inspecting alerting information
- Reporting actual MCP tool invocations
We also built a persistent job registry so production jobs remain trackable instead of existing only in temporary frontend state.
A Challenge We Didn't Expect
One of our biggest debugging lessons came from the Grafana datasources themselves.
Our Grafana environment contained multiple Loki datasources, including the production logs datasource and a usage-insights datasource.
Initially, our backend selected a Loki datasource too broadly. Because multiple datasources matched the condition, the wrong datasource could overwrite the correct one.
The application was technically connected to Grafana — but it wasn't necessarily querying the datasource we intended.
We traced the problem back to the datasource-selection logic and changed it to explicitly select the intended production datasource.
That was an important lesson:
A connection being "healthy" doesn't necessarily mean you're querying the right data.
For an observability system, correctness matters at every layer.
Another Challenge: Making AI Systems Debuggable
We also encountered issues around AI API quotas, MCP connectivity, telemetry configuration, and the interaction between local development and production infrastructure.
These problems forced us to stop thinking of the AI as a single black box.
Instead, we treated the system as a distributed production pipeline:
Frontend → API → AI orchestration → workers → media processing → telemetry → Grafana
Every boundary became something we needed to be able to inspect.
That led to the production diagnostics/control-room interface, where we can distinguish between:
- The application being operational
- The observability infrastructure being connected
- MCP tools actually being available
- MCP tools actually being invoked
- Logs actually existing
- Traces actually existing
- A production job actually completing
Those distinctions made the system much easier to debug.
What We Learned
The biggest thing we learned was that building an AI application is only part of the problem.
Building an AI application that you can trust, debug, and demonstrate honestly is much harder.
We learned how to connect AI orchestration to real production infrastructure, how to instrument backend services with OpenTelemetry, how to query Grafana through MCP, how to process video using FFmpeg and OpenCV, and how small configuration mistakes can produce misleading observability results.
We also learned that "no data" is a legitimate and valuable result.
A system that says:
"I don't have evidence for this"
is more useful than a system that confidently invents an answer.
What's Next
That's a Wrap! could eventually grow into a complete AI production assistant.
Future versions could include more sophisticated scene understanding, continuity tracking, automated rough cuts, production scheduling, collaborative editing, richer audio workflows, automated QC, and deeper production analytics.
But the principle would remain the same:
The AI should be creative, while the infrastructure should remain verifiable.
Why That's a Wrap?
Film production has always been a combination of creativity and coordination.
AI can dramatically accelerate the creative side, but as AI becomes responsible for more of the production process, we also need better ways to understand what the system actually did.
That's a Wrap! is our attempt to bring those two ideas together:
AI-powered filmmaking + real production observability.
Because when an AI system says the production is finished...
we want to know why.
What it does
How we built it
Challenges we ran into
Accomplishments that we're proud of
What we learned
What's next for That's a Wrap!
Built With
- adk
- ai
- cloud
- fastapi
- ffmpeg
- gemini
- google-cloud
- grafana
- javascript
- mcp
- opencv
- opentelemetry
- python
- react
- typescript
- vite


Log in or sign up for Devpost to join the conversation.