-
-
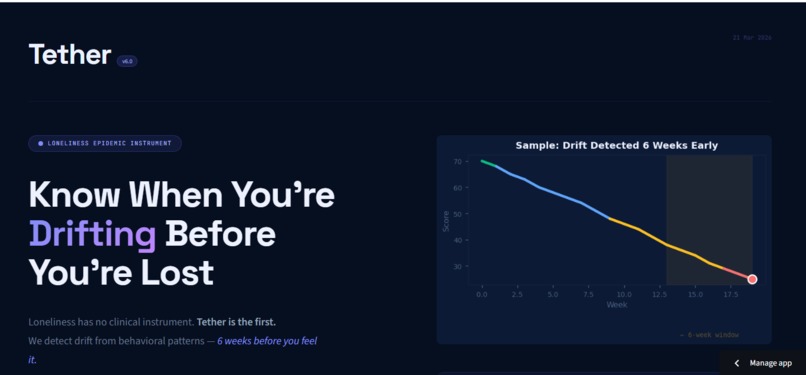
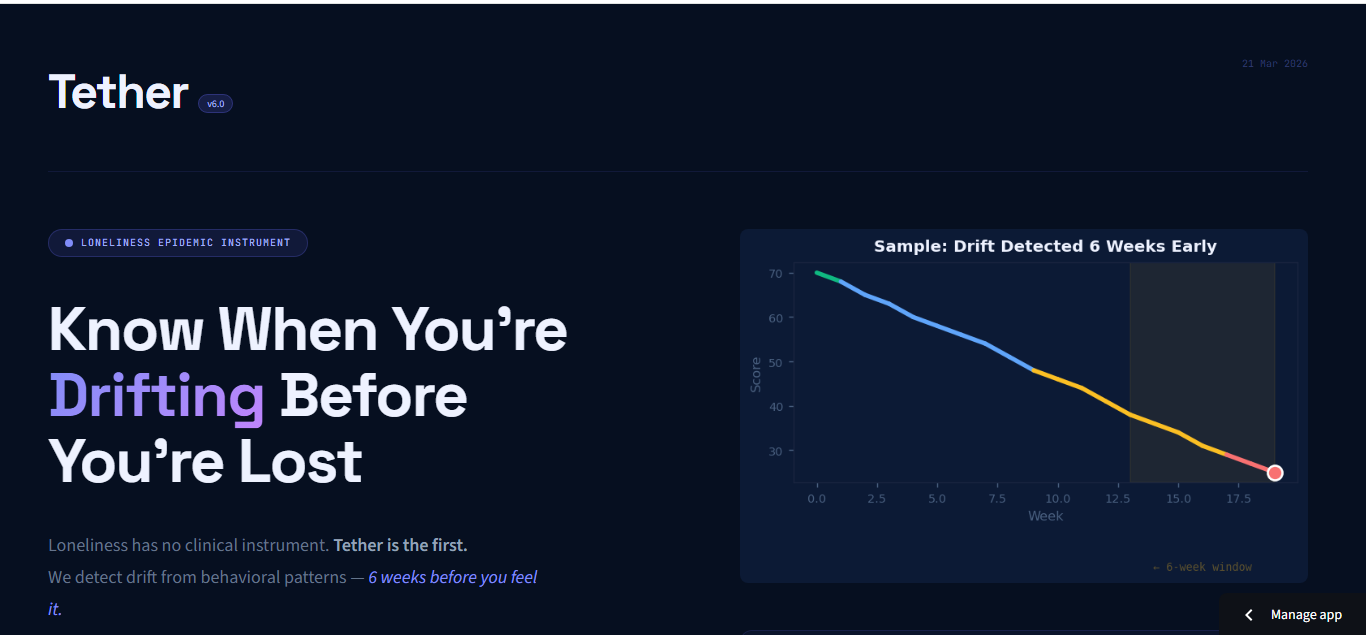
Home page
-
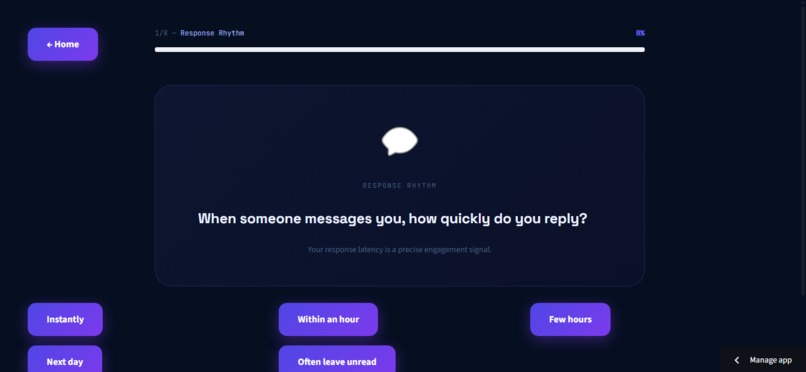
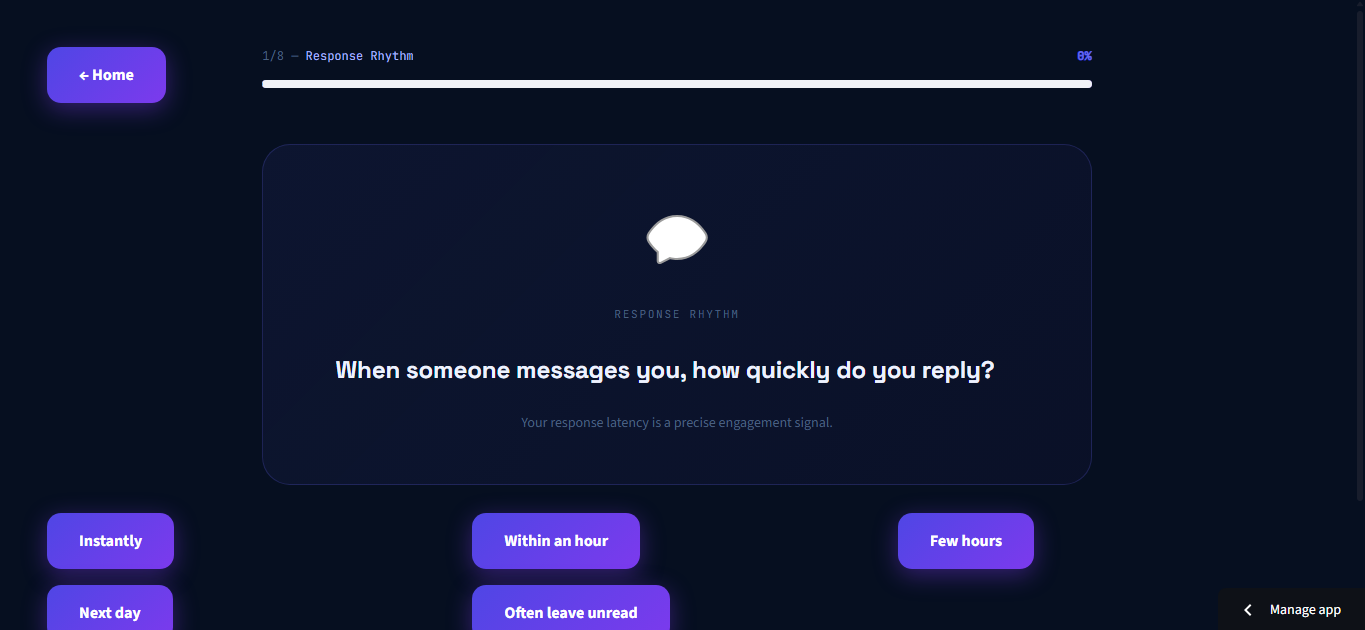
Quiz
-

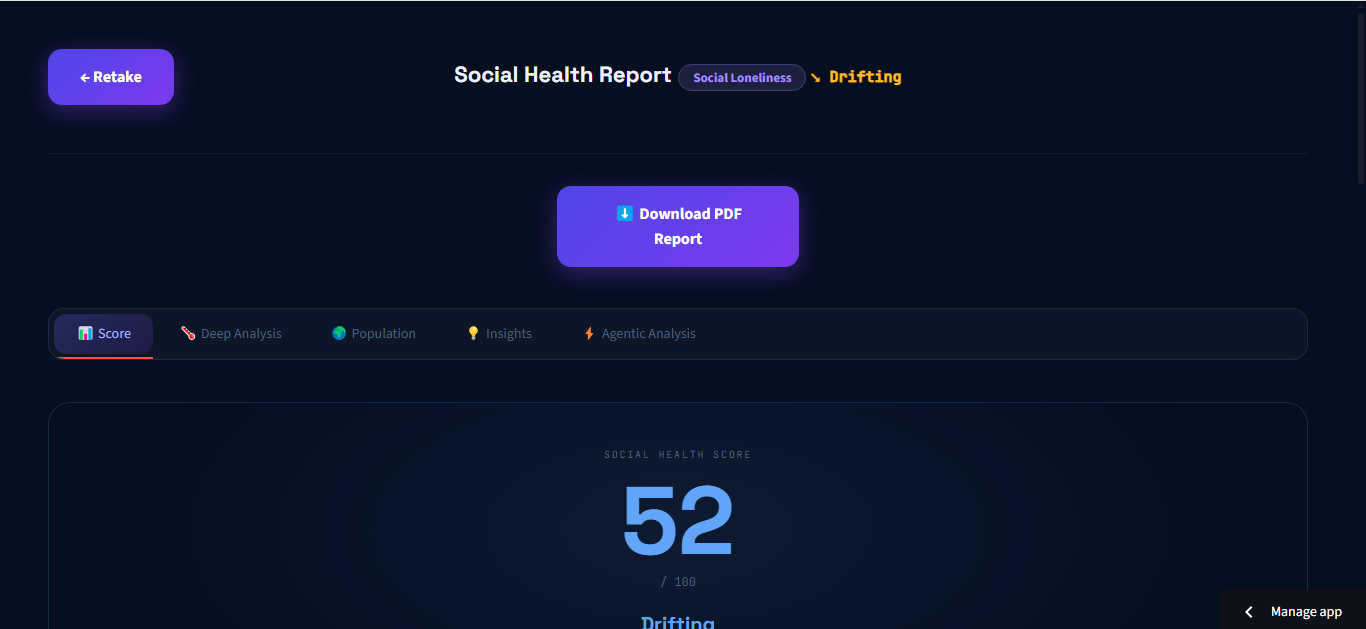
Score
-

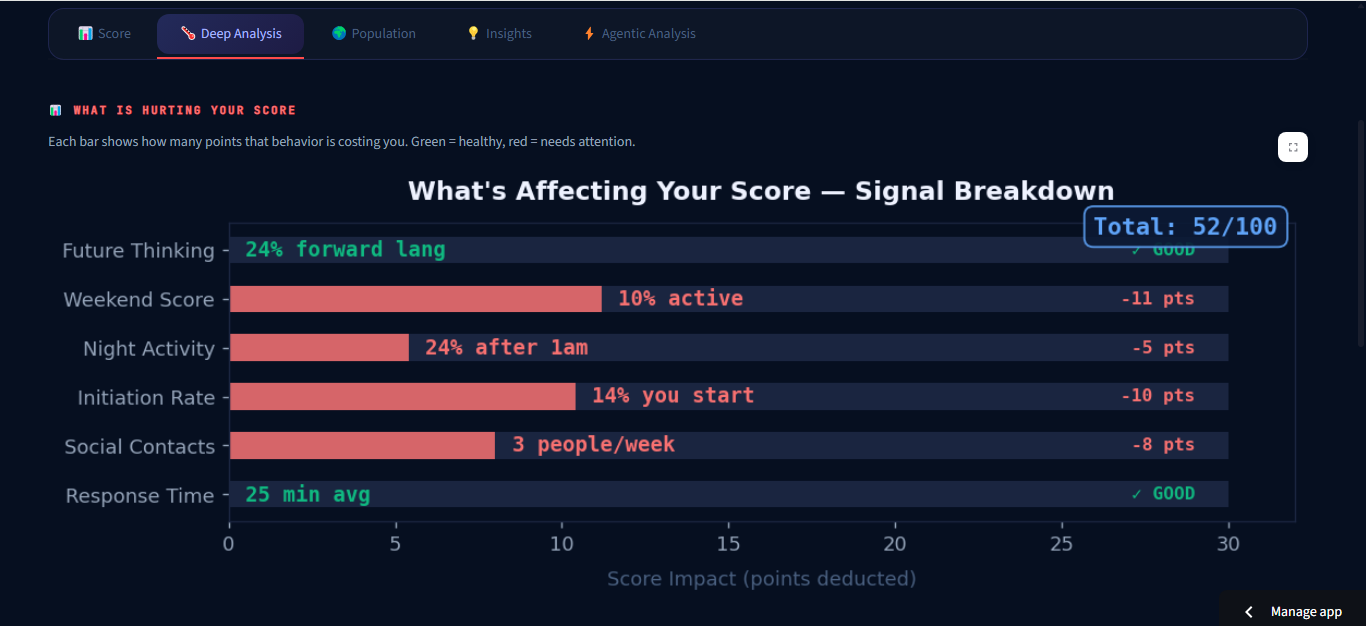
Deep Analysis
-
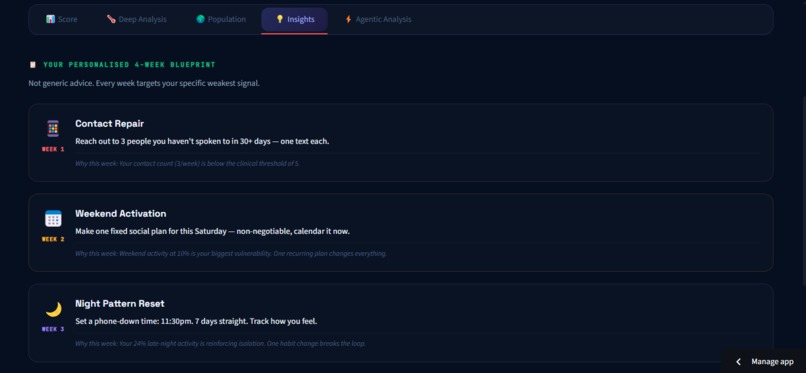
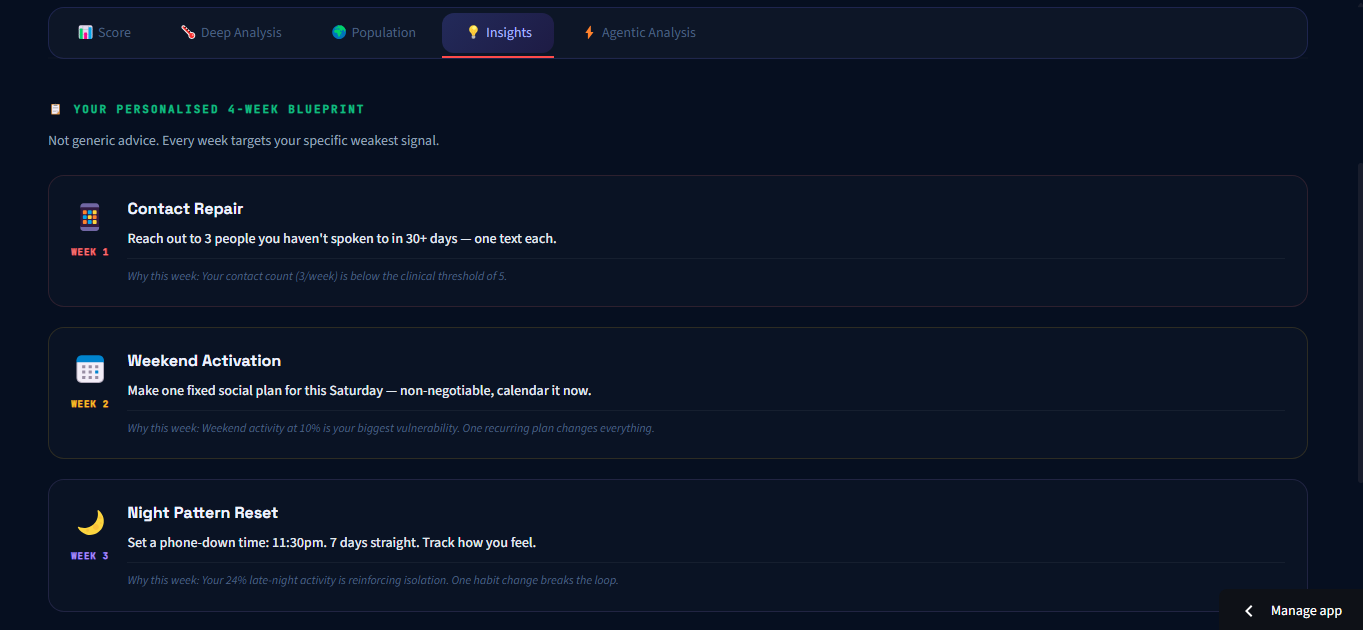
Insights
-

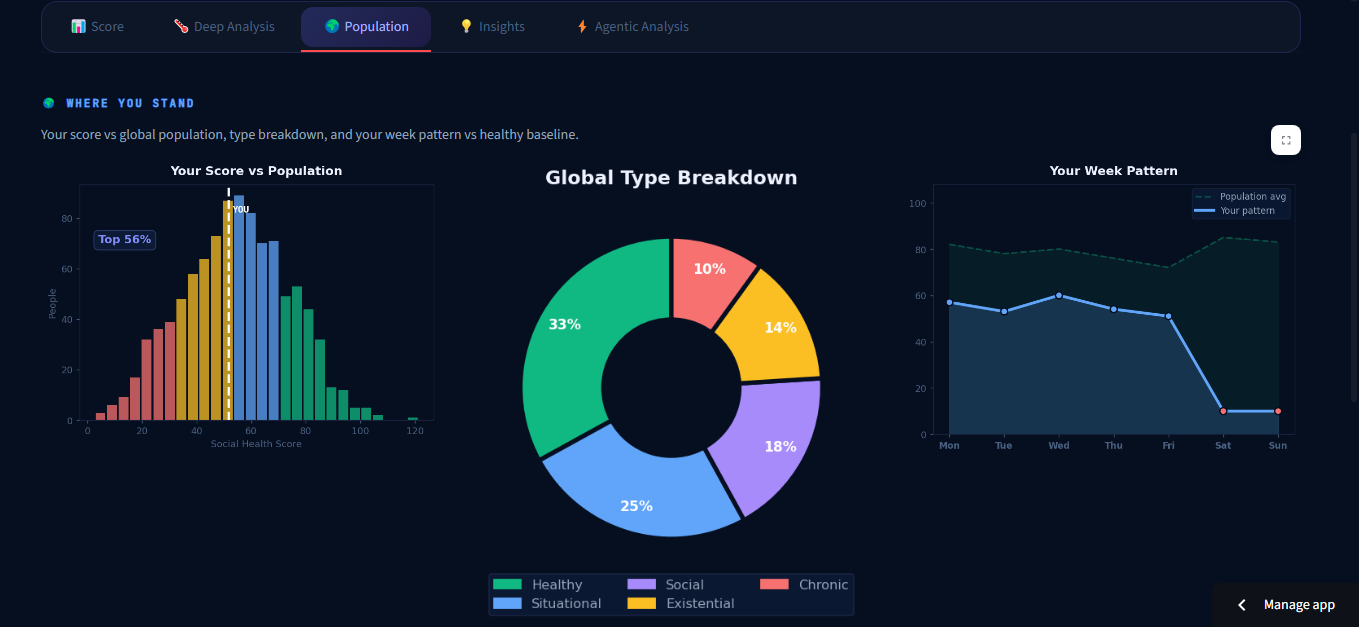
Population
-
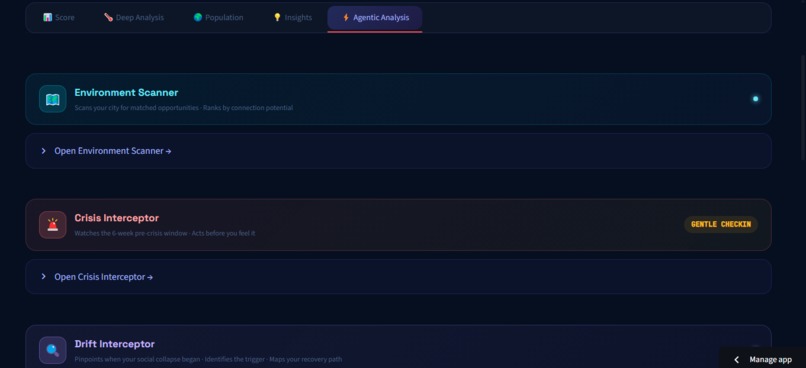
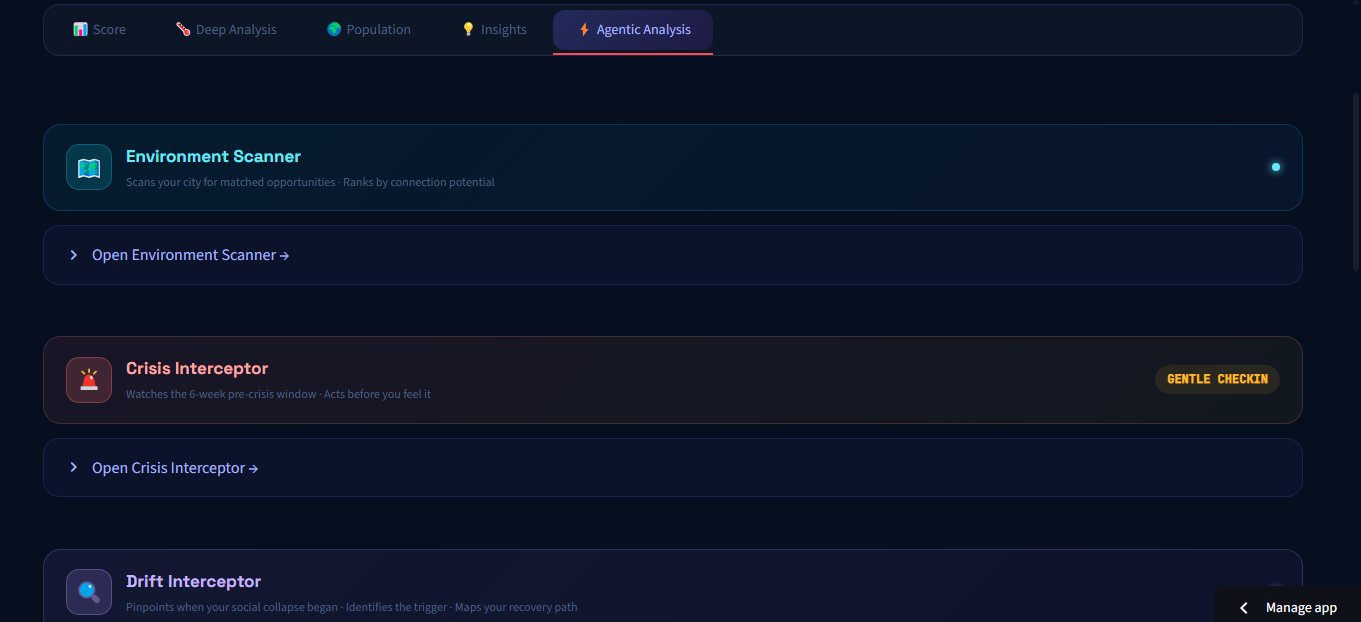
Agentic Analysis
Inspiration
In 2024, tree-hole apps — anonymous confession platforms — became the most downloaded apps in China overnight. Not because the technology was good. Because the loneliness was unbearable. Japan has a Minister of Loneliness. The UK has one too. The US Surgeon General declared it a public health epidemic. The WHO classified it as a global crisis. 1 billion people are clinically lonely — and it raises mortality by 26%, equivalent to smoking 15 cigarettes every single day.
But here is what stopped us: depression has PHQ-9. Anxiety has GAD-7. These clinical instruments have existed for decades. They don't just tell you something is wrong — they tell you how wrong, what kind, and what to do about it.
Loneliness has nothing.
Not one validated behavioral instrument. Not one clinical measurement tool. Governments are trying to solve an epidemic they cannot even see clearly. We kept asking the same question — if you cannot measure it, how do you solve it? Tether is our answer.
What It Does
Tether is the first behavioral instrument for the loneliness epidemic. It detects social drift 6 weeks before you feel it, identifies the root cause, and deploys three AI agents to intercept the crisis before it happens.
The Assessment asks 8 plain-language questions about real behavior — not feelings. Response time, weekly contacts, initiation ratio, night activity, weekend score, future thinking, living situation, work context. After every answer, a peer-reviewed micro-insight explains the clinical significance of that signal.
Three stacked ML models process the answers — a Gradient Boosting classifier for loneliness type, a Gradient Boosting regressor for social health score, and a Random Forest crisis predictor — all trained on 52,000 synthetic behavioral records across 5 clinically-calibrated loneliness profiles. The results include a Social Health Score from 0 to 100, a Loneliness Fingerprint across 5 behavioral dimensions, type probabilities showing model confidence, a signal breakdown showing exactly which behavior costs how many points, and a personalised 4-week recovery blueprint derived entirely from real answers.
Three AI agents then act on your behalf. The Environment Scanner finds social opportunities in your city matched to your personality type and loneliness fingerprint. The Crisis Interceptor monitors the 6-week pre-crisis window and activates before you feel the need to seek help. The Drift Interceptor — our most novel feature — reconstructs when your social collapse began, identifies the root cause, prescribes the single highest-leverage turning point action for your specific pattern, and calculates your 30-day recovery probability with and without the intervention. Every assessment also generates a downloadable clinical-grade PDF report shareable with therapists, doctors, and university wellbeing teams.
How We Built It
We started with the data. A synthetic behavioral dataset generator produces 52,000 records across 2,000 simulated users over 26 weeks, with five clinically-calibrated loneliness type profiles and realistic temporal drift patterns. Each record contains 20 features — 15 behavioral and 5 demographic — with type distribution calibrated against published epidemiological data.
Three Scikit-learn models were trained on this dataset. The 8 onboarding answers are mapped to continuous behavioral features via calibrated lookup tables grounded in clinical research thresholds — the 5-contact threshold from Cacioppo et al. 2008, the late-night isolation marker, the weekend void effect.
The application is built entirely in Streamlit with a custom dark-theme CSS system. All 14 charts are rendered via Matplotlib using a strict BytesIO buffer pipeline — every figure saved to PNG bytes and displayed via st.image() — eliminating Streamlit's chart output leakage entirely. Clinical-grade PDF reports are generated via ReportLab using the canvas API.
The Drift Interceptor uses a behavioral inference model that estimates drift duration from the combined severity of multiple signals — night activity, weekend score, future thinking, and initiation ratio — then maps the combination to a root cause decision tree and a science-matched turning point intervention.
Challenges We Ran Into
The white block problem was the most persistent technical challenge. Streamlit intercepts bare expression return values and renders them as JSON widgets. List comprehensions like [s.set_edgecolor() for s in ax.spines.values()] return [None, None, None, None] — which Streamlit displayed as white blocks with NULL values. Twelve such comprehensions were scattered across chart functions before we identified the pattern and converted all of them to proper for loops. Matplotlib figure leakage caused GridSpec objects to serialize into Streamlit's output stream. We enforced a strict rule — every chart uses only plt.subplots(), every figure is saved to a BytesIO buffer and fully closed before Streamlit sees it.
JavaScript does not work inside st.markdown(). We built an animated score count-up using setInterval, only to discover that Streamlit renders markdown inside an isolated iframe. document.getElementById() always returns null. The score stayed at zero for every user. We removed all JavaScript and rendered the real score directly via Python f-strings.
Making the Drift Interceptor feel real without overclaiming required careful design. Reconstructing a timeline from 8 answers without historical data risks feeling like fiction. The solution was presenting it as behavioral inference with transparent signal contributions — "estimated from your night activity, weekend score, and future thinking patterns" — rather than a definitive date.
Accomplishments That We're Proud Of
The Drift Interceptor is genuinely novel. No mental health tool anywhere reconstructs a social collapse timeline from behavioral inference alone — not Headspace, not BetterHelp, not clinical assessment software used in hospitals today. The idea that 8 questions can tell you when your drift began and what specifically caused it is the core innovation of Tether.
Every number in the app is derived from the user's real answers. Different answers produce completely different outputs. The app is a real instrument, not a demo with hardcoded results. The micro-insight system delivers 40 answer-specific insights grounded in peer-reviewed citations, contextually after each onboarding question. Most apps give you a result at the end. Tether teaches you while you answer.
The PDF report generates a clinical-grade document a user could hand to a therapist. Most hackathon projects disappear when you close the browser. This one gives you something you can take away. After extensive debugging, the app renders with zero white blocks, zero null outputs, and zero HTML leakage across all 14 charts and all 5 result tabs — which sounds like a low bar until you have spent hours hunting invisible list comprehensions.
What We Learned
Behavioral proxies are more powerful than we expected. Eight carefully chosen questions — calibrated against clinical research — produce enough signal to run a meaningful ML classification without wearables, without passive data collection, and without months of historical tracking.
The framing matters more than the features. "Social Health Score" lands differently than "Loneliness Score." "Drift Interceptor" lands differently than "Timeline Chart." "6 weeks before you feel it" is not a feature description — it is a product promise. Naming is design.
The 6-week window is the entire emotional core of the product. Every feature flows from that one insight. The moment a user understands that we can see the drift before they feel it — that is when Tether stops being an app and starts being an instrument.
Working with Streamlit rather than against it — using st.image() instead of st.pyplot(), using st.columns() instead of CSS grid, never using JavaScript inside markdown — produces dramatically more stable results than trying to force it to behave like a traditional web framework.
What's Next for Tether
Passive behavioral integration — connecting to real data sources with consent: message metadata, smartphone usage patterns, sleep data from wearables. The 8-question assessment becomes the onboarding layer. Passive data becomes the ongoing instrument. The score updates weekly without any user effort. Longitudinal tracking — weekly check-ins that track your real Social Health Score over time, showing actual drift instead of reconstructed drift. The 6-week early warning becomes a live alert instead of an estimate. Clinical validation — partnering with university psychology departments to validate Tether's behavioral instrument against established clinical measures including the UCLA Loneliness Scale and the De Jong Gierveld Loneliness Scale. The goal is a peer-reviewed paper establishing Tether as a validated clinical instrument. B2B platform — university and corporate dashboards showing population-level social health patterns without individual identification. A wellbeing officer sees aggregate risk cohorts and deploys resources where the data says they are needed, not where people happen to complain. WhatsApp and Telegram integration — allowing the Crisis Interceptor and Drift Interceptor agents to send real messages through existing platforms the user already uses, making the intervention invisible and frictionless.
The instrument exists. The data is there. 1 billion people are drifting in silence. Tether is choosing to listen — and the next step is making sure it never stops.https://nfimrmuqt5xbdgfguujstv.streamlit.app/
Built With
- matplotlib
- numpy
- pandas
- python
- scikit-learn
- streamlit

Log in or sign up for Devpost to join the conversation.