Inspiration
Mental health issues can affect individuals from all walks of life, posing a huge burden to individual productivity and happiness. While recovery is possible with treatment and intervention, many vulnerable populations may not have access to adequate mental health treatment, or are unaware of treatment options available. If these subpopulations are promptly identified early, policies can be put in place for targeted outreach to these groups to promote early intervention before mental health issues reach the critical points in disease progression.
At the same time, vulnerable populations may also show less mental resilience and experience more severe mental health effects when faced with natural disasters, since they often face more social and economic challenges. For example, a snow storm may have a larger impact on single moms compared to whole families, as single moms may have a larger burden for paying bills and taking care of her kids at the same time.
In this project, we explored the BRFSS 2017 dataset and determined the subpopulations from each state most at risk of suffering from poor mental health. Next, we analyzed mental health resilience in two prominent disasters in 2017, namely the crippling snowstorm in Northeastern US and Hurricane Irma in Florida. We determined that individuals who are poor are significantly more likely to suffer from mental health issues during the aftermath of these disasters compared to the general population. Finally, we also explored the temporal trends of poor mental health across states and hypothesize that these are affected by major events in the state.
The Statistical Models
Our investigation of the factors that adversely affect the mental health of vulnerable population strata is organized as followed: Regression model to explain correlation between different socioeconomic status, membership in ethnic/minority group, and the self-reported state of mental health Regression-based causal model with difference-in-difference (DD) estimator to analyze the effect of catastrophic event such as Hurricane Irma or the 2016 Snow Storms on the socioeconomically vulnerable groups of the affected area.
Correlation between social factors and state of mental health:
We decided to model the effects of social factors such as Income, membership in ethnic/minority group, education level and the state of mental health. We decided to use the MENTHLTH variable as a proxy for mental health condition, where interviewees responded to the following question: “Now thinking about your mental health, which includes stress, depression, and problems with emotions, for how many days during the past 30 days was your mental health not good?”
Towards the end of establishing correlation between social-economic factors and mental health conditions of interviews, we develop a Negative Binomial Regression. There are several reasons why we believe that this is an appropriate approach to model these effects:
- The measured dependent variable is Count of days of mental health issue, which we finds to follow a distribution that resembles a negative binomial distribution.
- For policy makers or advocates, modelling the raw number of counts is usually not a topic of interest. Instead, we usually want to model the ratio of poor mental health days between a specific group vs a control group (e.g: the ratio difference of poor mental health days between Poverty-level respondents vs Middle Income Respondents). The coefficient of the Negative Binomial Regression provides a natural interpretation of this nature.
- Most importantly, during data diagnostic steps, we realized that while the mean value of MENTHLTH varies according to the social economic factor (which suggests that social economic factors are good correlators to mental health state), the variance of these social economic factors are higher than their mean values. This phenomenon suggests that over-dispersion, where data is naturally clustered, is present and causing distortion in the estimate of Standard Error (SE) in simple method such as Poisson Count model.
Thus, for each state, we fit a negative binomial regression model and report the top 3 social economic factors that are estimated to have the largest effect of the change in mental health. Although the robustness of these models are limited by the small amount of data associated with each state, we found some general trends across all states: The ratio of poor mental health days between the lowest income group and the general population was 3 to 1 Minority groups such as Asian and African Americans (as compared to general population) has higher number of poor mental health days experienced by the ratio of 4 to 1.
The effect of catastrophic event on the mental health conditions of socially vulnerable group

Our analyses logically exploit 2 catastrophic events (Hurricane Irma and the 2016 snowstorm) as natural experiments where mental health outcomes of individuals are examined across pre- and post-exposure time periods, as well as exposed and unexposed areas. A regression-based Difference-in-Difference procedure is used to isolate the independent mental health impacts these natural events had on affected persons.
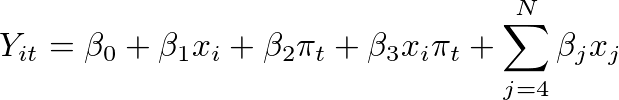
The logic of DD analysis is as follows. Let $$t = 0$$ denote the pre-exposure period, $$t = 1$$ denote the post-exposure period, and $$Y_{it}$$ denote the mental health condition for person $$i$$ in period $$t$$. A regression-based estimator is modeled as:

Where $$x_i$$ is a dummy variable assuming a value of 1 if an individual resides in an exposed area and 0 if the individual respondent resides in an unexposed area, and $$\pi_{t}$$ is a dummy variable taking a value of 1 if an individual is surveyed in the post-exposure period and 0 if the respondent was interviewed in the pre-exposure period. The DD estimator is $$\beta_3$$ (the coefficient of interaction between $$x_i$$ and $$\pi_{t}$$). Our DD estimator assumes a value of 1 only for individuals in exposed areas and interviewed in the post-exposure period.
DD parameter estimates are statistically adjusted by the physical health, social support, income, education, and marital status of each respondent.
We found a significant (though modest) increase 4% in days of bad mental healths conditions across the pre and post-exposure period. More importantly, we found that population with the lowest income experiences a 67% increase in days of bad mental healths conditions as compared to general population in the unaffected area.
This supports our hypothesis that natural disaster is a disproportionate mental burden for disadvantaged population strata
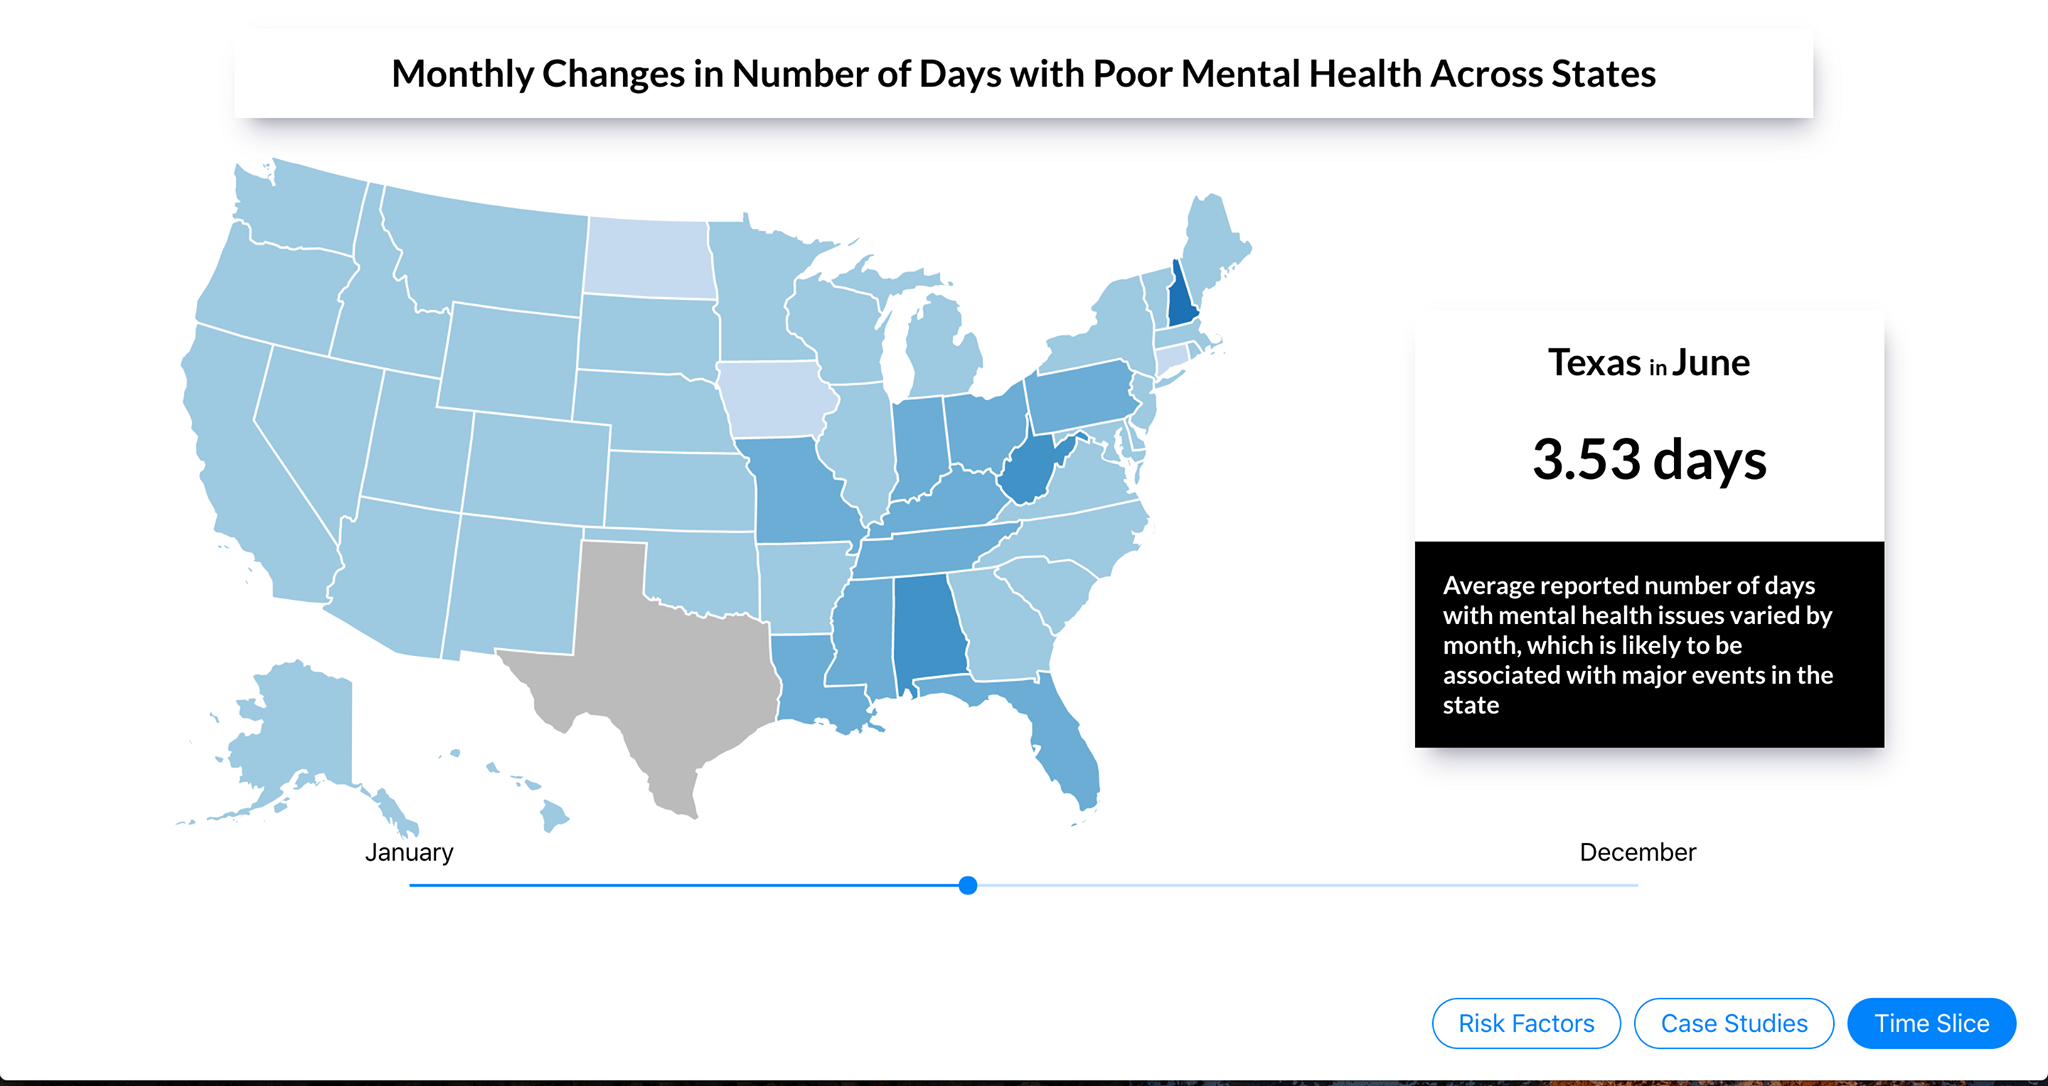
The User Interface
Our user interface is a website built using React.js that allows an interactive holistic user experience. The user can freely view summarized information about any state in any time slice of the dataset. Moving down to the finer level, the user can look at specific case studies relating to major disasters and understand the context behind each scenario. This intuitive interface allows the general public to learn more about the underlying structure of mental health issues, while informing activists and policy makers on several key statistics.
Challenges we ran into
The initial preprocessing of data took longer than expected due to the formatting of the data file. Furthermore, we spent a lot of time deliberating on which set of variables to analyze, as well as choosing the most appropriate data science techniques.
Accomplishments that we’re proud of
We are proud of the sleek, simple user interface that facilitates the viewing of mental health patterns and trends across different demographic groups. The final analysis shows a summarized view of the most important factors, allowing users to learn the main points without getting overwhelmed.
What we learned
We learnt a great deal on binomial and counting regression techniques for extracting relative risk ratios between populations. In addition, we learnt that there were always many hidden dimensions within a dataset that one could only see after rigorous processing and analysis.
What's next?
A useful and viable extension would be to source disaster data as a list and integrate it into our current system in order to generalize to a wider scale. In addition, we want to port this interface to different platforms (e.g. mobile devices) to facilitate a greater range of end-users.

Log in or sign up for Devpost to join the conversation.