Inspiration
New York City is home to 600+ community gardens that provide food, green space, and places for neighbors to connect while holding decades of neighborhood history and collective memory. Yet community gardens have faced threats from development and displacement for decades, making their long-term resilience difficult for the public to understand.
We wanted to make that invisible vulnerability visible—and help people understand that protecting a garden is about more than protecting a patch of land. Existing garden maps from NYC Parks and other organizations are useful for finding gardens, but they don't tell the full story. They are primarily designed as directories: they can be information-dense, difficult to navigate, and largely rely on official sources to maintain the information.
I wanted to move from a static directory to a living picture of garden resilience—one that helps people understand what puts a garden at risk and what they can do about it.
What it does
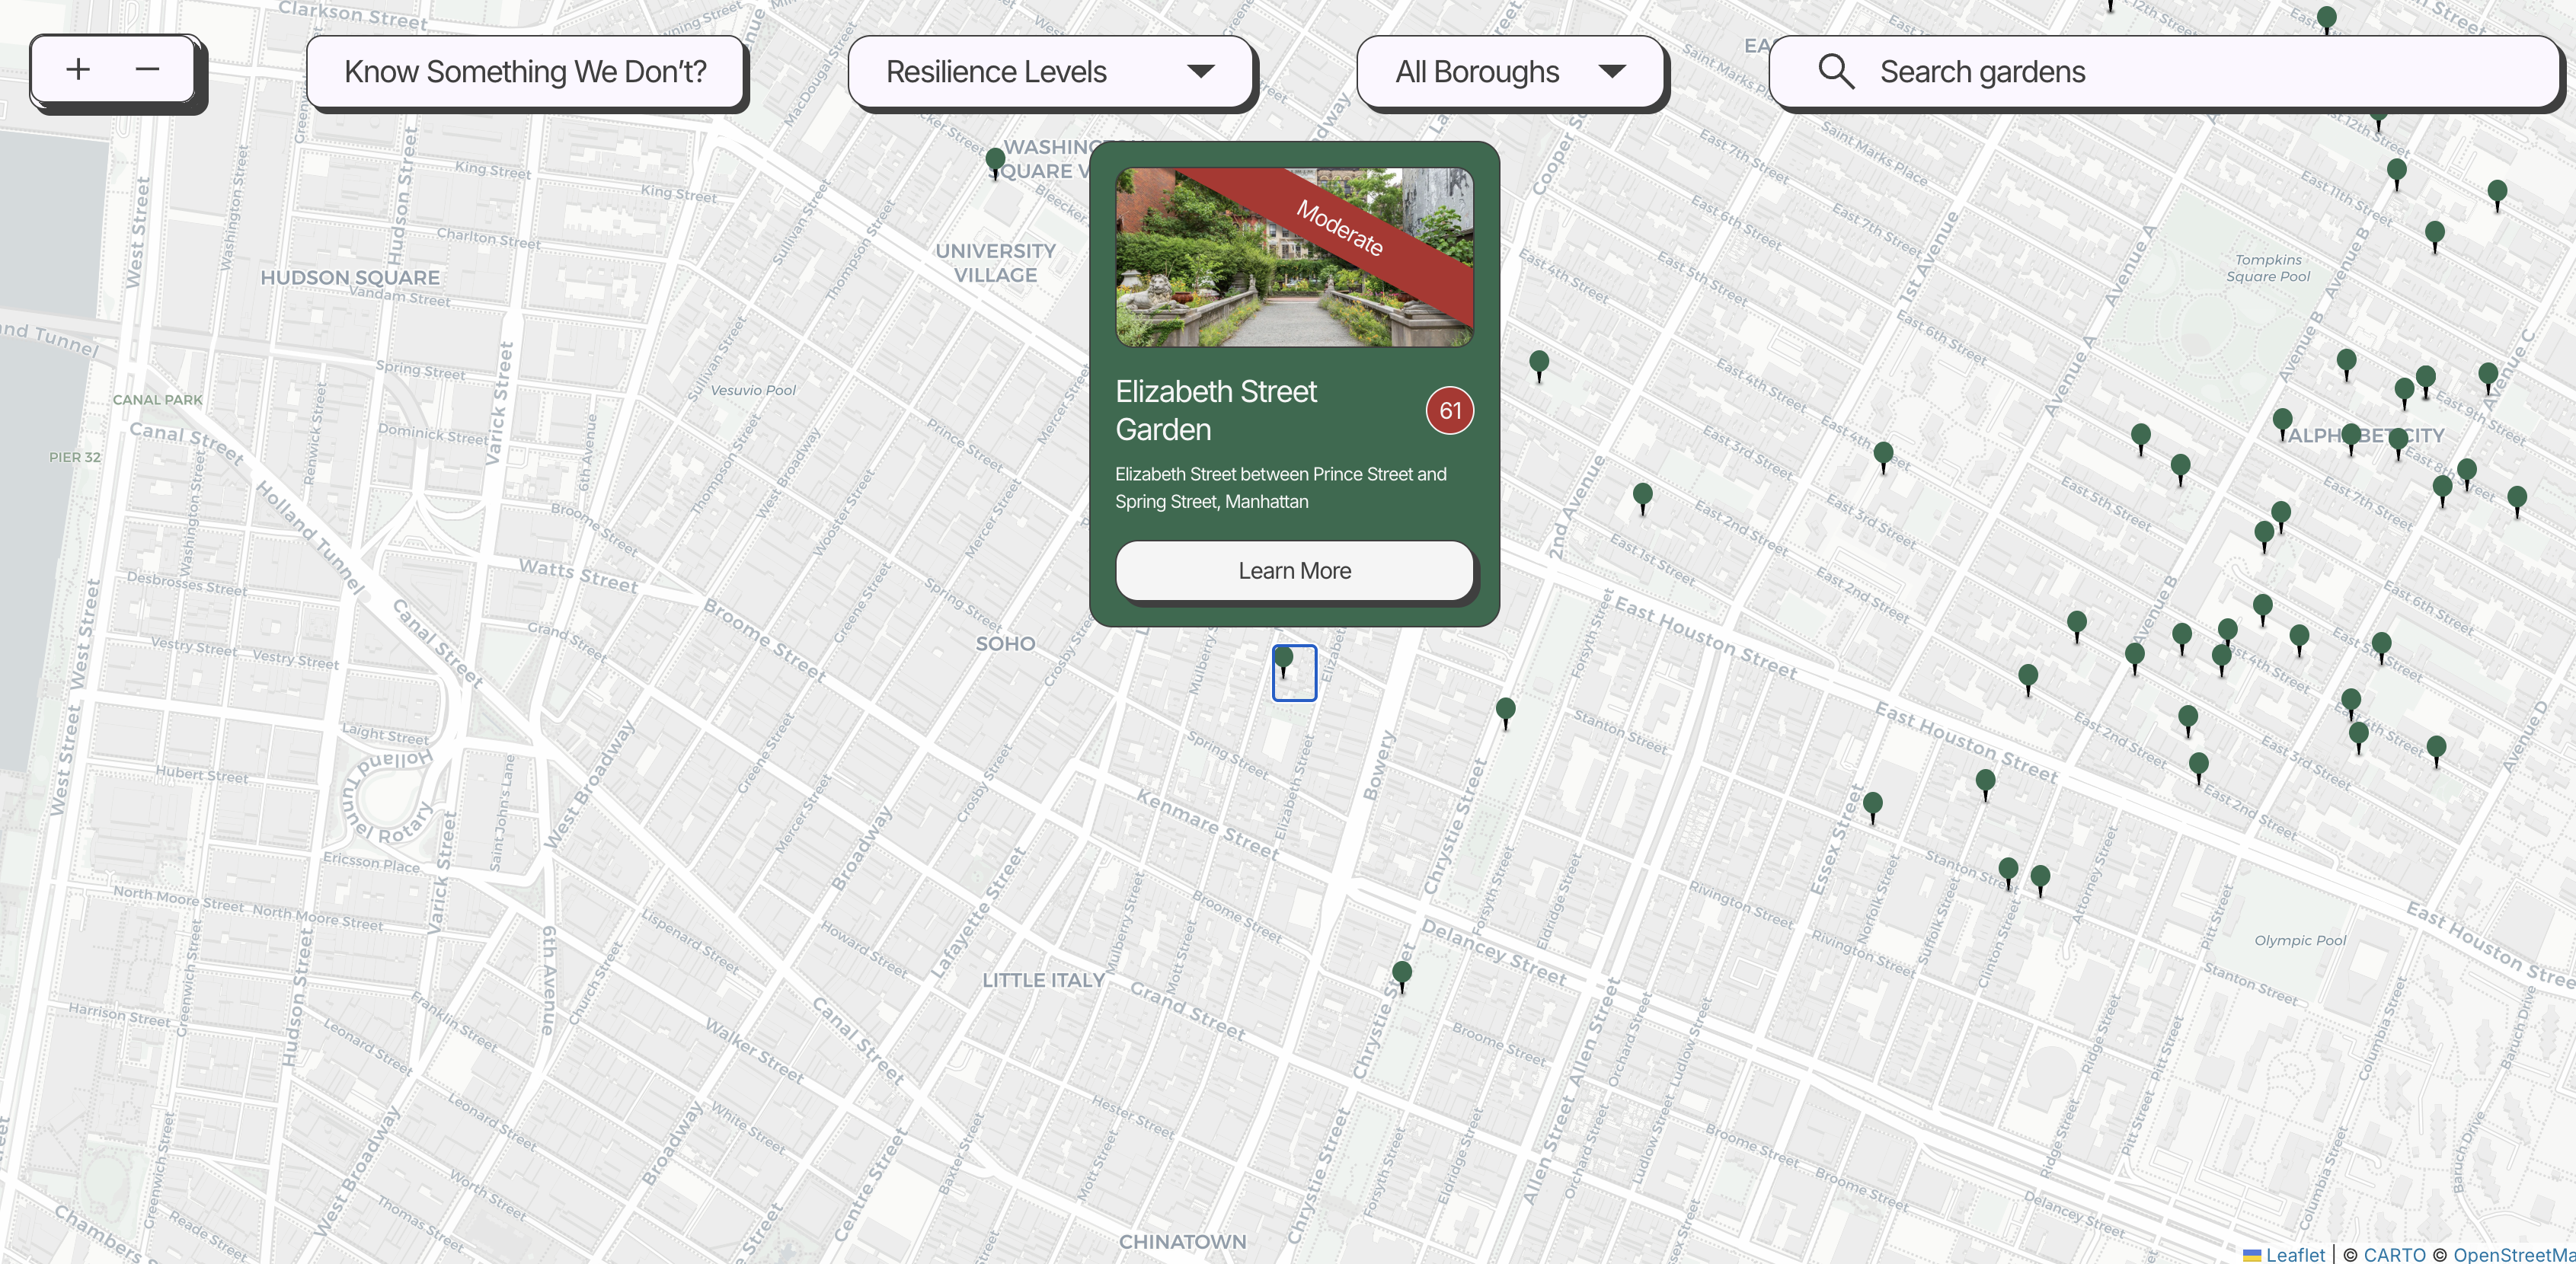
Rooted NYC is an interactive web app that helps people explore the resilience of NYC community gardens. Each garden receives a resilience score based on four dimensions: Land Security, Policy Support, Development Buffer, and Community Stewardship. Rather than simply telling users which gardens are vulnerable, Rooted NYC explains why and provides concrete actions people can take to help strengthen their local gardens.
How we built it
Open Data Used
- NYC Open Data — GreenThumb Garden Info for Name, address, borough, Parks id, BBL, lat/lon, jurisdiction (juris), license status, community board, council district, zip.
- NYC Open Data — GreenThumb Garden Lots for Lot size in sq ft, joined on Parks id.
- NYC Open Data — MapPLUTO for Zoning district, built FAR, residential/commercial/facility FAR, lot area, and a second lat/lon. Looked up in BBL batches of 40. Unused air rights = max FAR − built FAR. That is the main development-pressure input.
Stack
- Frontend: React, TypeScript, Tailwind, Leaflet
- Backend: Express in server.ts, same process as Vite in dev
- UI: Figma MCP -> Cursor
Data Flow
- Server starts → fetch GreenThumb gardens + lots → enrich BBLs with MapPLUTO → merge seeds → apply curated overlays → cache.
- Client asks /api/gardens (borough, resilience band, search).
- Server scores each cached garden with current crowdsource reports and returns pins + breakdowns.
- Profile view uses that score, category evidence, visuals catalog, and lot bounds. No extra GIS service.
Building Score Calculation On each API request, calculateGardenResilience() in src/services/resilienceEngine.ts runs. Higher is more resilient. Development Pressure is inverted: a higher number means less pressure.
- Policy Support (0–20) GreenThumb license, commercial/M zoning, high-pressure zip list, curated pluses (e.g. parkland)
- Land Security (0–35) Jurisdiction: land trust 35 → Parks 30 → city agency 18 → NYCHA 14 → HPD 8 → private 4
- Development Buffer (0–25) Unused FAR, surrounding density, nearby development, large-parcel flag
- Community (0–20) Steward group, verified threat reports (each active report −3)
Each category also emits evidence bullets: a short title, Did you know? (the term), and What does it mean? (this lot). Those power the flipped score cards.
The engine also emits recommended / public actions (council letter, GreenThumb license, community board, etc.) used on Act and on the purple “I will make a difference!” cards.
Challenges I ran into
The biggest challenge was turning complex, fragmented civic data into something people could actually understand. There is no single dataset that tells us whether a community garden is “resilient.” I had to determine which factors matter, find appropriate public data for each one, and develop a scoring framework that was both meaningful and understandable without oversimplifying the realities of land use, development, and community organizing.
Accomplishments that I'm proud of
I’m proud to have turned complex civic data—land jurisdiction, planning policy, development potential, and community stewardship—into a resilience score that people can actually understand and explore. I'm especially proud of the soil, water, sunlight, and care metaphor, which gives the scoring system a simple, human framework without losing the complexity behind the data.
What we learned
Resilience cannot be reduced to binary indicators. A high unused FAR, for example, can signal development potential without necessarily meaning a garden is at immediate risk. The meaning of each data point depends on its surrounding context and its relationship to other factors.
What's next for Rooted NYC
With more time, I’d continue making Rooted NYC more accurate, actionable, and community-driven.
I want to use Google’s image and machine learning tools to overcome the limitations of existing datasets and provide richer visual information, while connecting each garden directly to its official website and social channels for the most up-to-date information.
I also want to make taking action as frictionless as possible. Instead of asking users to search for where to volunteer, sign a petition, or contact an organization, each action would link directly to the place where they can do it.
Finally, I'd introduce a personal progress system where users can track actions they’ve taken and resources they’ve explored, helping turn one-time engagement into an ongoing habit of community stewardship.
Built With
- cursor
- figma
- google-ai-studio
- vercel

Log in or sign up for Devpost to join the conversation.