-
-

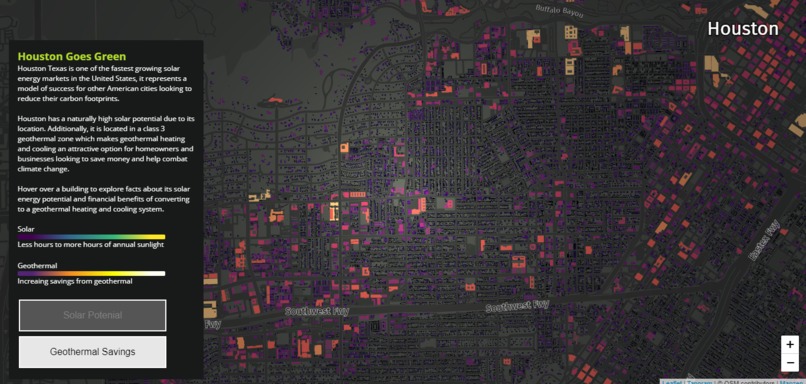
Solar Mode zoomed out
-

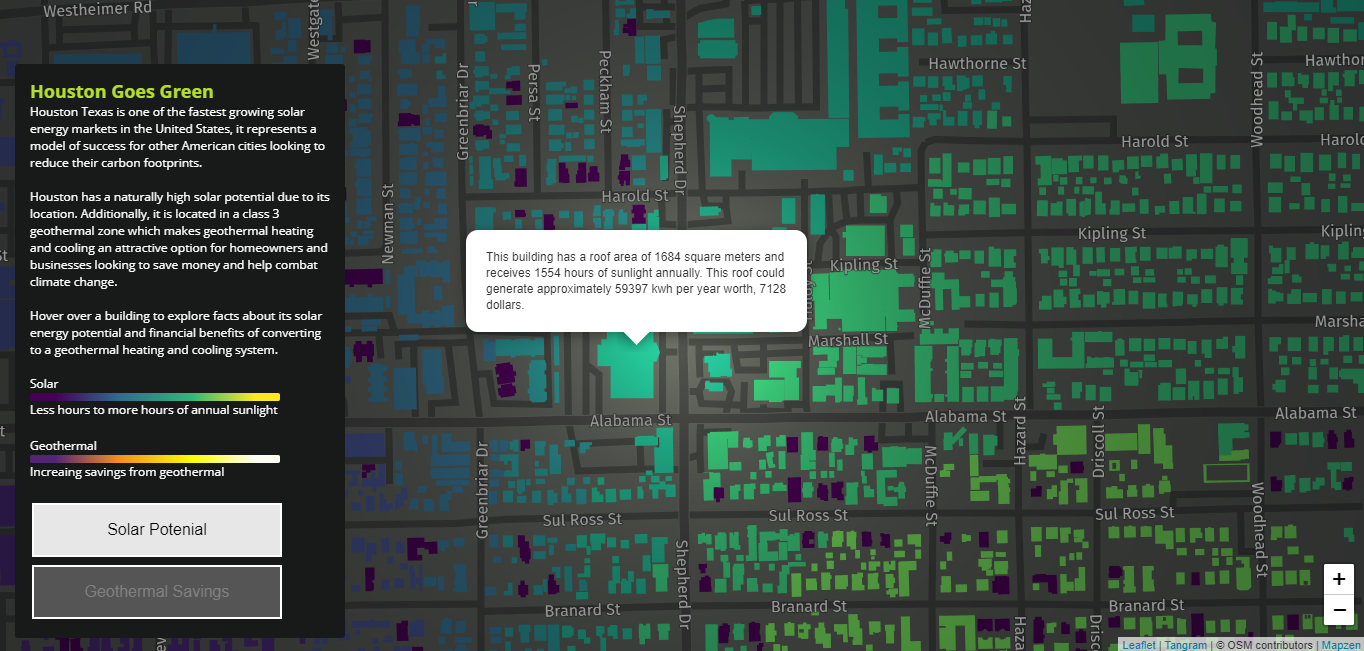
Solar Mode zoomed in
-

Solar Mode with building information
-
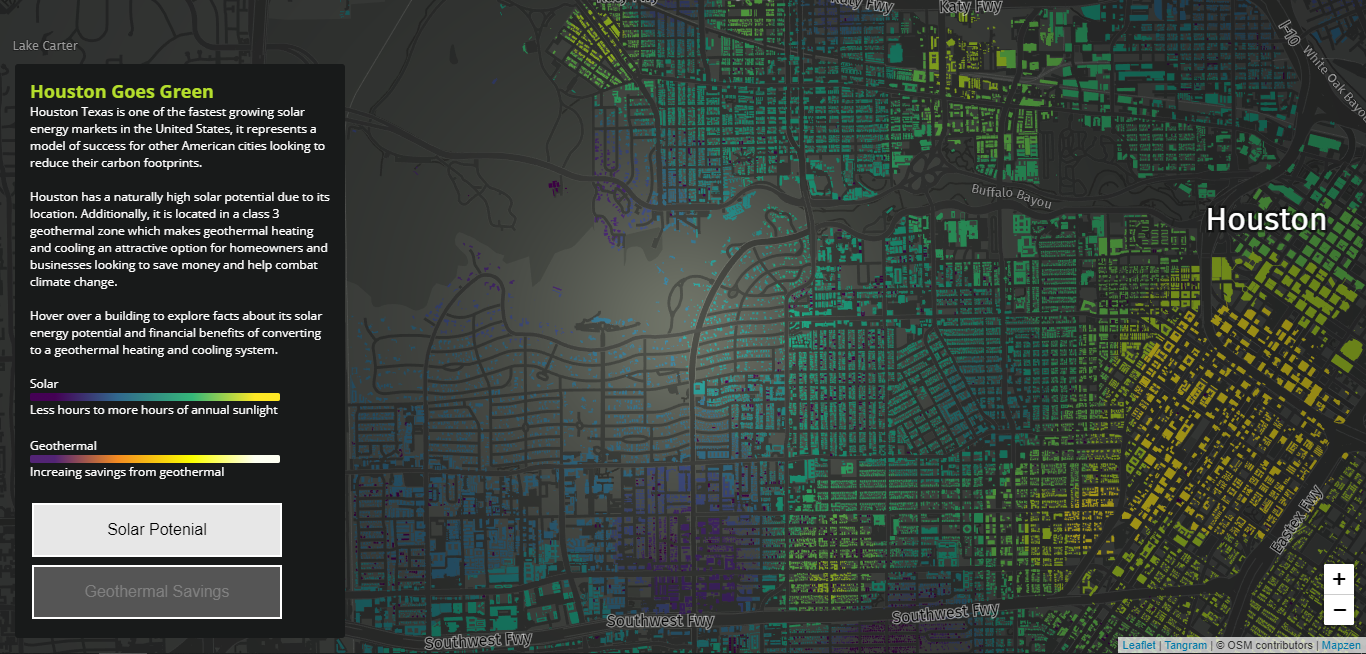
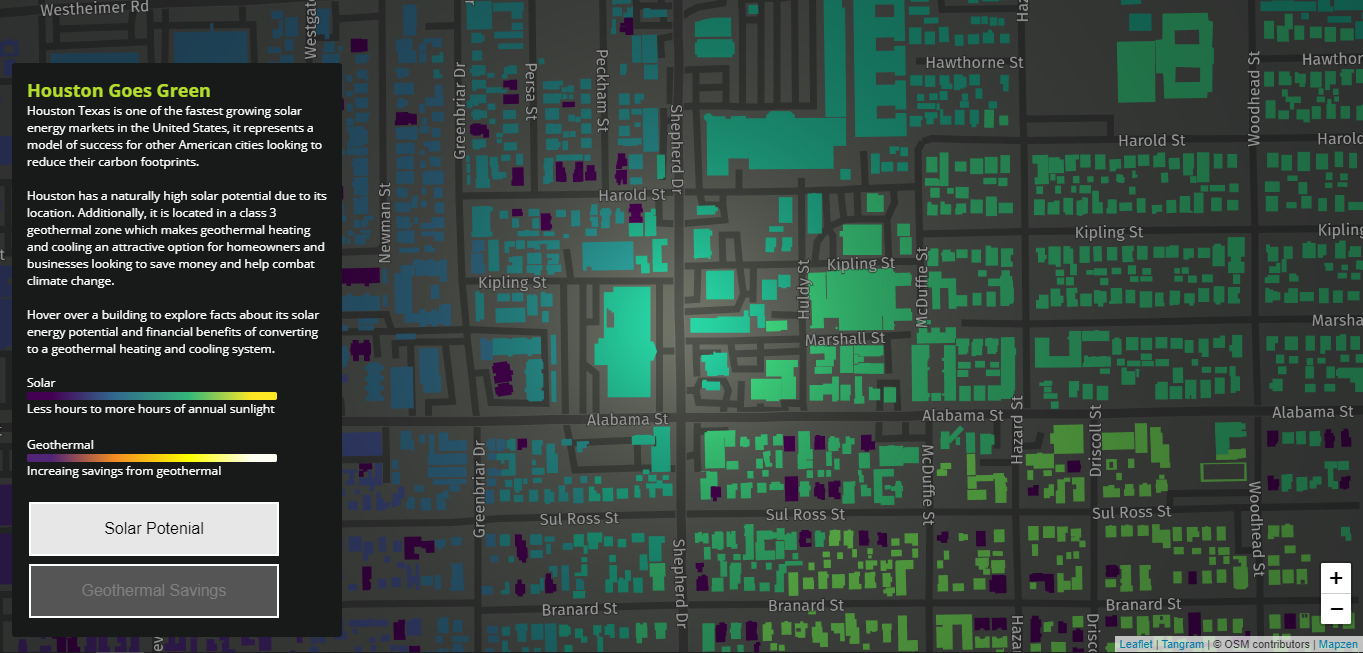
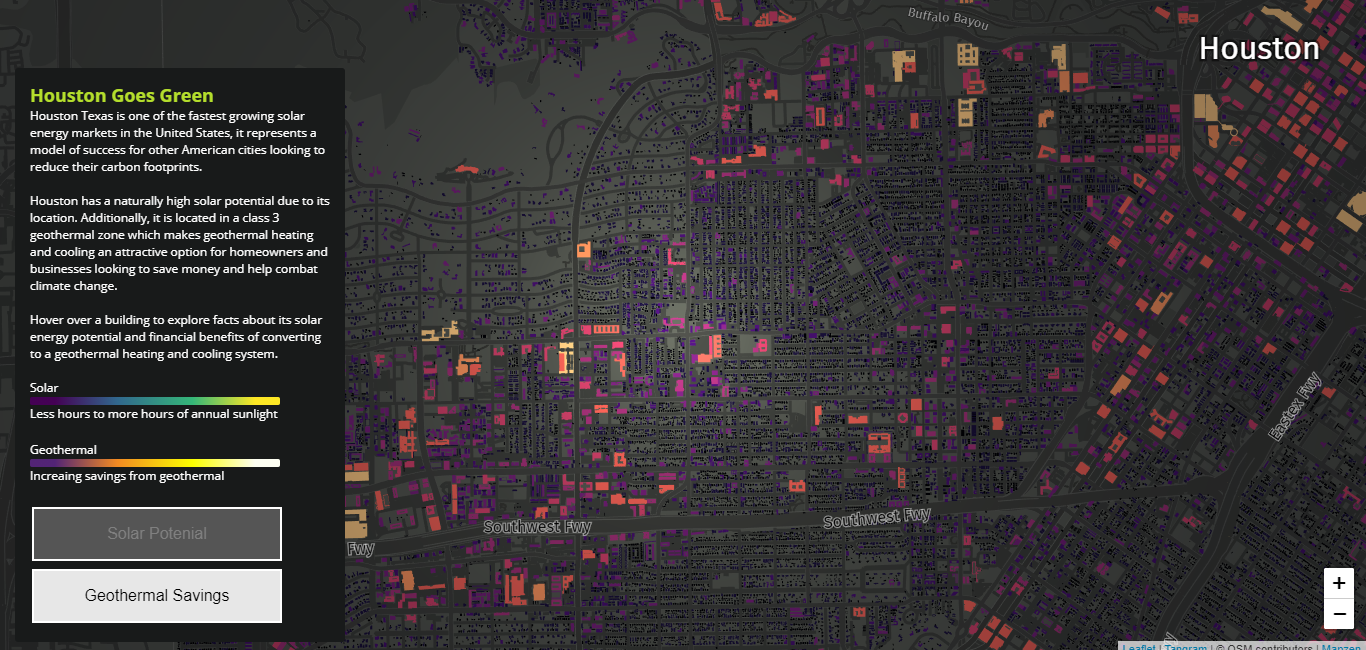
Gethermal Mode
-
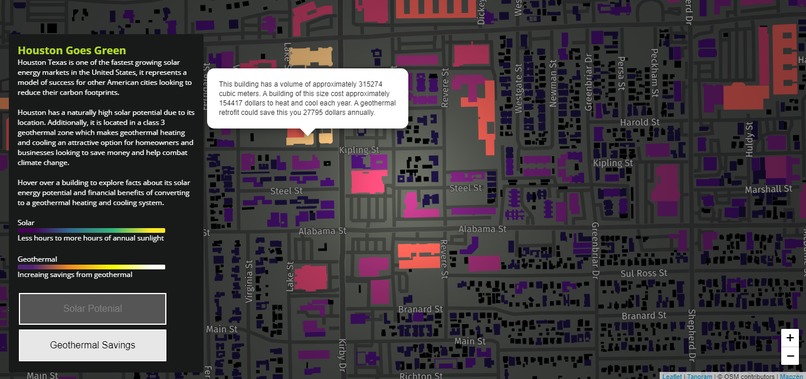
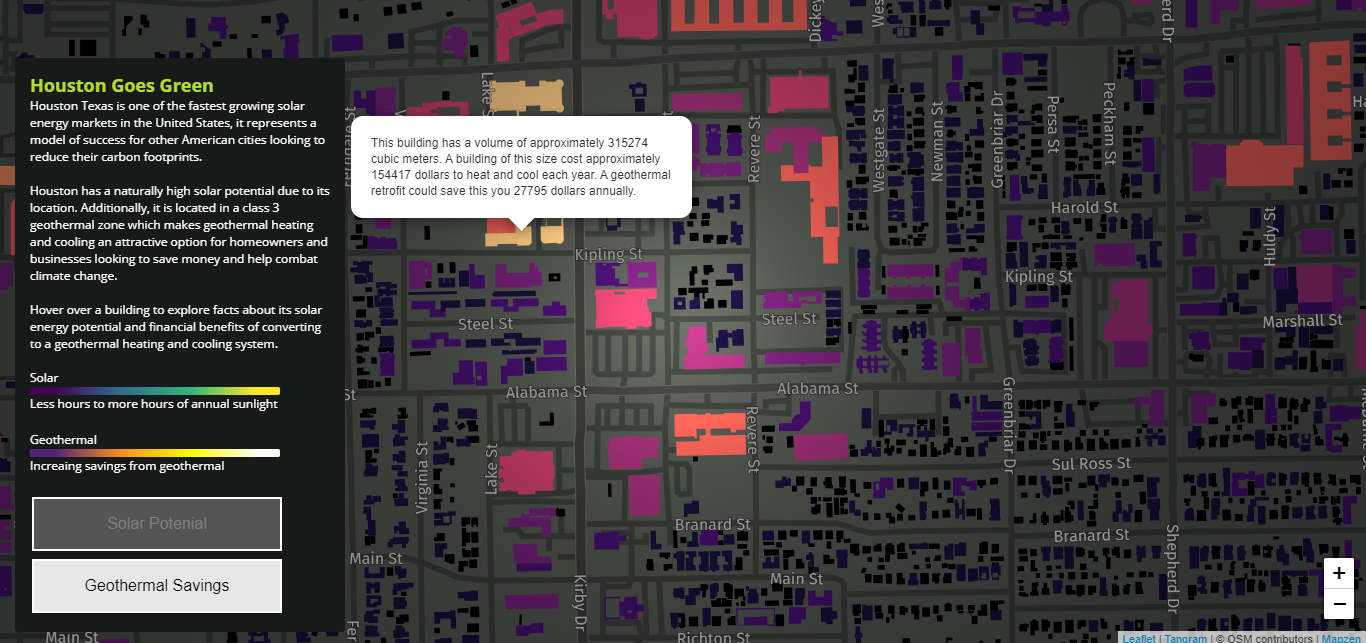
Geothermal Mode with building information
Inspiration
Houston Texas is one of the fastest growing solar energy markets in the United States, it represents a model of success for other American cities looking to reduce their carbon footprints. Houston has a naturally high solar potential due to its location. Additionally, it is located in a class 3 geothermal zone which makes geothermal heating and cooling an attractive option for homeowners and businesses looking to save money and help combat climate change.
What it does
This app allows homeowners, entrepreneurs, and government personnel the ability to investigate the benefits of leveraging solar and geothermal energy in their homes, business, and facilities.
In solar mode users can view the roof area of each building, the annual hours of sunlight the roof receives, the amount of energy a solar installation could generate as well as its approximate market value.
When users switch to geothermal mode they can view the volume of each building, the annual cost of heating/cooling each building and the annual savings.
Home and business owners may use this tool to investigate the financial benefits of switching to solar power and geothermal heating/cooling systems. Government personnel may use this app to identify which buildings or areas of the city would benefit most from solar and geothermal retrofit incentive programs.
How I built it
This map is a simple interactive data viewer built using leaflet tangram and Here Data Hub. I downloaded building footprints for Houston from Here data layers and enriched them by adding information about solar energy and geothermal potential. Solar potential data was calculated from the roof top area, modeled annual solar hours data and a solar resource coefficient. Annual heating and cooling costs are based off the volume of the building and assume a natural gas heating system.
Challenges I ran into
The most difficult aspect of developing this app was accurately modeling annual hours of solar energy across the city. I chose to model solar hours using weather data obtained from the NOAA weather database in Houston. I was able to calculate the number of cloud free hours of annual sunlight at each monitoring site near Houston and then interpolated these values across the entire city. Once I generated the city-wide solar hours surface, I was able to aggregate an average annual solar hour’s value for each building footprint. This analysis was conducted in QGIS and was a seamless process given how easy it was to download and enrich the building layer provided by Here.
Accomplishments that I'm proud of
I am really proud of the cartographic work I did in this app. Tangram Play works really well with Here Data Hub and makes for a seamless data styling workflow.
What I learned
The biggest take away from this project was how easy it is to serve vector data to web maps from Here data Hub. Using vector tiles significantly reduces loading times compared with raw geojson and it was so nice that I could do this with my here credentials.
What's next for Houston Geos Green
The next steps for Houston Goes Green is to improve the UI by allowing users to dynamically calculate solar and geothermal saving by specifying attributes about a building such as the type of heating/cooling system, insulation quality, the type of solar system they would like to instal etc.
Built With
- css3
- here-data-hub
- html5
- javascript
- leaflet.js


Log in or sign up for Devpost to join the conversation.