RiskScope Project
Inspiration
The inspiration for RiskScope stems from the increasing complexity of disaster recovery management and the role of insurance pricing in the context of disaster-prone areas. By leveraging FEMA’s disaster management data, we wanted to build a system that could analyze disaster-prone zones and predict insurance prices in relation to disaster frequency and severity. This would help businesses and individuals make informed decisions regarding insurance in different states, ultimately improving the disaster recovery process and preparedness.
What it does
RiskScope is a data analysis project that uses FEMA disaster management datasets to:
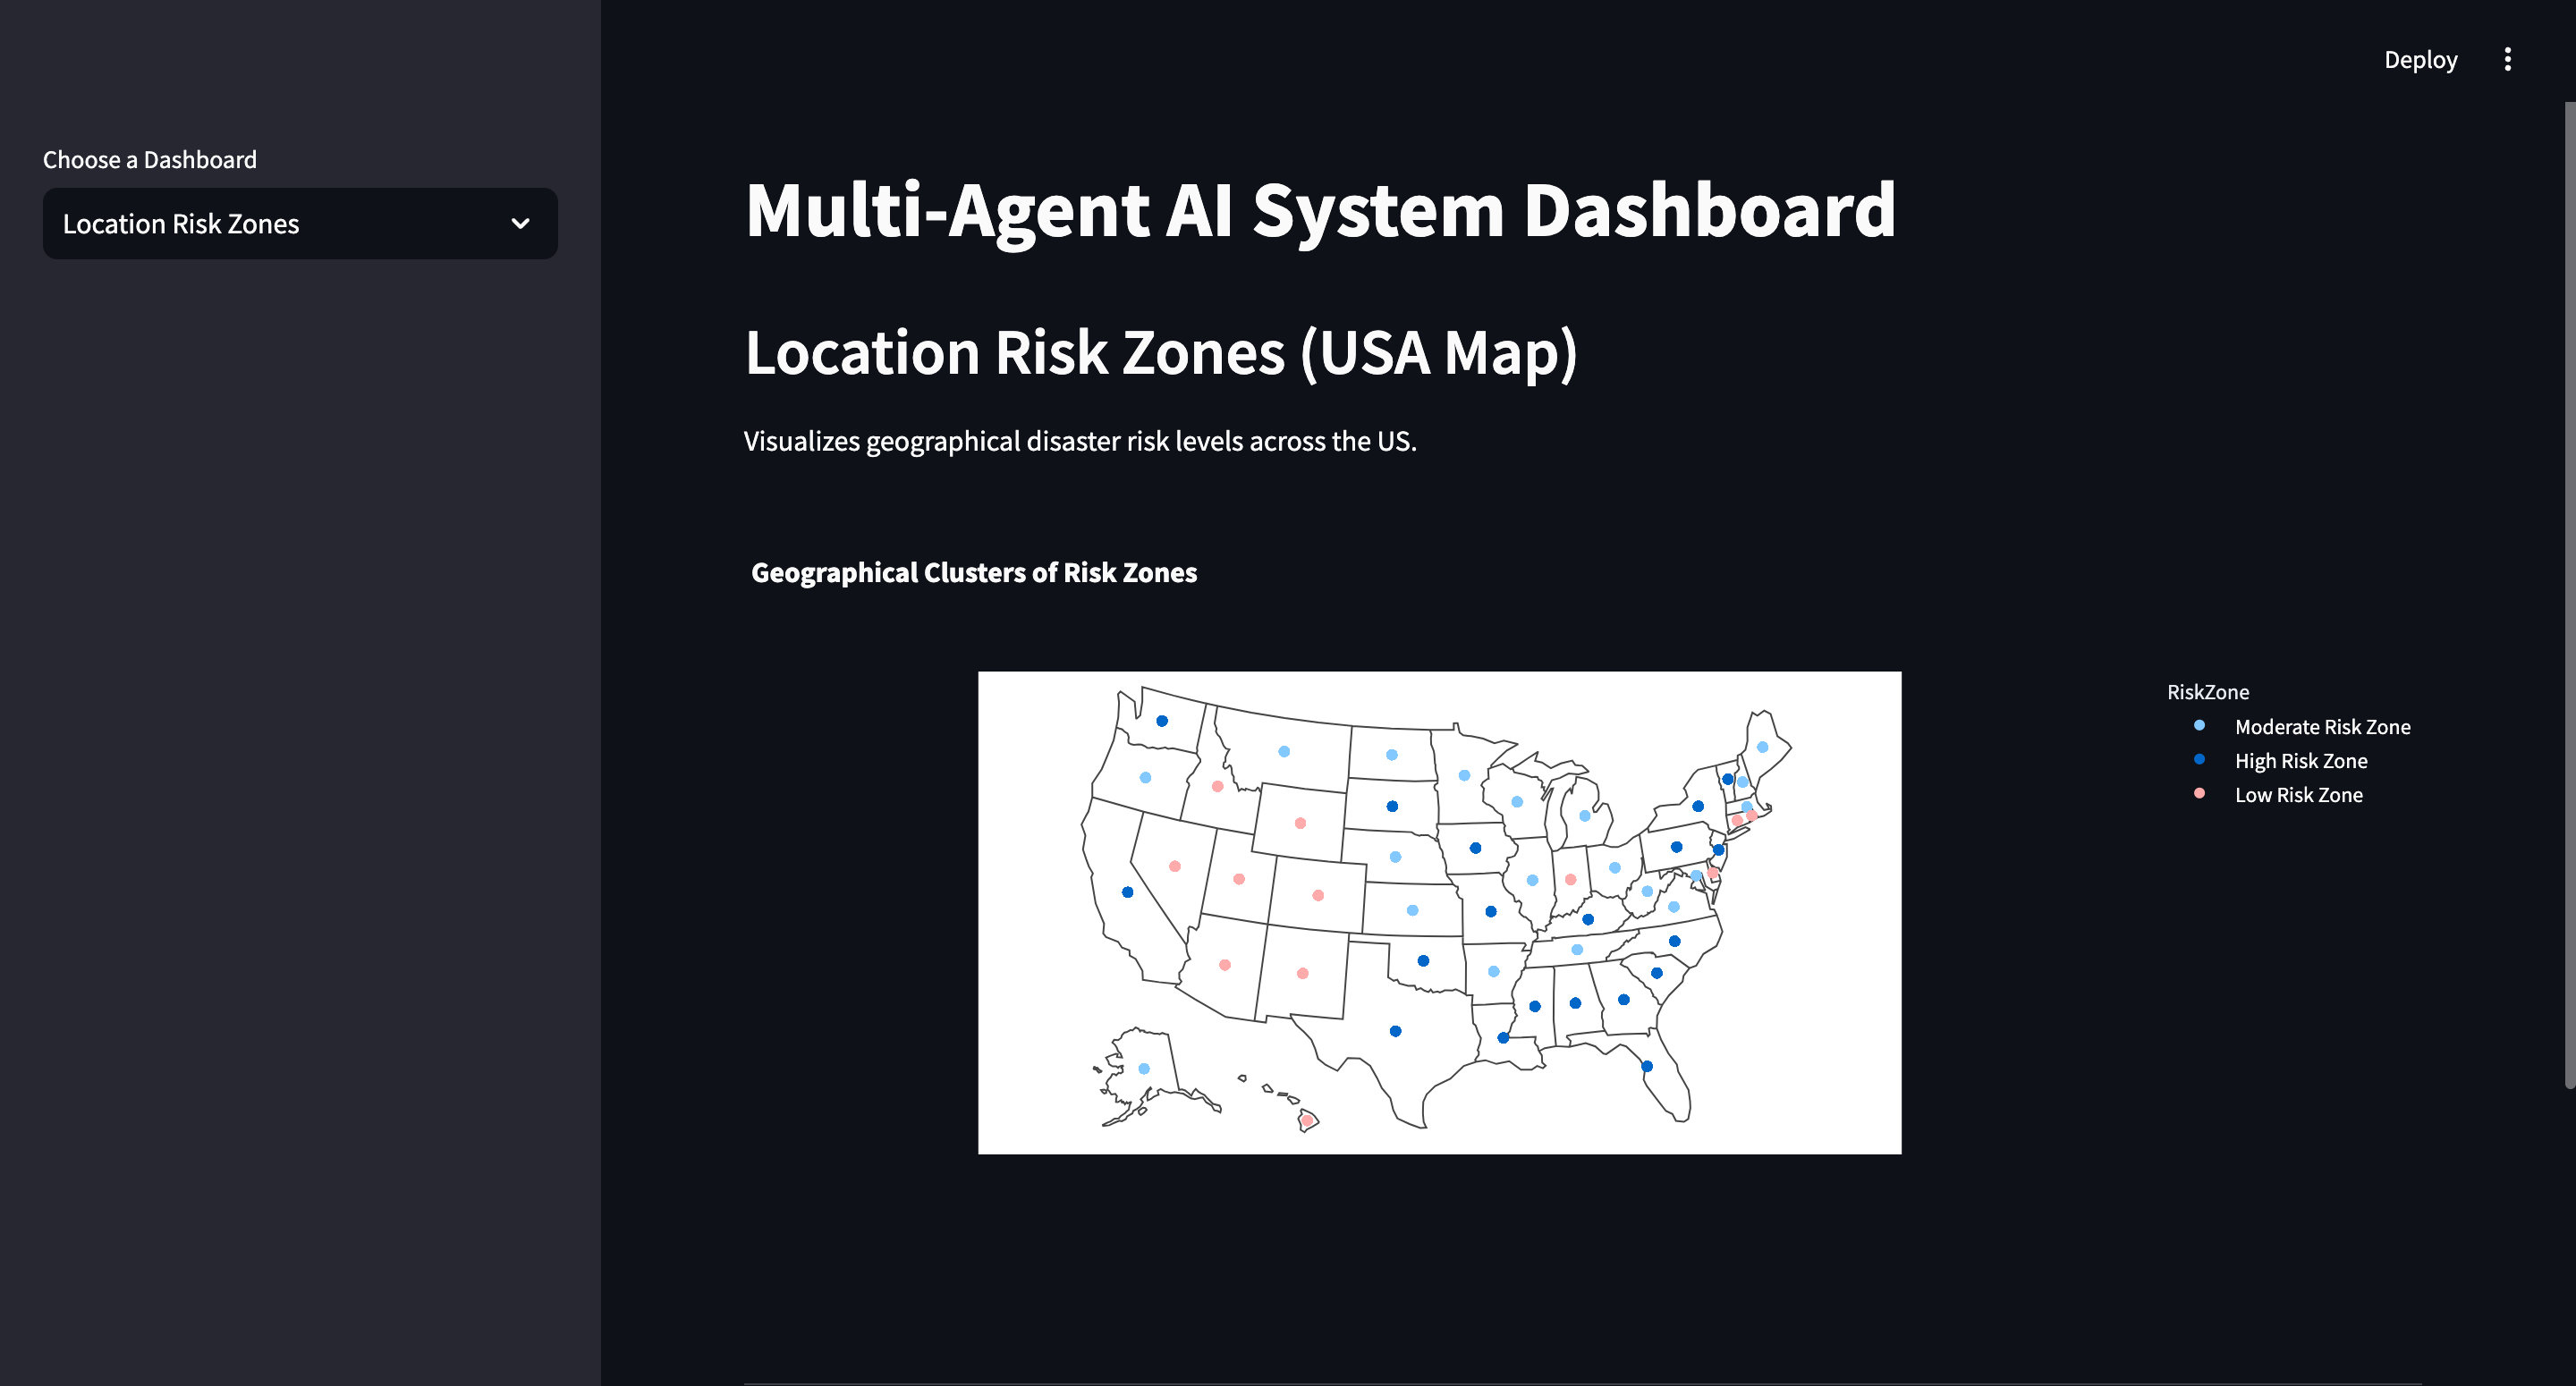
- Identify Risk Zones: Based on the frequency and severity of disasters, the system categorizes states into different risk zones, which help in understanding where natural disasters are more likely to occur.
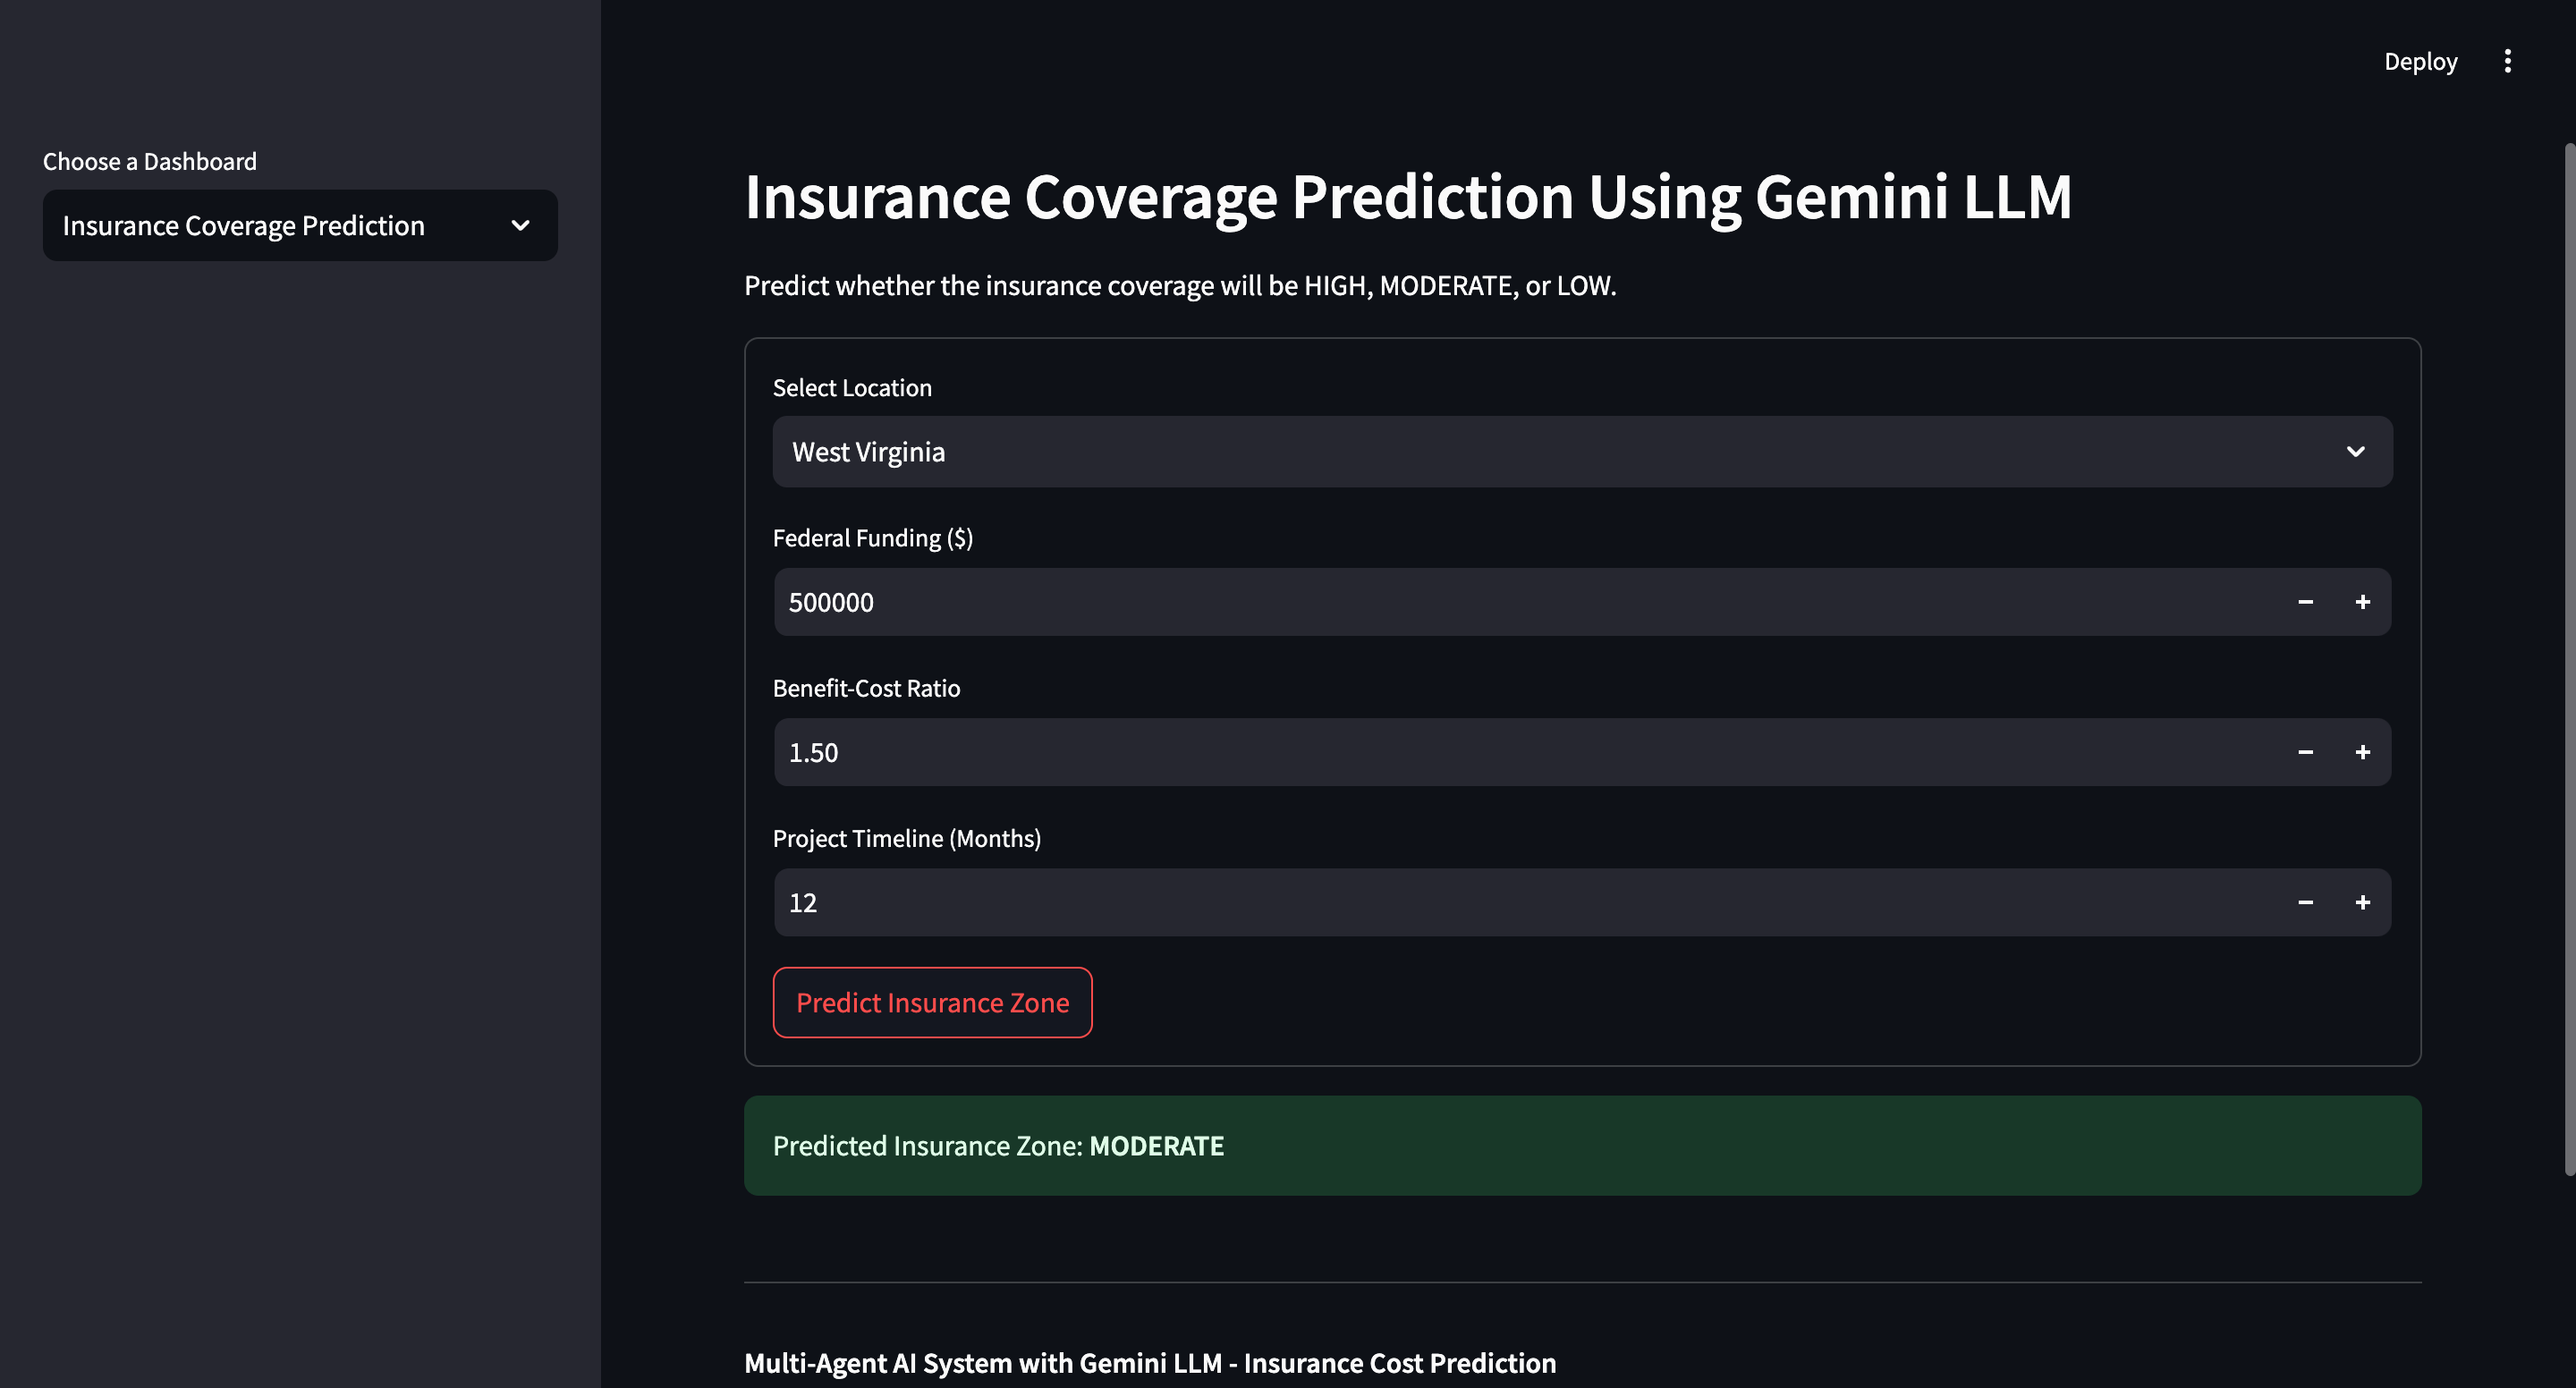
- Predict Insurance Prices: The system predicts where insurance premiums should be higher based on the disaster risk level in each state. Higher-risk zones, with more frequent and severe disasters, would logically require higher insurance coverage.
- Visualize Disaster Risk: It visualizes disaster risk by showing the geographical distribution of high-risk and low-risk zones, helping stakeholders understand which areas need more attention in terms of risk management and insurance pricing.
How we built it
We built RiskScope using a combination of data science, machine learning, and visualization tools:
- Data Collection: We used FEMA’s publicly available disaster management datasets, which provide data on disaster frequency, severity, and recovery efforts.
- Data Processing: We used Python libraries such as Pandas and NumPy to clean and preprocess the data, ensuring that it was structured and ready for analysis.
- Risk Zone Identification: We performed statistical analysis to identify regions with higher disaster frequency and severity, categorizing them into low, moderate, and high-risk zones.
- Insurance Prediction Model: We trained a machine learning model (such as a regression model) to predict insurance prices based on the disaster risk levels and other factors like population density, historical damage costs, etc.
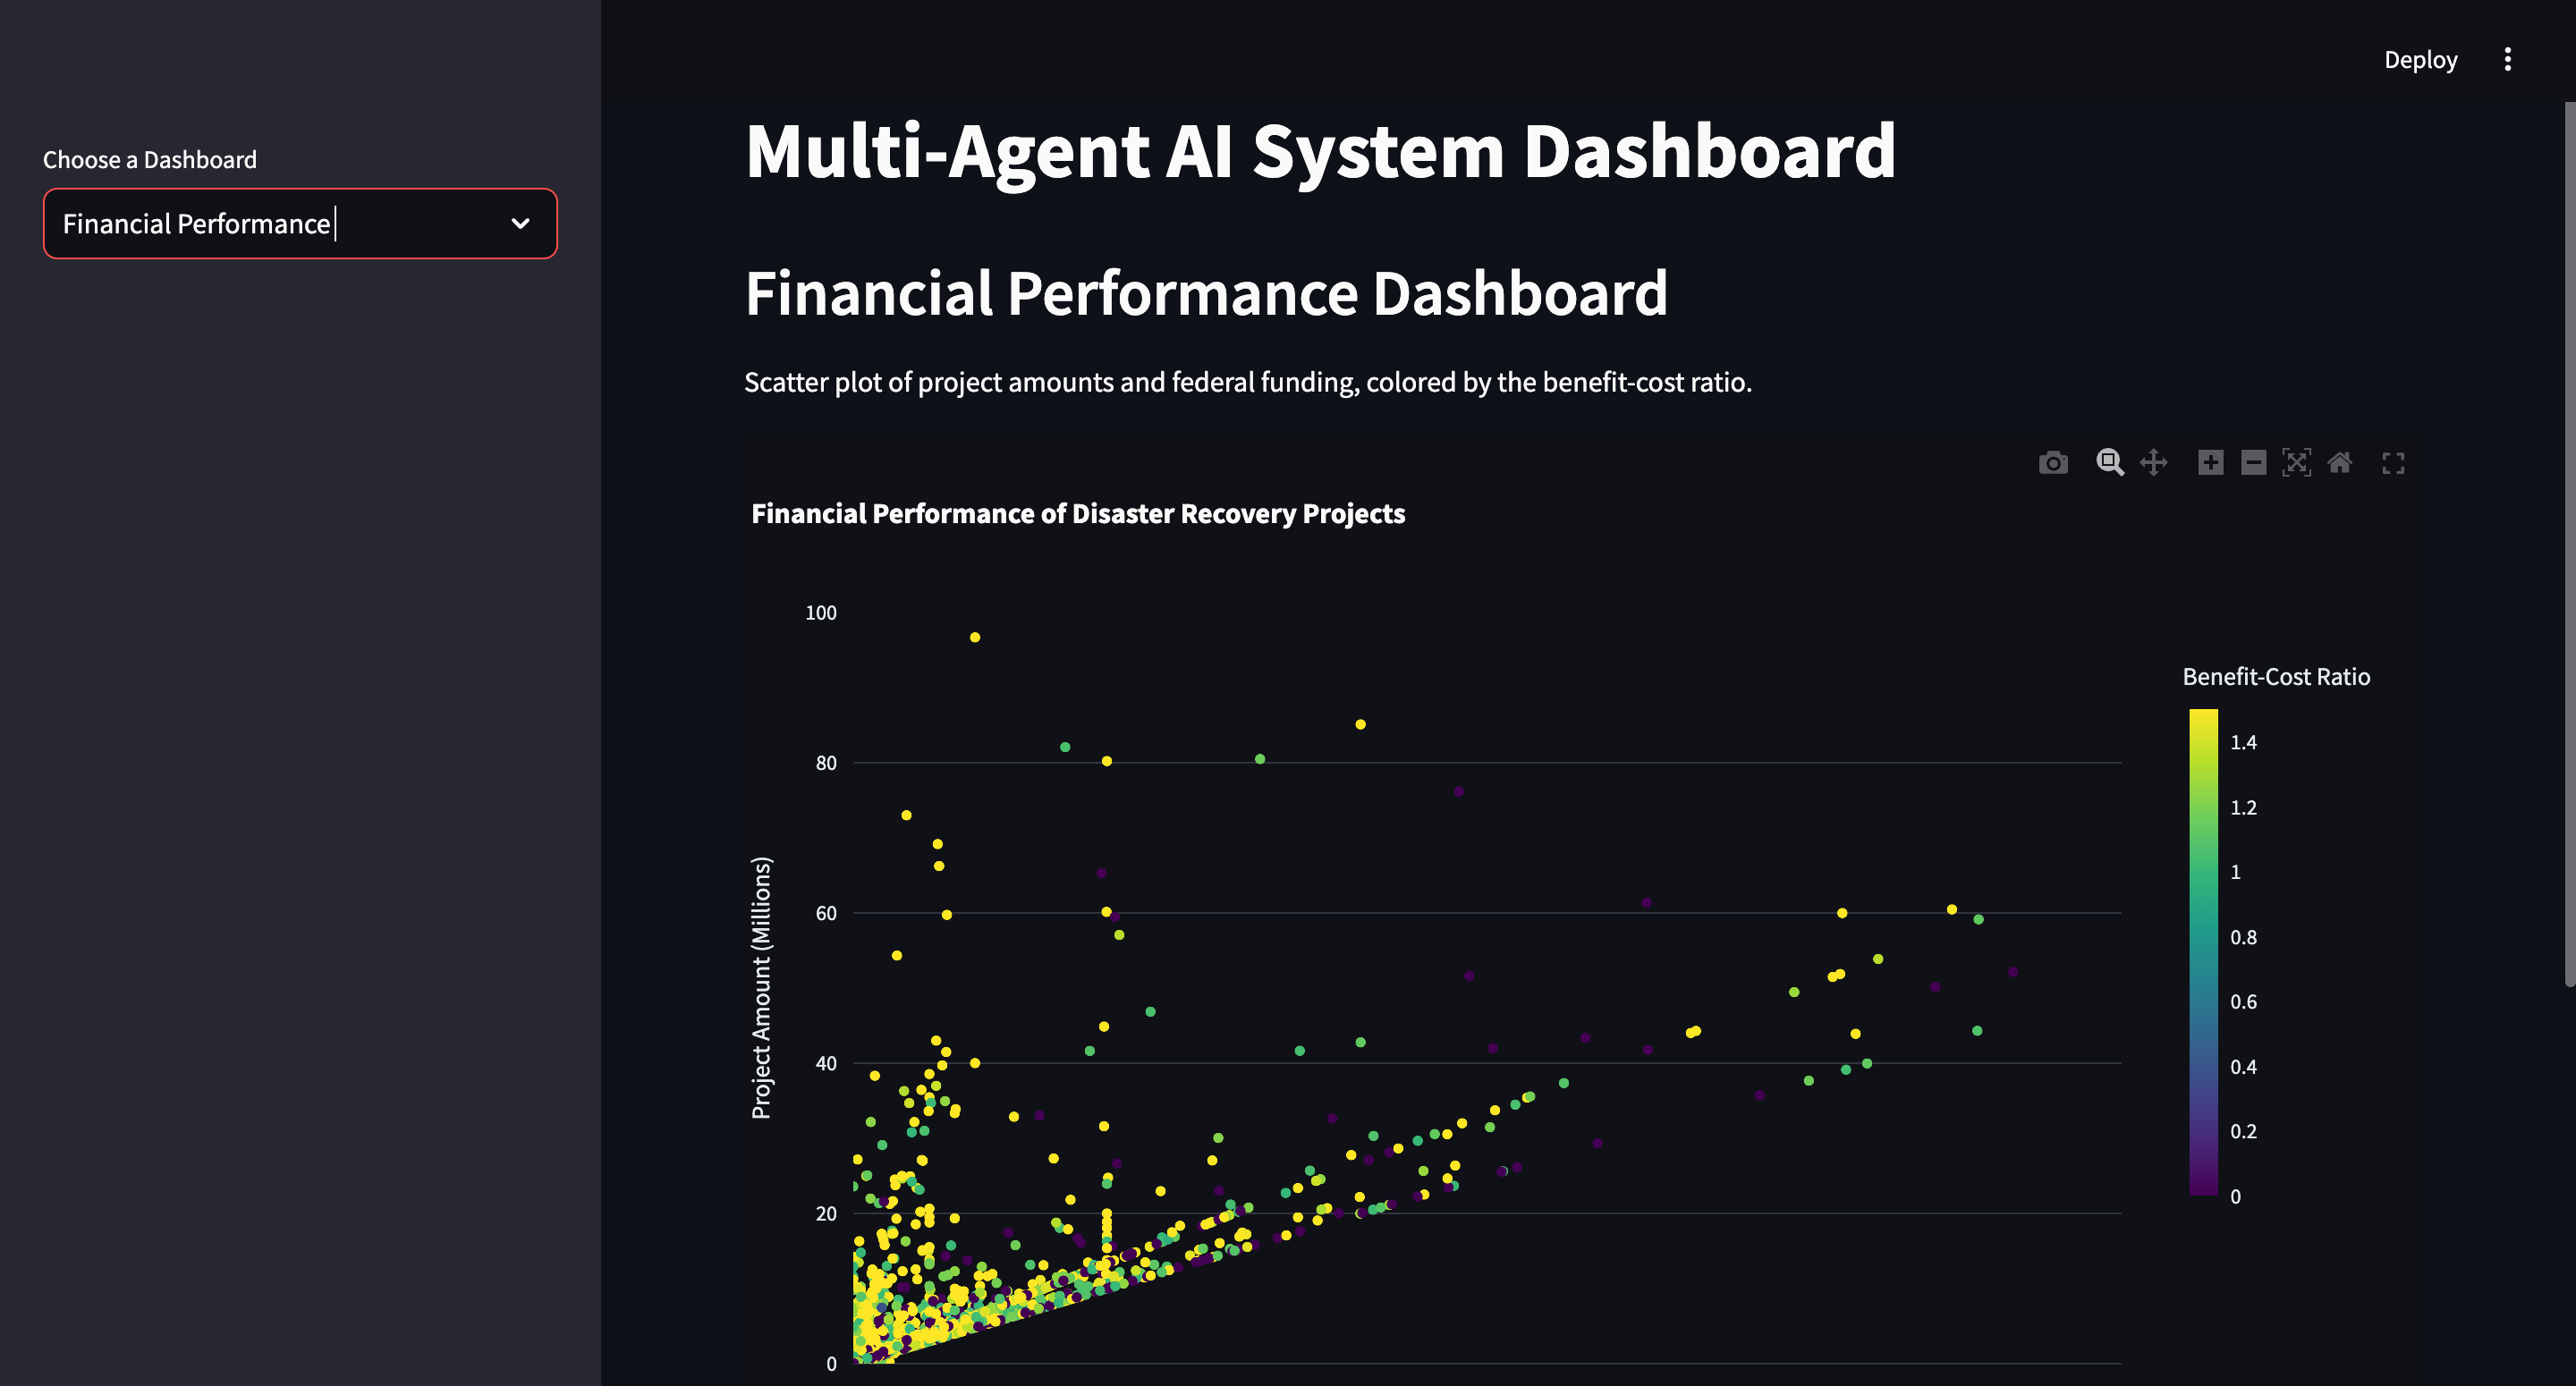
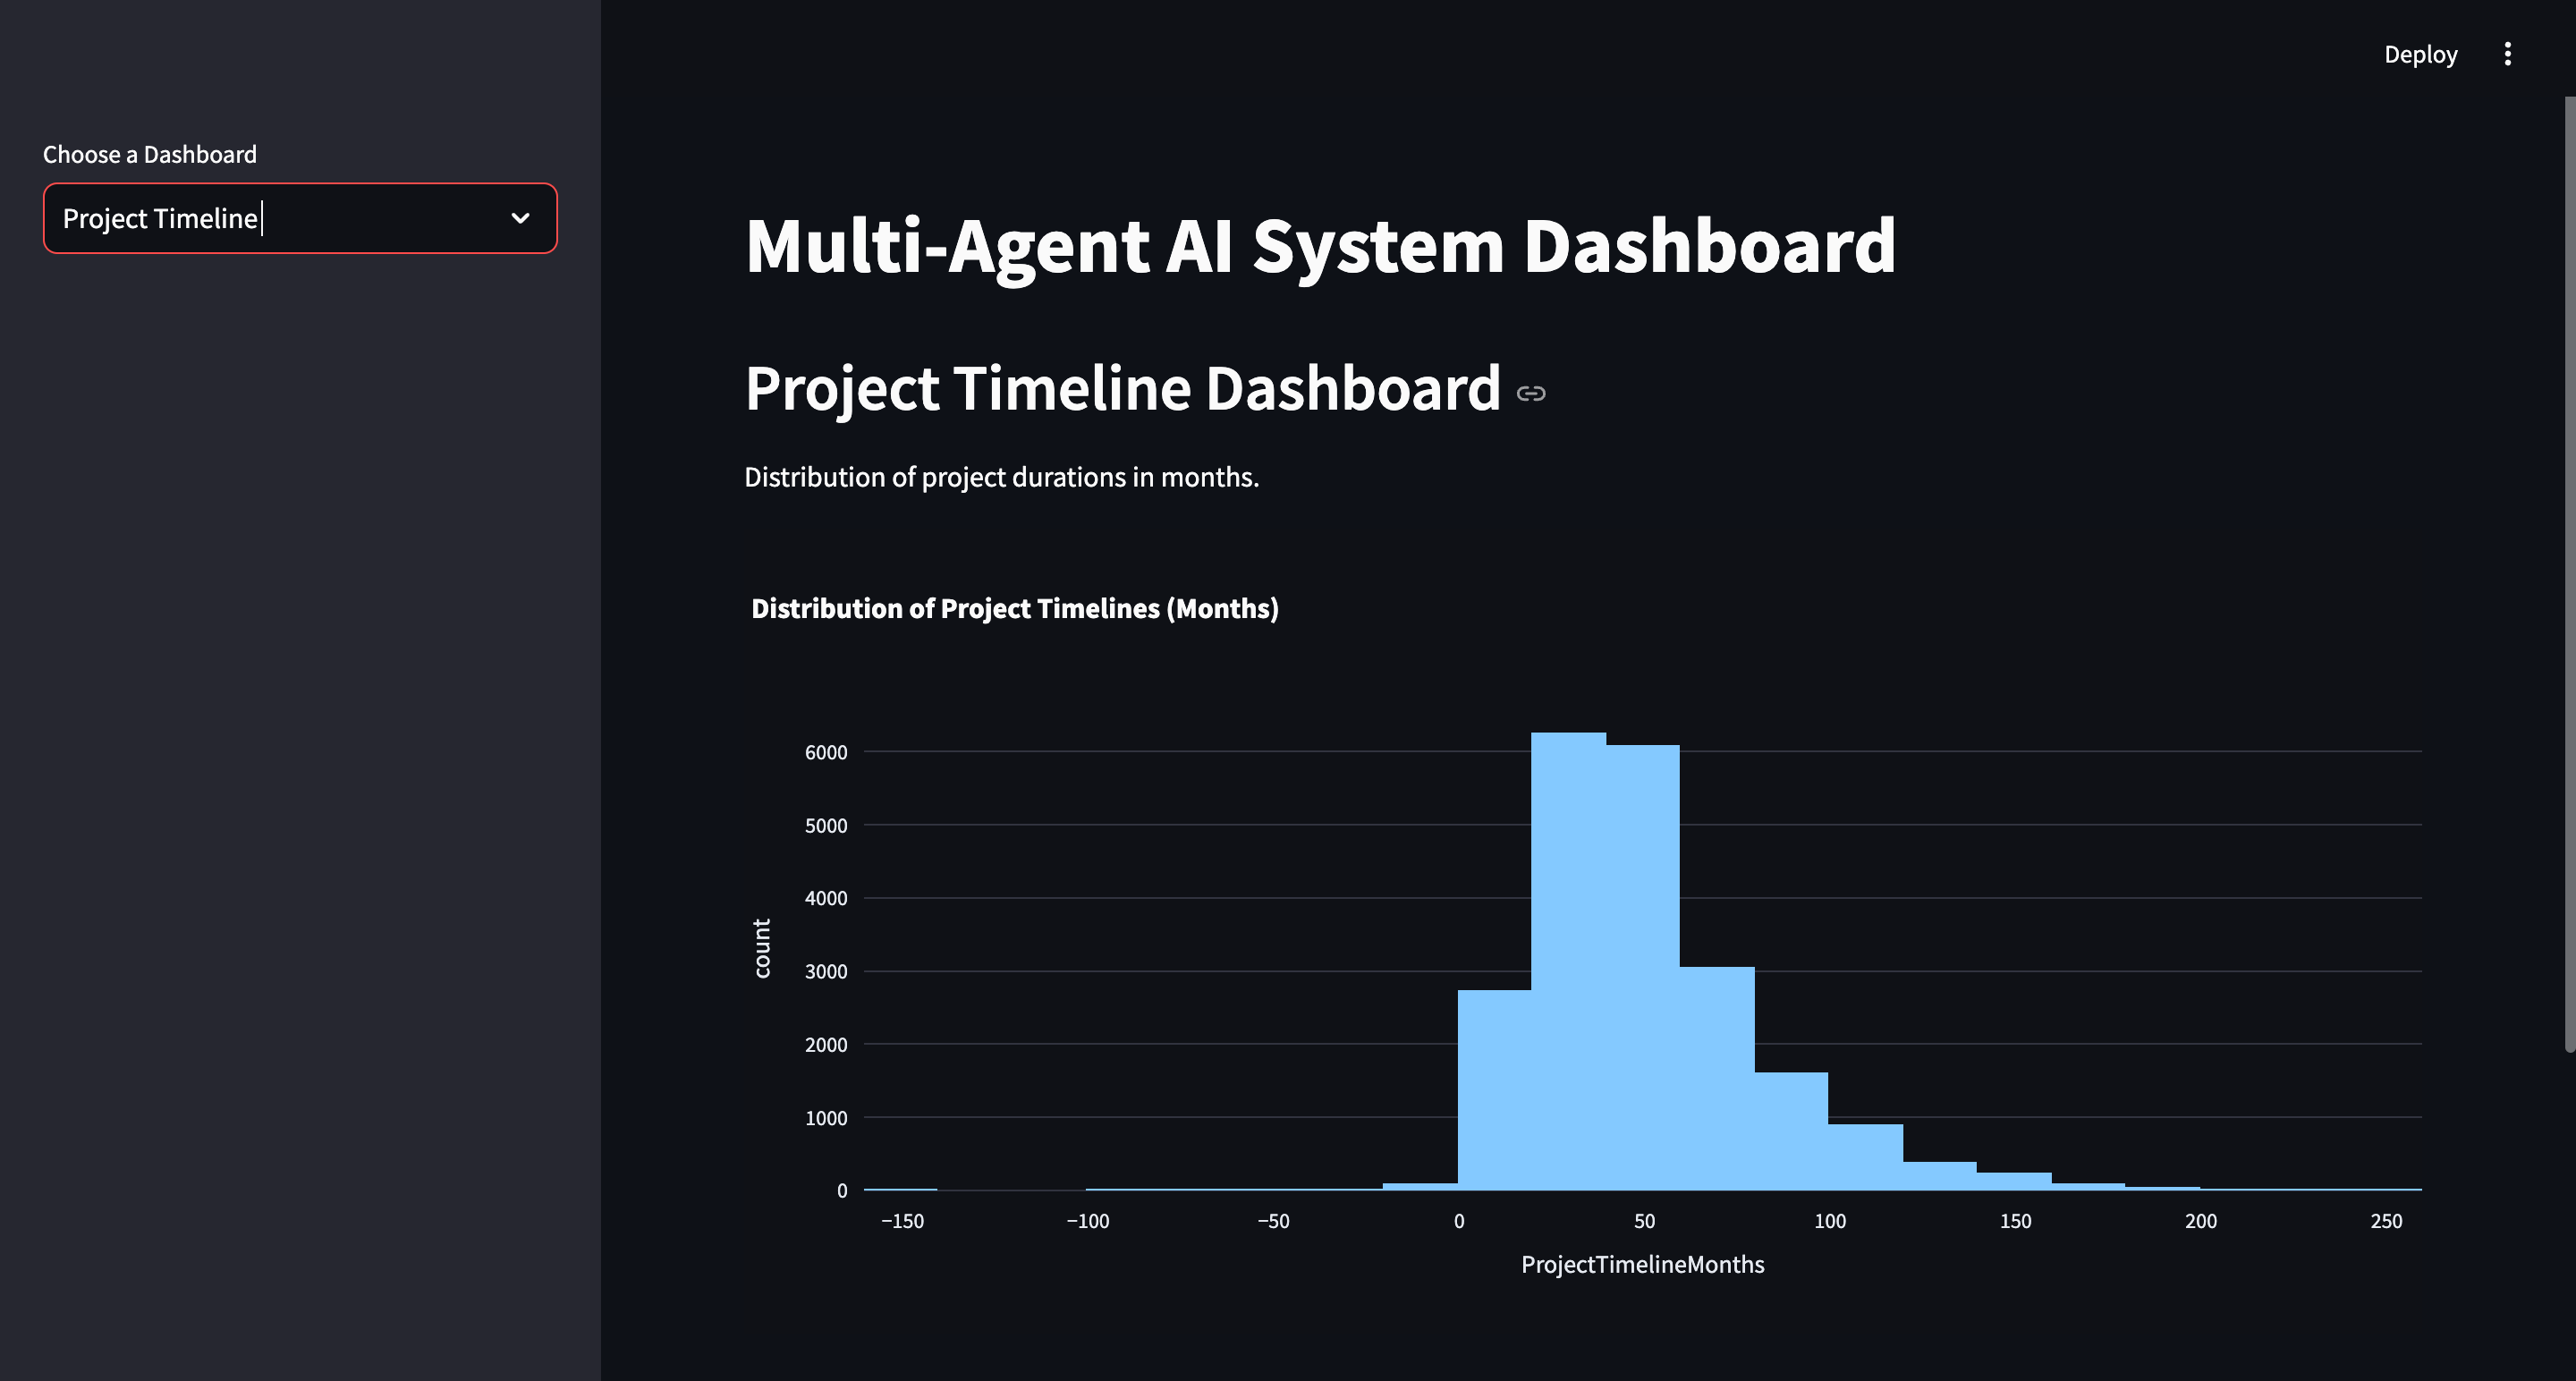
- Visualization: We used Plotly and Streamlit to create interactive visualizations, including geographical maps and risk distribution charts, to provide users with an intuitive way to explore the data and predictions.
- Mathematical Logic for Predictive Modeling: At the core of our predictive model is a mathematical scoring system that assigns weights to key features based on their influence on insurance valuation. We use the following formula to calculate the composite Risk Score, which determines the insurance zone classification:
RiskScore = w₁ × FederalFunding + w₂ × (1 / BenefitCostRatio) + w₃ × ProjectTimeline + w₄ × ZoneRiskLevelNumeric
Here, the weights (w_1, w_2, w_3,) and (w_4) are adjusted based on the relative importance of each factor. Federal Funding is positively correlated with higher risk, while a higher Benefit-Cost Ratio reduces the risk score. Longer project timelines and higher zone risk levels increase the risk score, indicating a greater need for insurance coverage. This equation enables us to objectively quantify the risk associated with each location.
Challenges we ran into
- Data Quality and Inconsistencies: The FEMA disaster data wasn’t always consistent or complete, which required significant preprocessing and filling in missing values.
- Complexity of Risk Prediction: Accurately predicting insurance prices is difficult due to the many factors involved, such as regional economics, population density, and past recovery costs. We had to balance the various data points to build a reasonable model.
- Geospatial Analysis: Mapping disaster zones and identifying patterns across a large geographical area posed some challenges in terms of computational efficiency and creating clear visualizations.
- Feature Engineering: Identifying the most important features for insurance price prediction was a challenge. We had to experiment with different variables to see which ones most influenced the predicted insurance premiums.
Accomplishments that we're proud of
- Accurate Risk Zone Identification: We successfully identified disaster-prone zones and categorized them based on their risk levels, helping users see where the most vulnerable regions are.
- Insurance Prediction Model: Our machine learning model was able to predict where insurance prices should be higher based on historical disaster data, providing a useful tool for pricing strategies.
- Interactive Visualization: The dashboard built with Streamlit and Plotly is fully interactive, allowing users to explore the data and predictions in an intuitive and engaging manner.
- Scalability: The system can be expanded to include more granular data or even additional datasets, making it scalable for future updates or different geographical regions.
What we learned
- Geospatial Data Analysis: We learned how to work with geospatial data, using mapping and spatial analysis techniques to better understand disaster-prone regions.
- Predictive Modeling: Building the insurance price prediction model taught us valuable lessons in feature engineering, model selection, and performance evaluation.
- Data Cleaning and Preprocessing: Handling real-world disaster data with inconsistencies and missing values helped us develop our skills in data preprocessing and data imputation techniques.
- Interactive Dashboards: Using tools like Streamlit and Plotly allowed us to experiment with creating dynamic, user-friendly interfaces that present complex data in an easily understandable way.
What's next for RiskScope
- Enhance Predictive Model: We plan to refine the insurance price prediction model by incorporating additional features like property values, historical damage data, and economic indicators to improve its accuracy.
- Real-Time Data Integration: We aim to integrate real-time disaster data, allowing the system to update predictions dynamically as new data comes in.
- Expanded Geographic Scope: Currently, the system is focused on U.S.-based data. We plan to extend it to include international disaster data and risk predictions.
- User Feedback and Iteration: We will gather user feedback to refine the system’s functionality and interface, improving the user experience and the system’s usefulness for stakeholders in the disaster recovery industry.


Log in or sign up for Devpost to join the conversation.