-
-

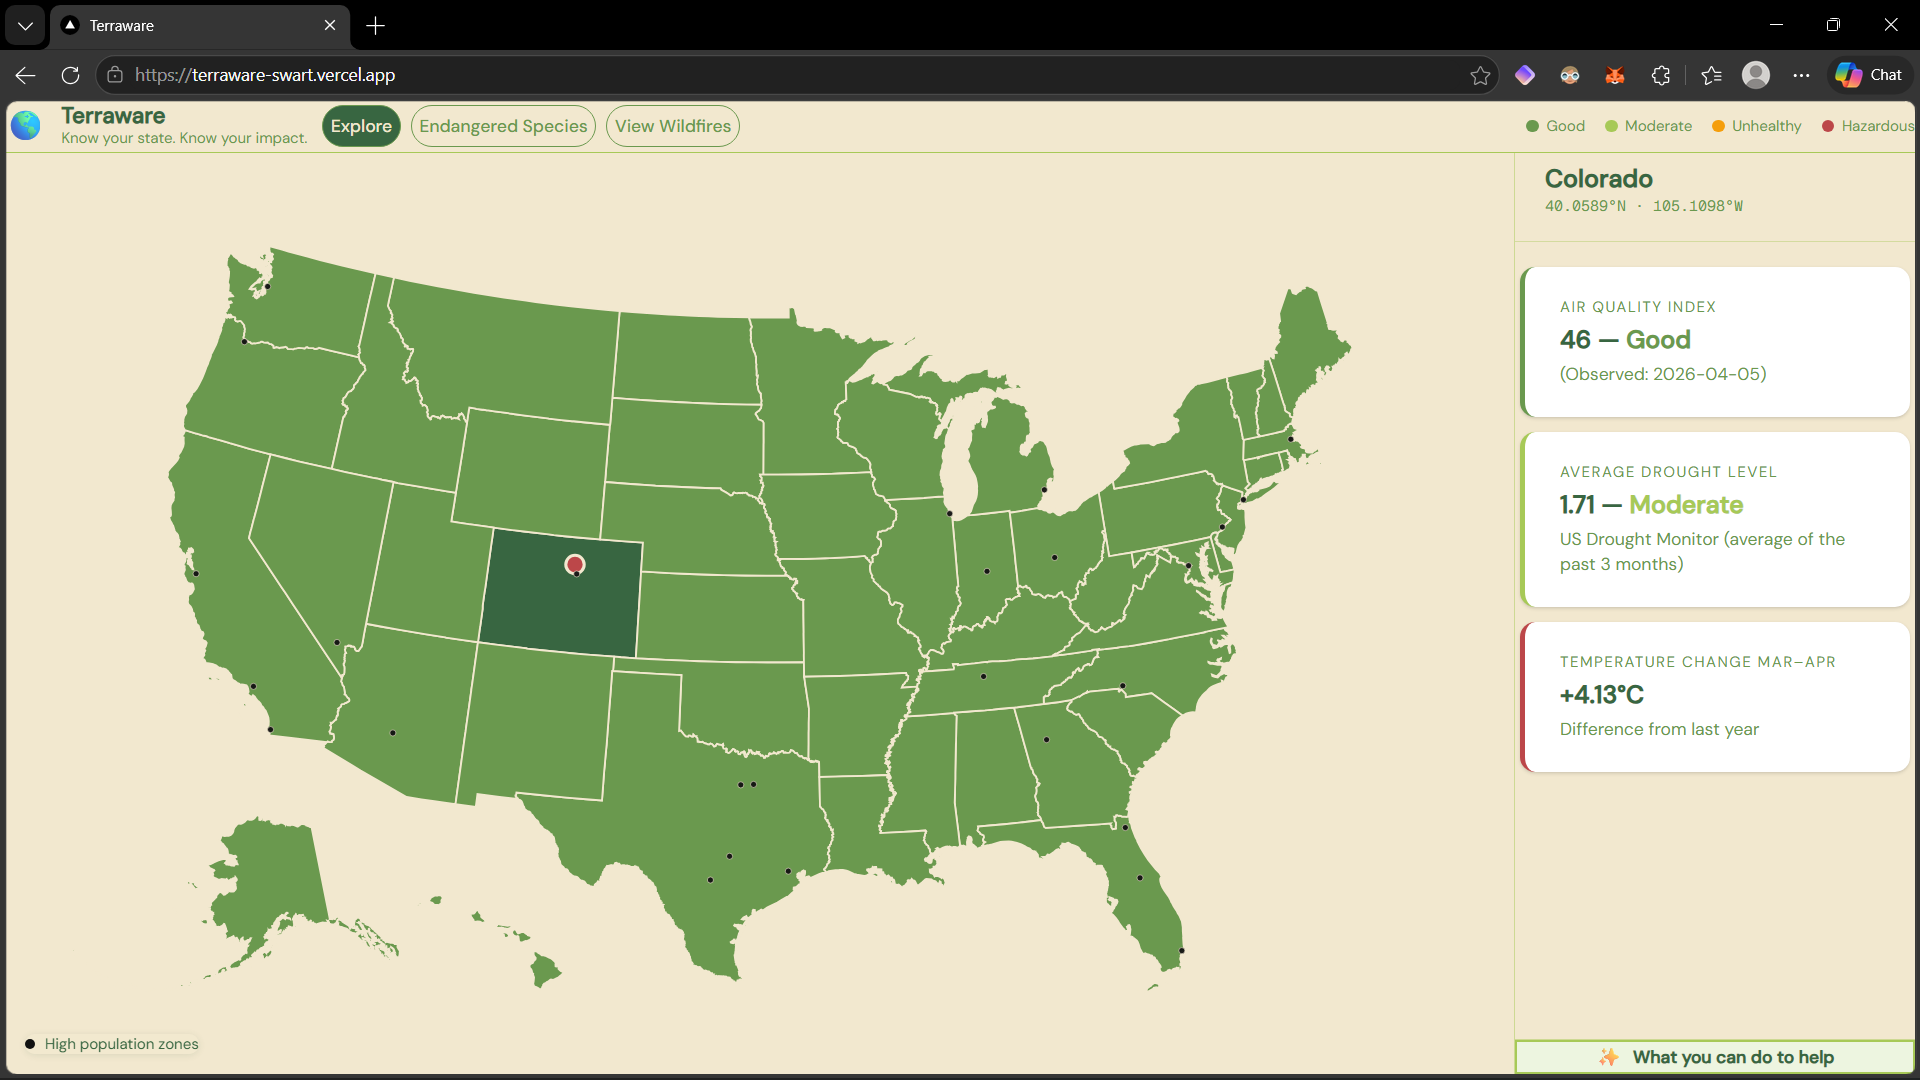
User can view climate data for the state and coordinates.
-
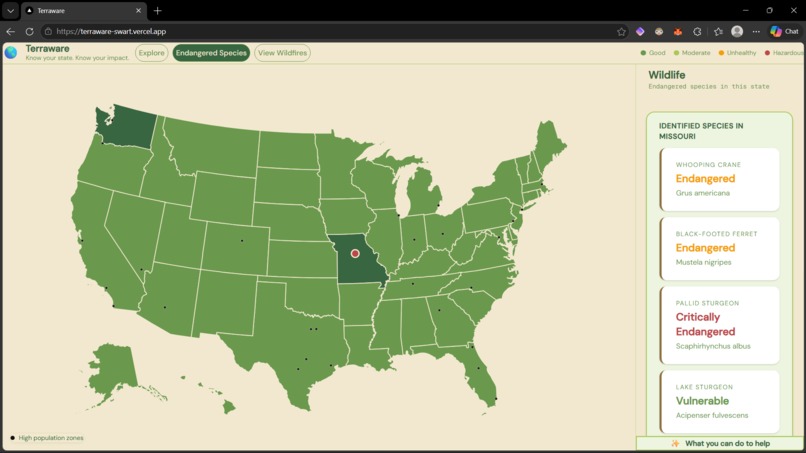
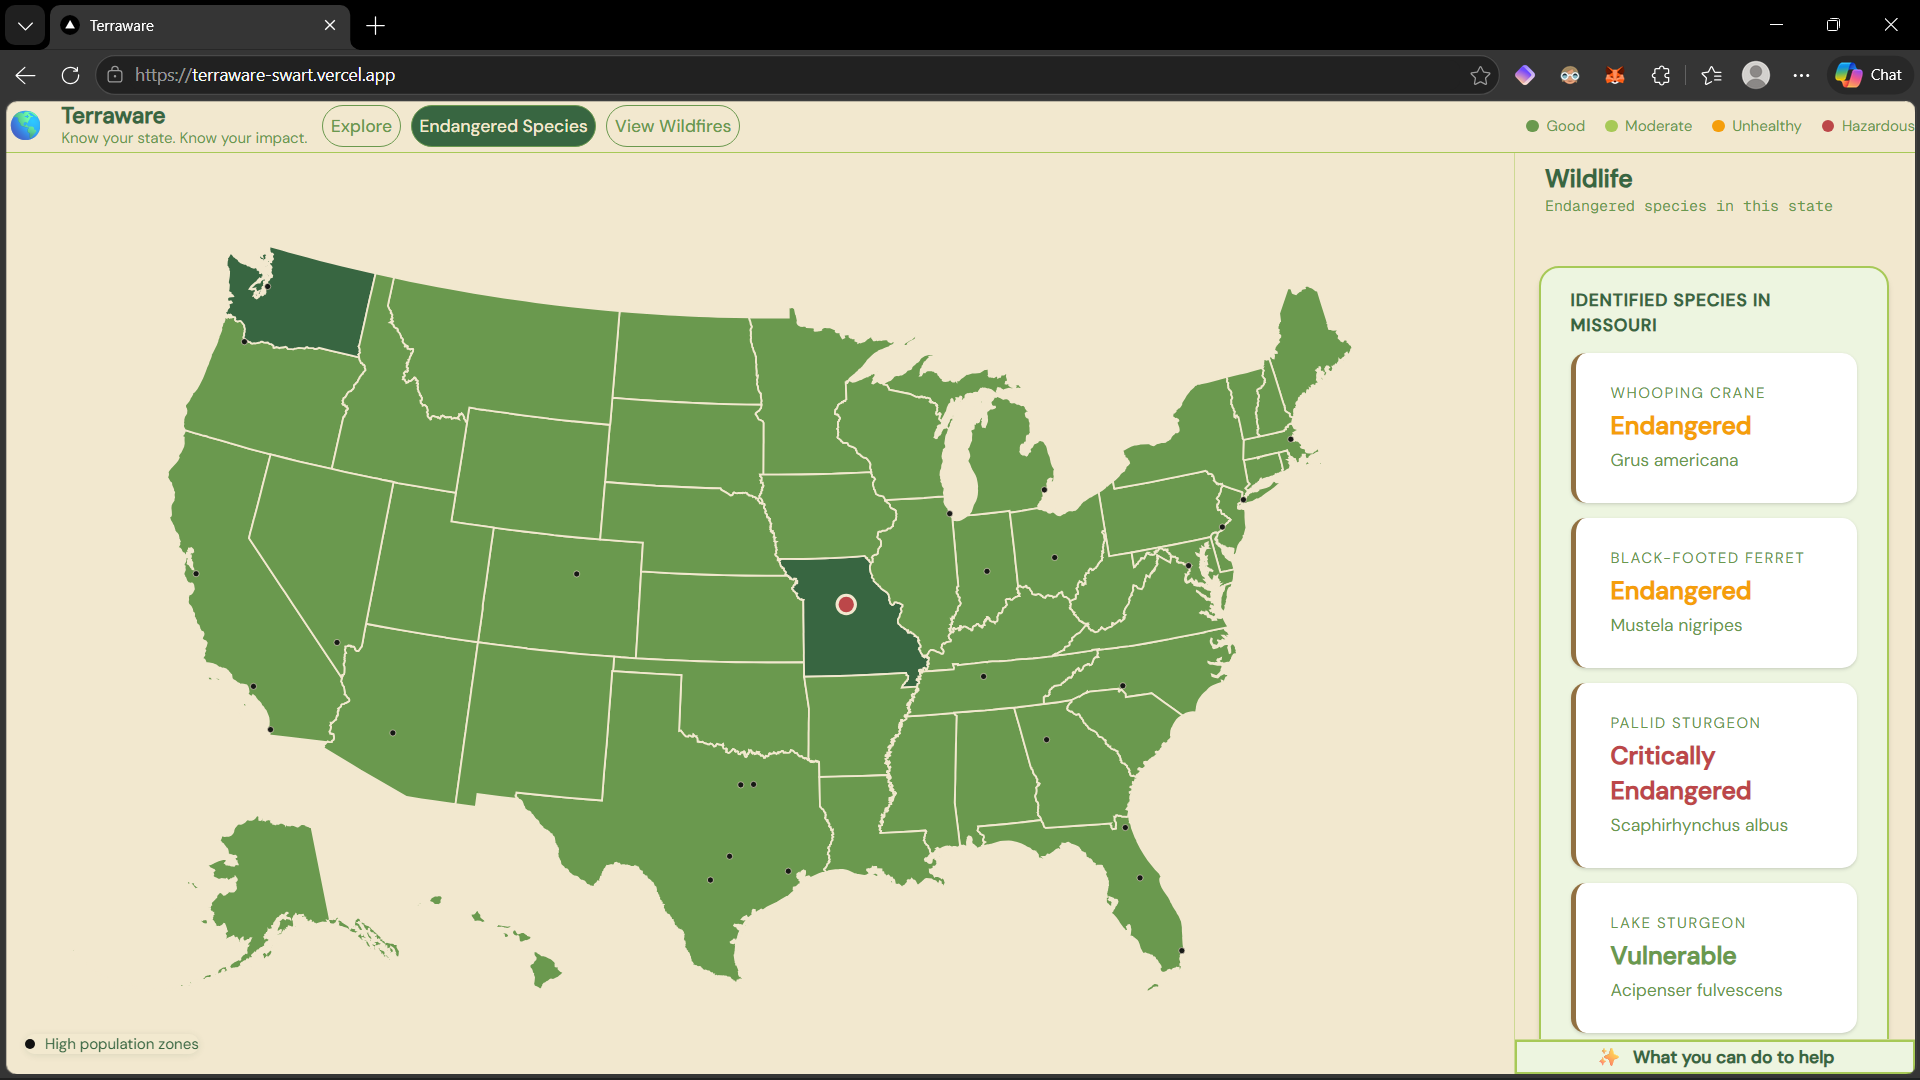
User can view data about the endangered species in a state.
-

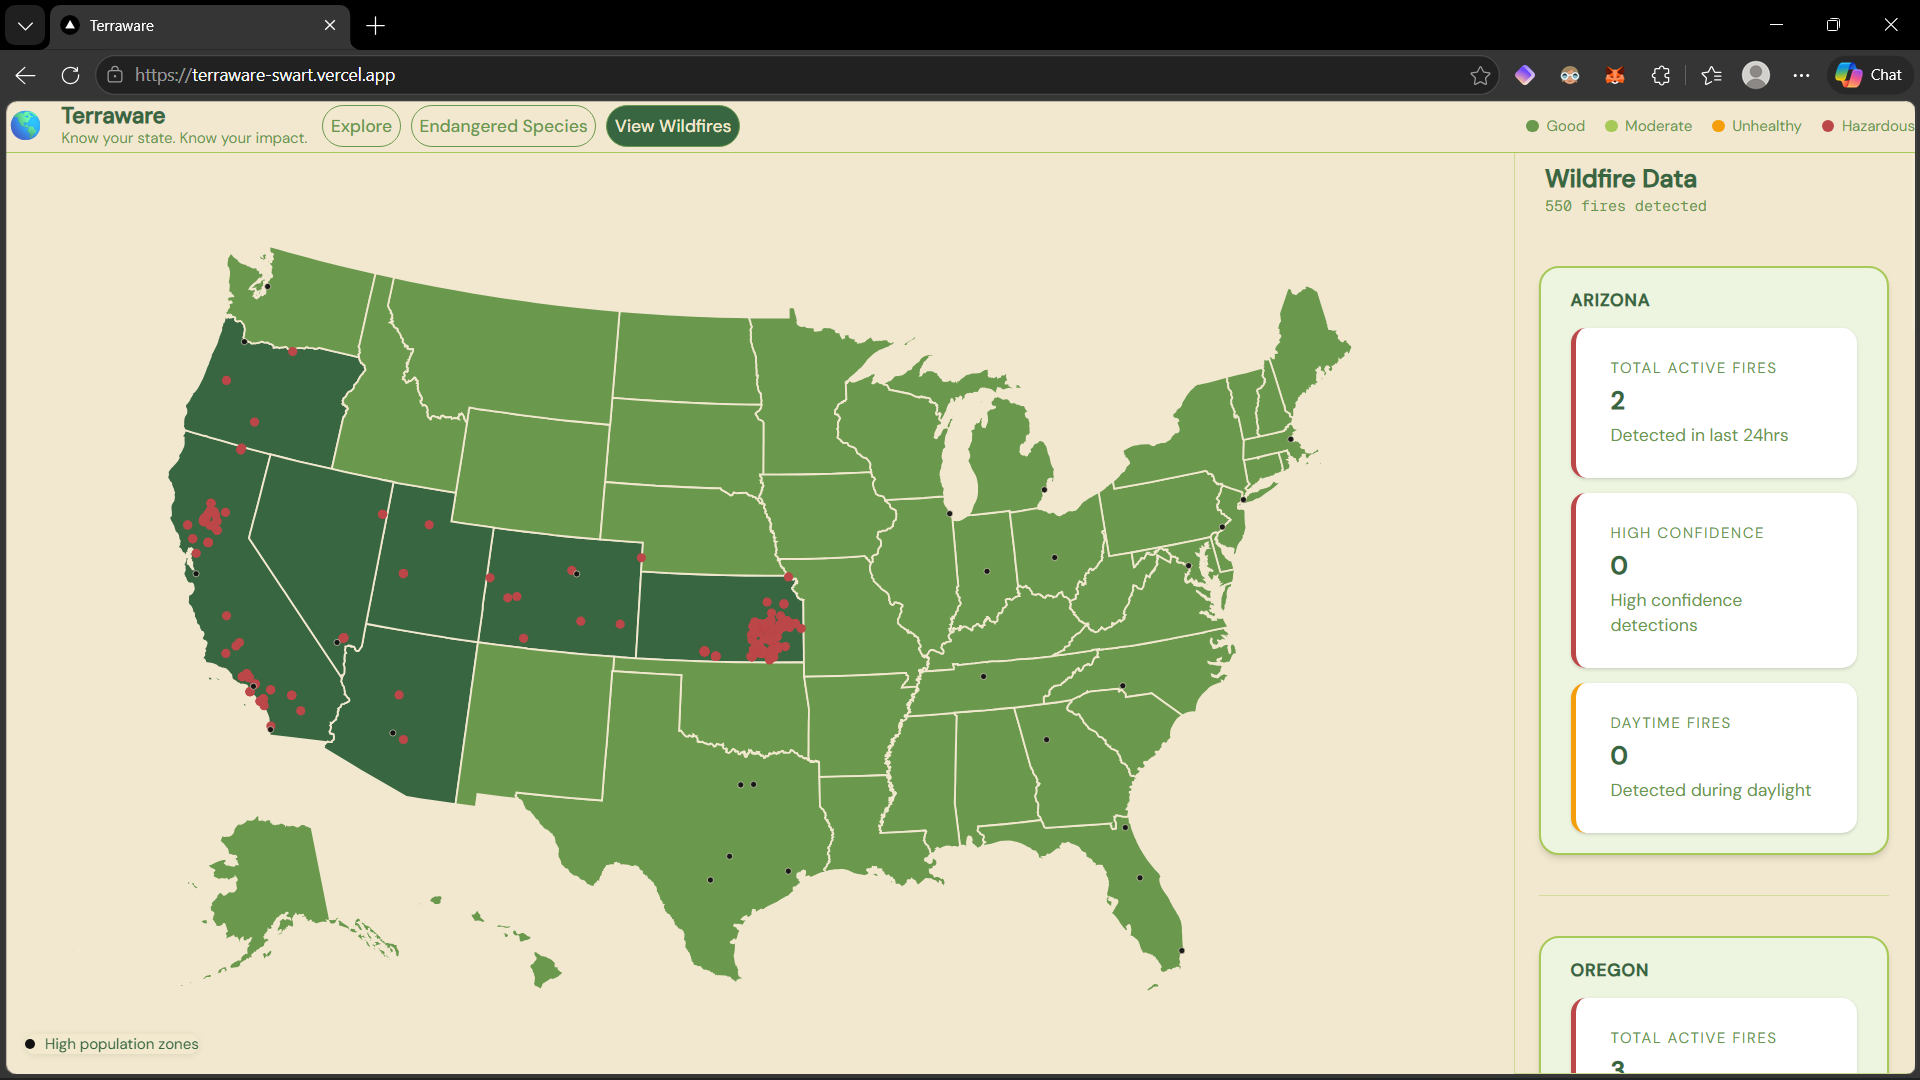
User may view wildfire data visualizations in many states.
-
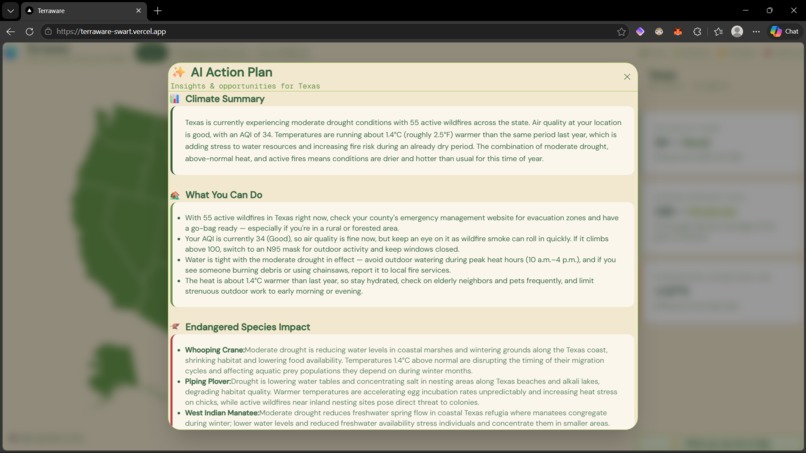
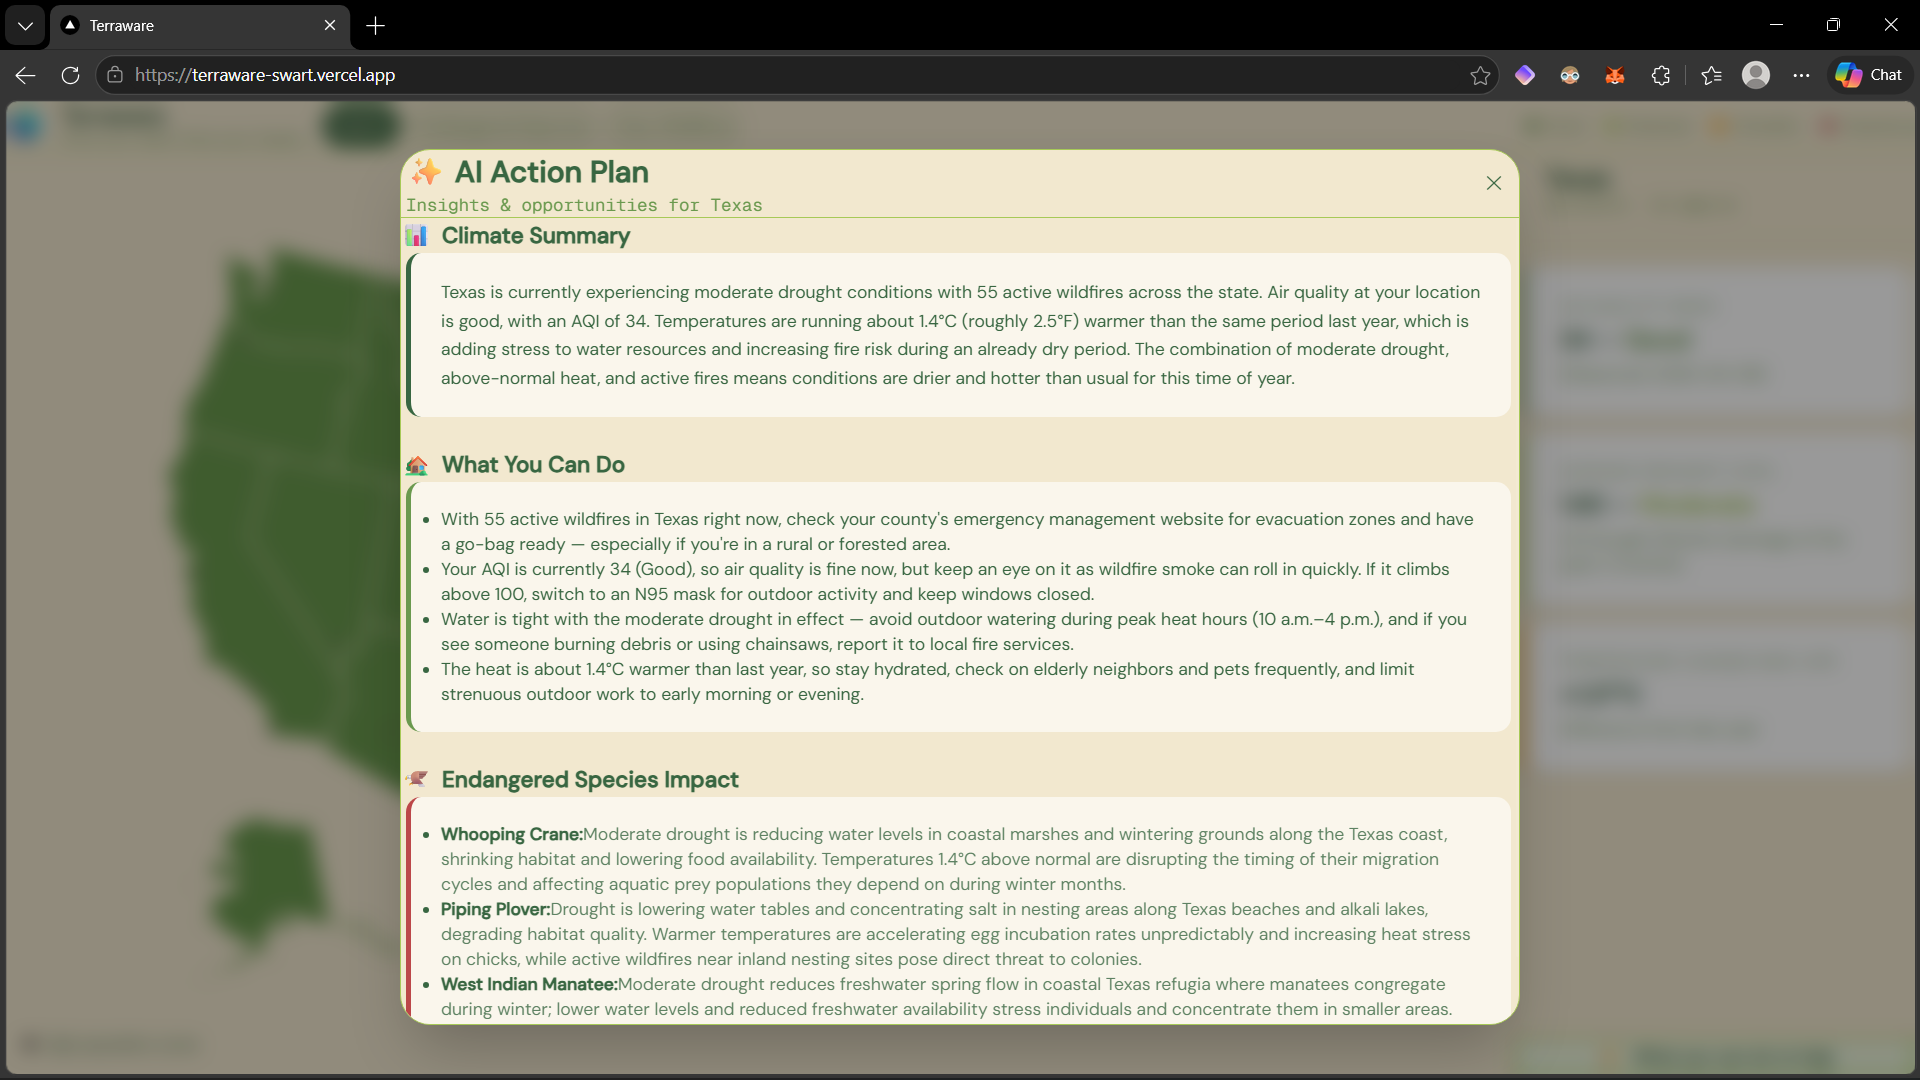
User may view an AI generated climate summary, action plan, and view the climate's effect on the at risk biodiversity.
Inspiration
I grew up in Colorado. Some days I wake up and the mountains are gone, hidden behind wildfire smoke. The animals I saw outside as a kid are losing their homes. These things are happening constantly but aren't always visible. Even when environmental data is available, it lives in separate government databases written for scientists, not people. Without a single place to see how air quality, wildfires, drought, and biodiversity connect, most people don't know what's happening, let alone what to do about it. We wanted to change that. Terraware was built for the average person who wants to understand what climate change is doing to their backyard, not a scientist, not an activist, just someone who cares.
What it does
Terraware is a climate awareness tool that connects real-time environmental data to biodiversity impact and local action. Click any US state to instantly see active wildfires, air quality index, drought severity, temperature change compared to last year, and endangered species impact. Claude AI synthesizes all of this into plain language and generates specific, actionable recommendations for that location.
How we built it
Next.js and React frontend deployed on Vercel. Data pulled from AirNow (AQI), NASA FIRMS (wildfires), US Drought Monitor, Open-Meteo (temperature delta March 2025 vs March 2026), and seeded IUCN (International Union for Conservation of Nature) endangered species data cross referenced with each state with GIBF (Global Biodiversity Information Facility). Claude API takes in all of this data and correlates it, generating AI summaries, action plans, and descriptions of the climate's effect on the endangered species.
Challenges we ran into
Pulling from five different APIs with different data formats and reliability levels was the core technical challenge. IUCN live API access was too slow for real-time use, so we seeded the species data. We also had to carefully tune Claude's prompt to return consistent JSON every time for the UI to render correctly.
Accomplishments that we're proud of
We built a fully functional, deployed web app in 48 hours that combines five real-time data sources with generative AI.
What we learned
Working with multiple external APIs simultaneously taught us a lot about data normalization and failure handling. Ensuring the proper order of dataflow and making sure that it gets where it needs to be is a big challenge, but a critical skill to have. We also learned that the hardest part of climate tech isn't the data, it's making it human, the core of Terraware.
Our Team and Gaps
Gavin built the full technical stack: React, Next.js, API integrations, and AI prompt engineering. Gracie brought pre-veterinary biology expertise that shaped how we represent biodiversity and endangered species impact, alongside guiding product vision, feature design, and visual direction. Our gap is business development, we're technical and scientific, not commercial. That's where nonprofit partnerships come in.
Sustainability
The cost analysis surprised us; Running Terraware at scale is genuinely affordable, making it viable for nonprofit or grant-funded deployment. To contextualize it, 1000 AI action plans costs about four dollars. Some additional costs may include upgrading API tiers and Vercel hosting. Scaling Terraware beyond a hackathon project would require a small core team, a developer to maintain the data pipelines and API integrations, a community outreach role to drive adoption, and partnerships with environmental nonprofits already embedded in the communities we want to serve. We were also mindful of AI's own environmental footprint, Claude's efficiency means we're not burning excessive compute to deliver these insights. We can also implement caching functionality to avoid repeat AI requests.
How Terraware fits in:
Tools like AirNow and Climate Central exist, but they are siloed and built for technically literate users. AirNow shows air quality, nothing else. Climate Central is data-rich but not cohesive or action-oriented. Terraware is the only tool that combines air quality, wildfires, drought, temperature change, and biodiversity impact in one place, then tells you what to do about it in plain language.
What's next for Terraware
Wildfire and forestry data layers on the map, we want to show how the forestry industry might be related to wildfire rates. Migratory pattern tracking to show how fire affects biodiversity movement. Push alerts when local conditions change. Western scientific data only tells part of the story. A future goal is partnering with indigenous land stewards so we may incorporate sustainable two-eyed seeing approaches into our action plans. On the business side, Terraware's low operating cost makes it a strong candidate for environmental grant funding or nonprofit partnership.
Built With
- airnow-api
- claude-api
- gbif
- iucn
- nasa-firms-api
- next.js
- open-meteo-api
- react
- tailwind
- us-drought-monitor
- vercel


Log in or sign up for Devpost to join the conversation.