-
-
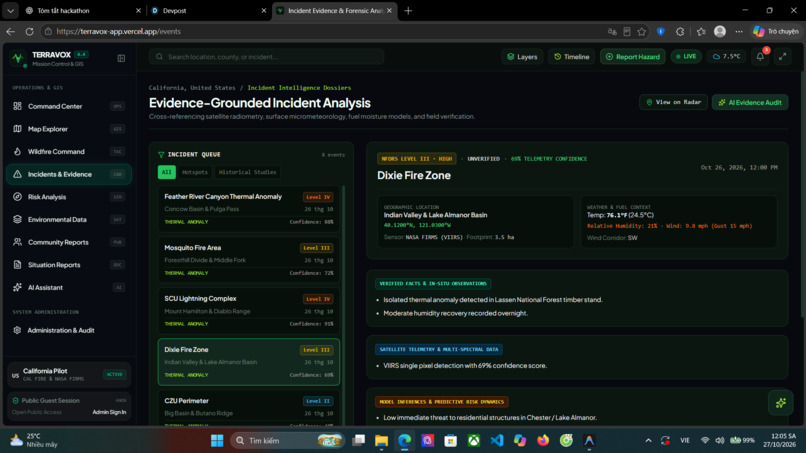
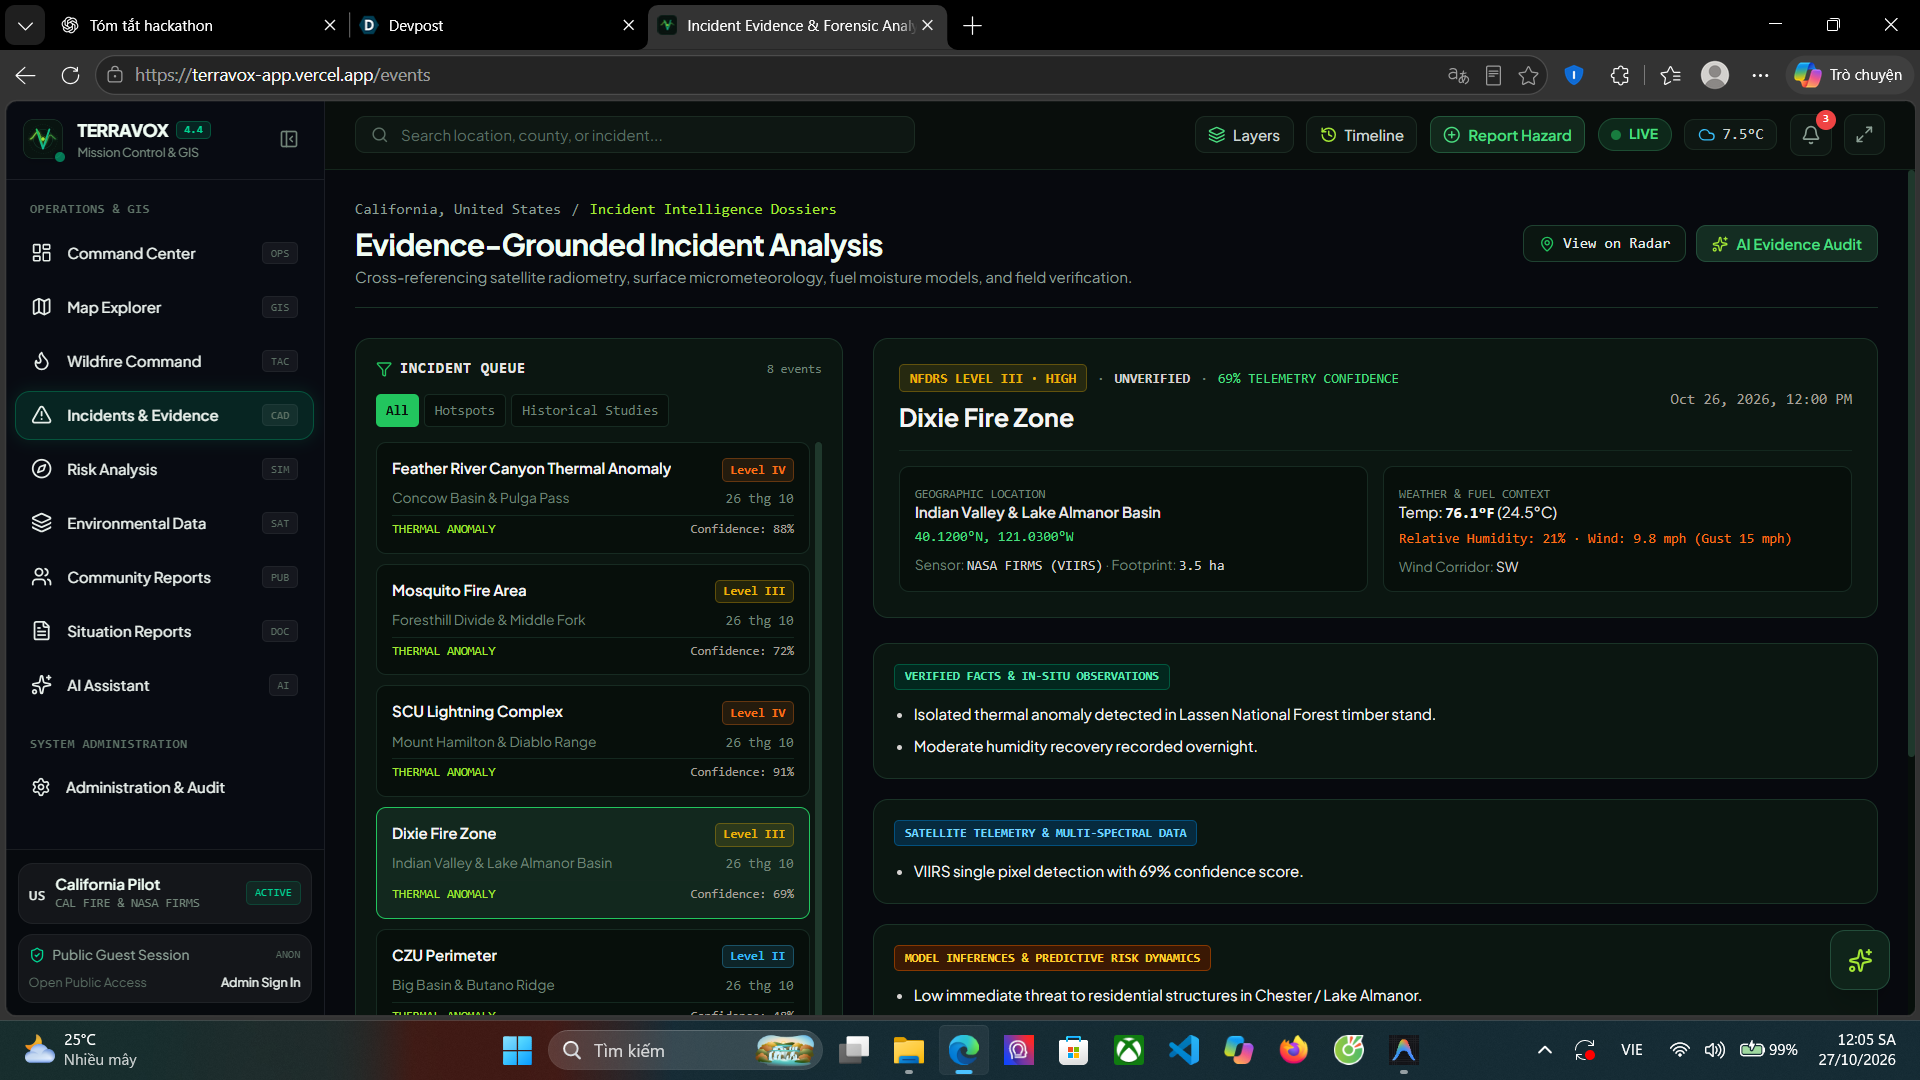
Incidents & Evidence
-
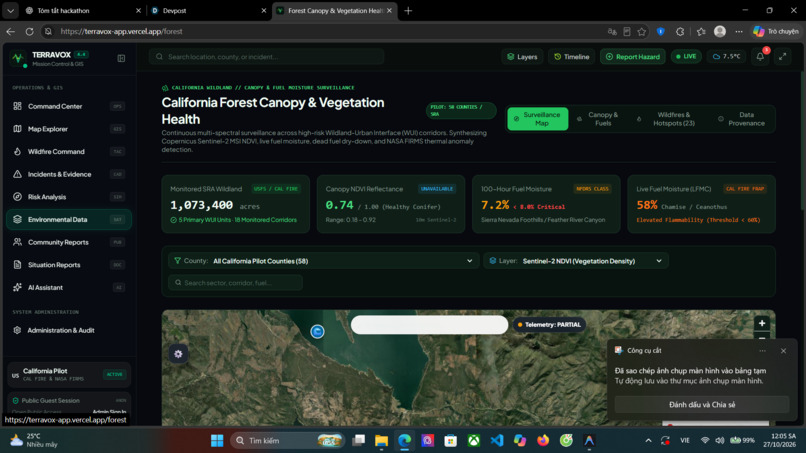
Environment Data
-
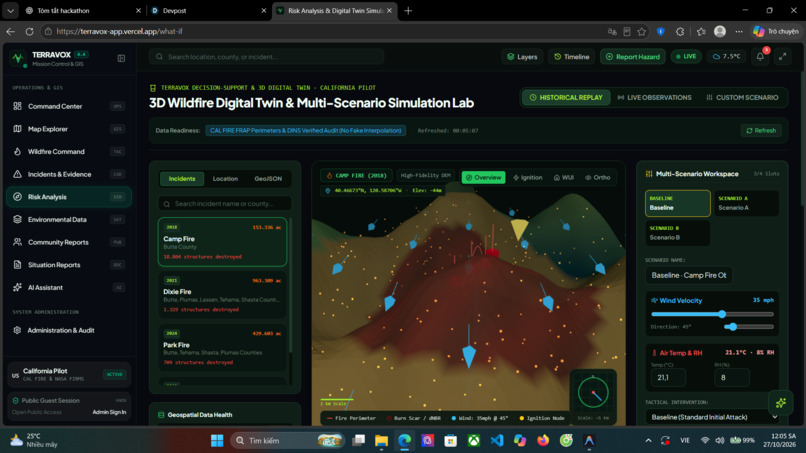
Risk Analysis
-
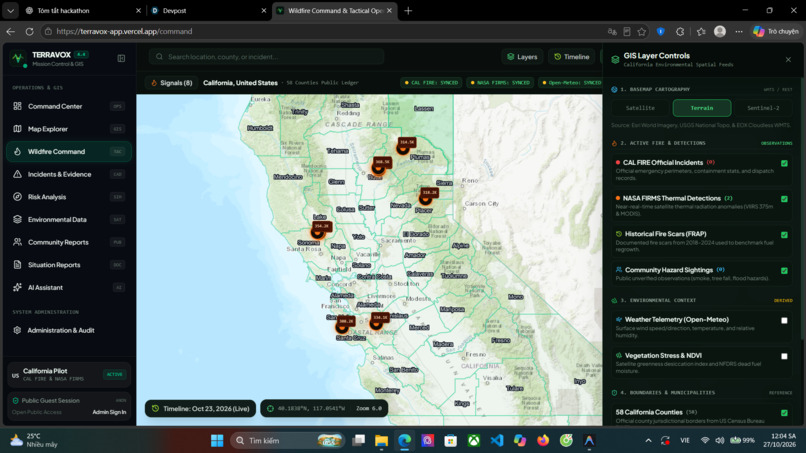
Wildfire Command
-
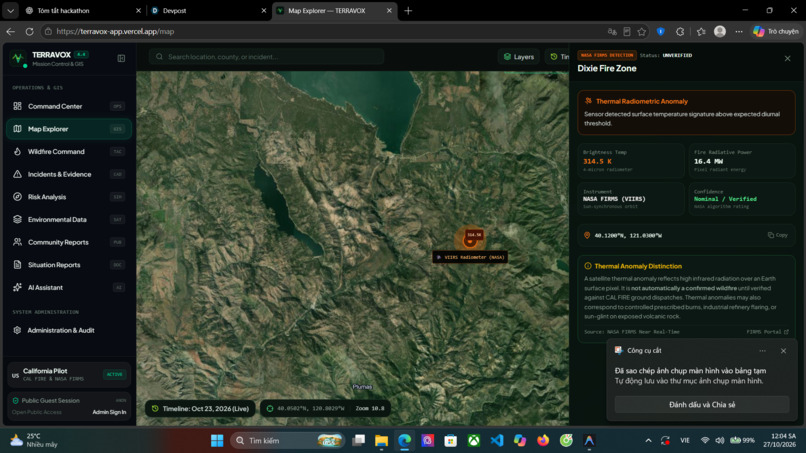
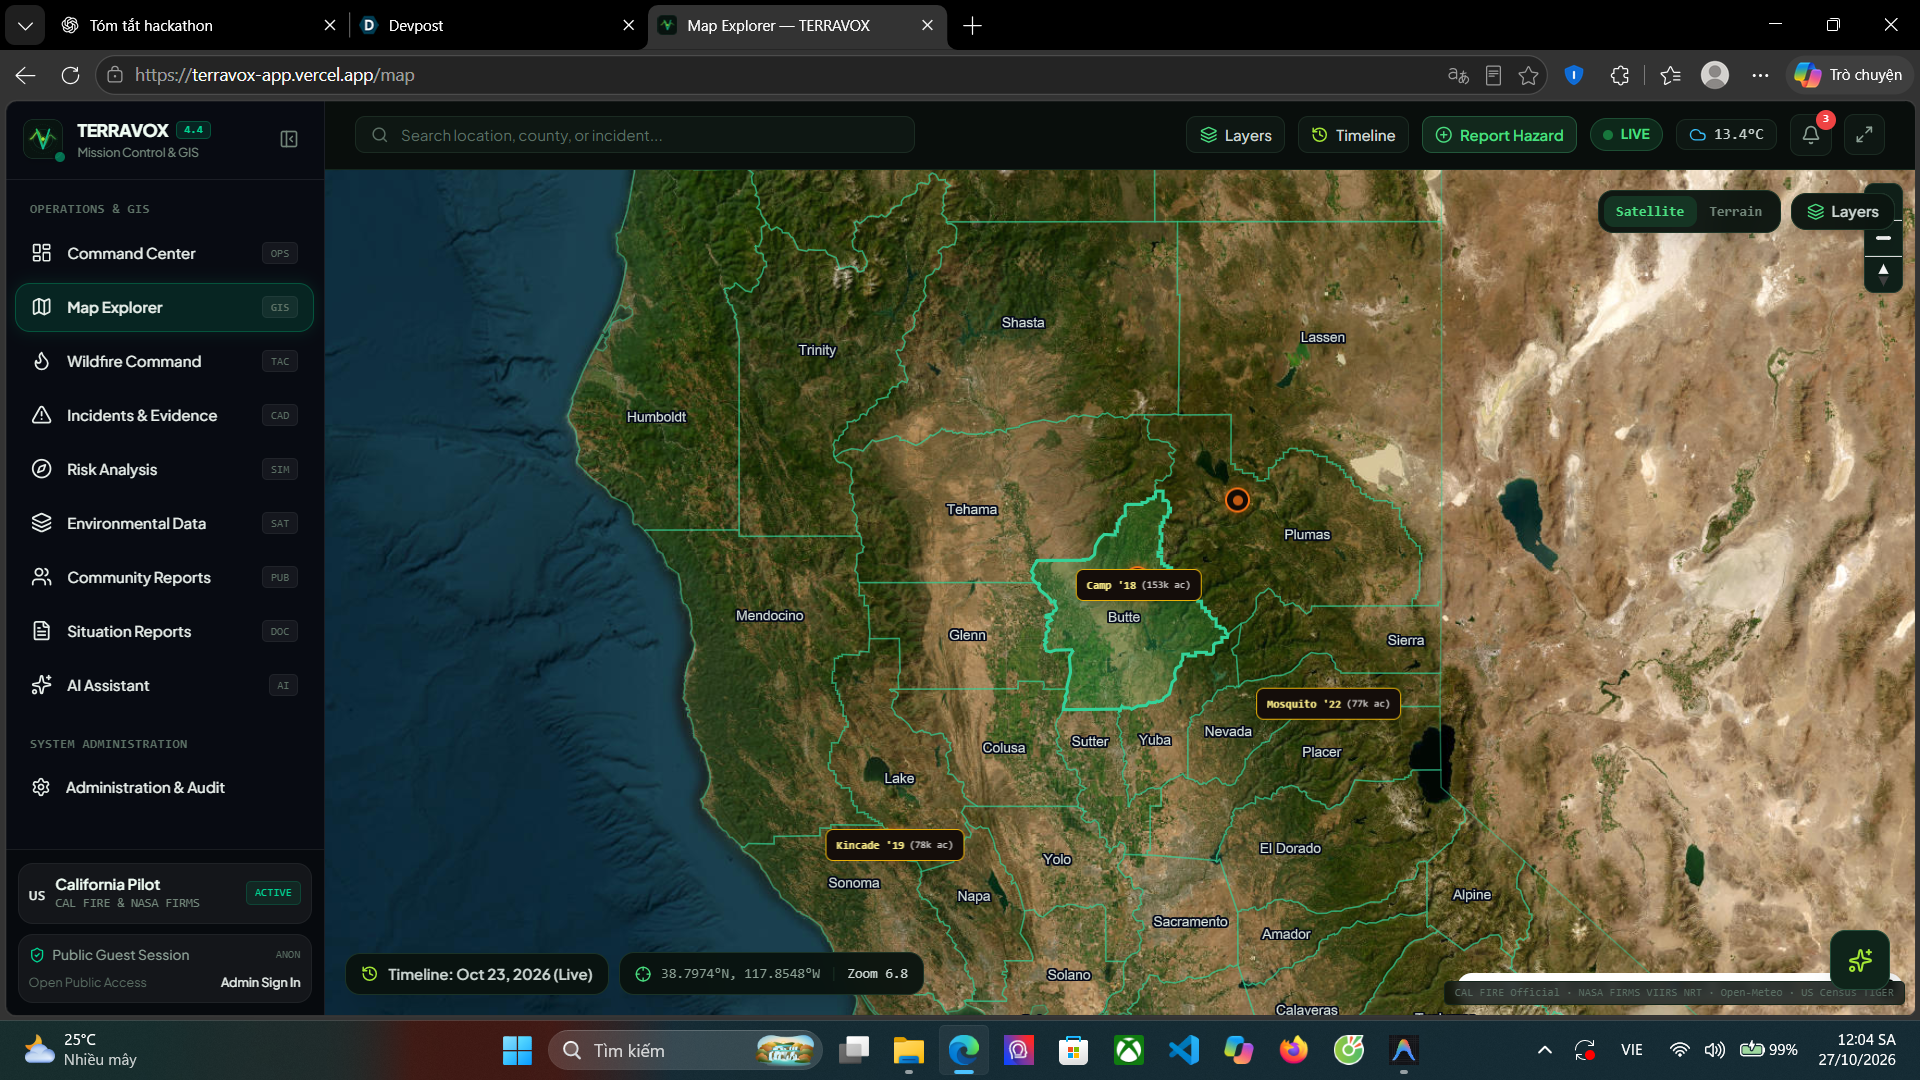
Map Explorer
-
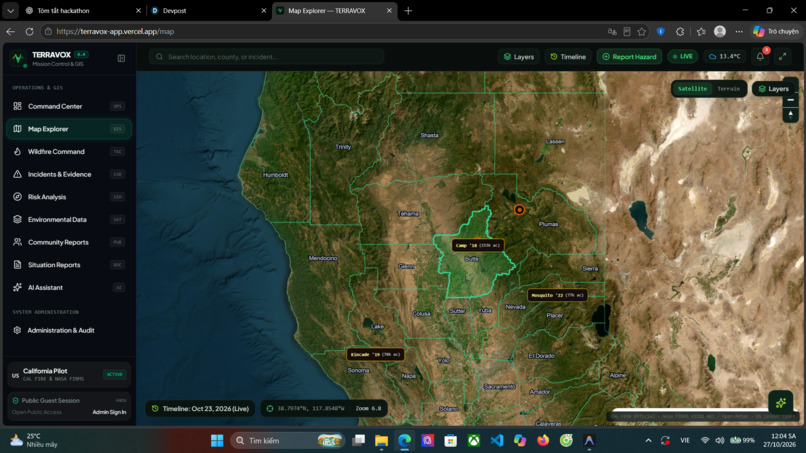
Map explorer
-
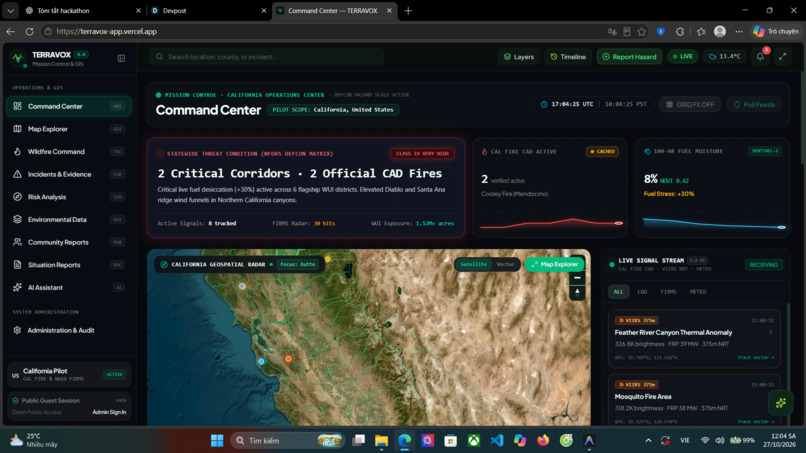
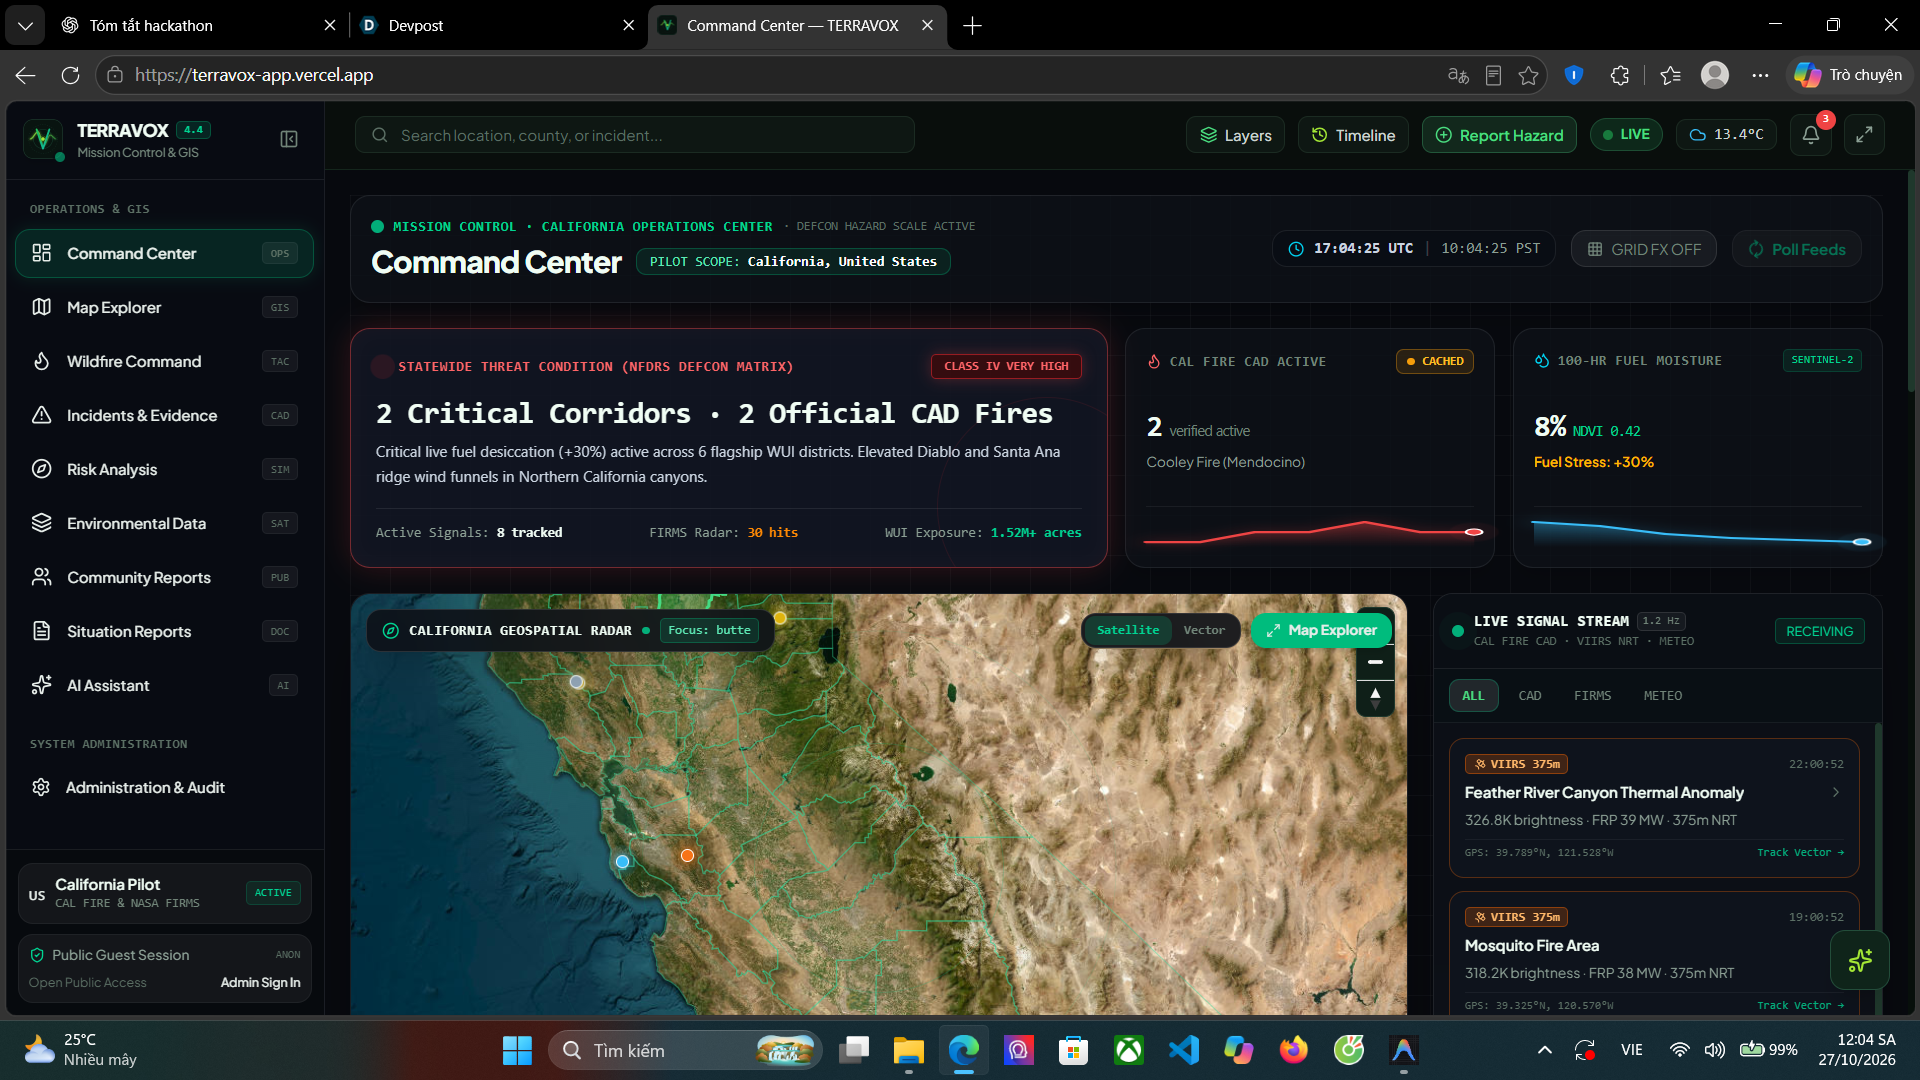
Command Center
Inspiration
Wildfires are becoming an increasingly serious challenge for communities, ecosystems, and emergency responders. California faces complex environmental risks, yet information about active incidents, satellite observations, weather, and vegetation conditions is often scattered across different sources.
We built TERRAVOX — Open Environmental Intelligence to bring these signals into one accessible platform. Our goal is to help people explore environmental conditions, understand potential risks, and examine the evidence behind each signal without requiring an account or specialized GIS expertise.
The core idea is simple: environmental intelligence should be understandable, transparent, and accessible to everyone.
What it does
TERRAVOX combines public environmental data into an interactive intelligence platform focused on California.
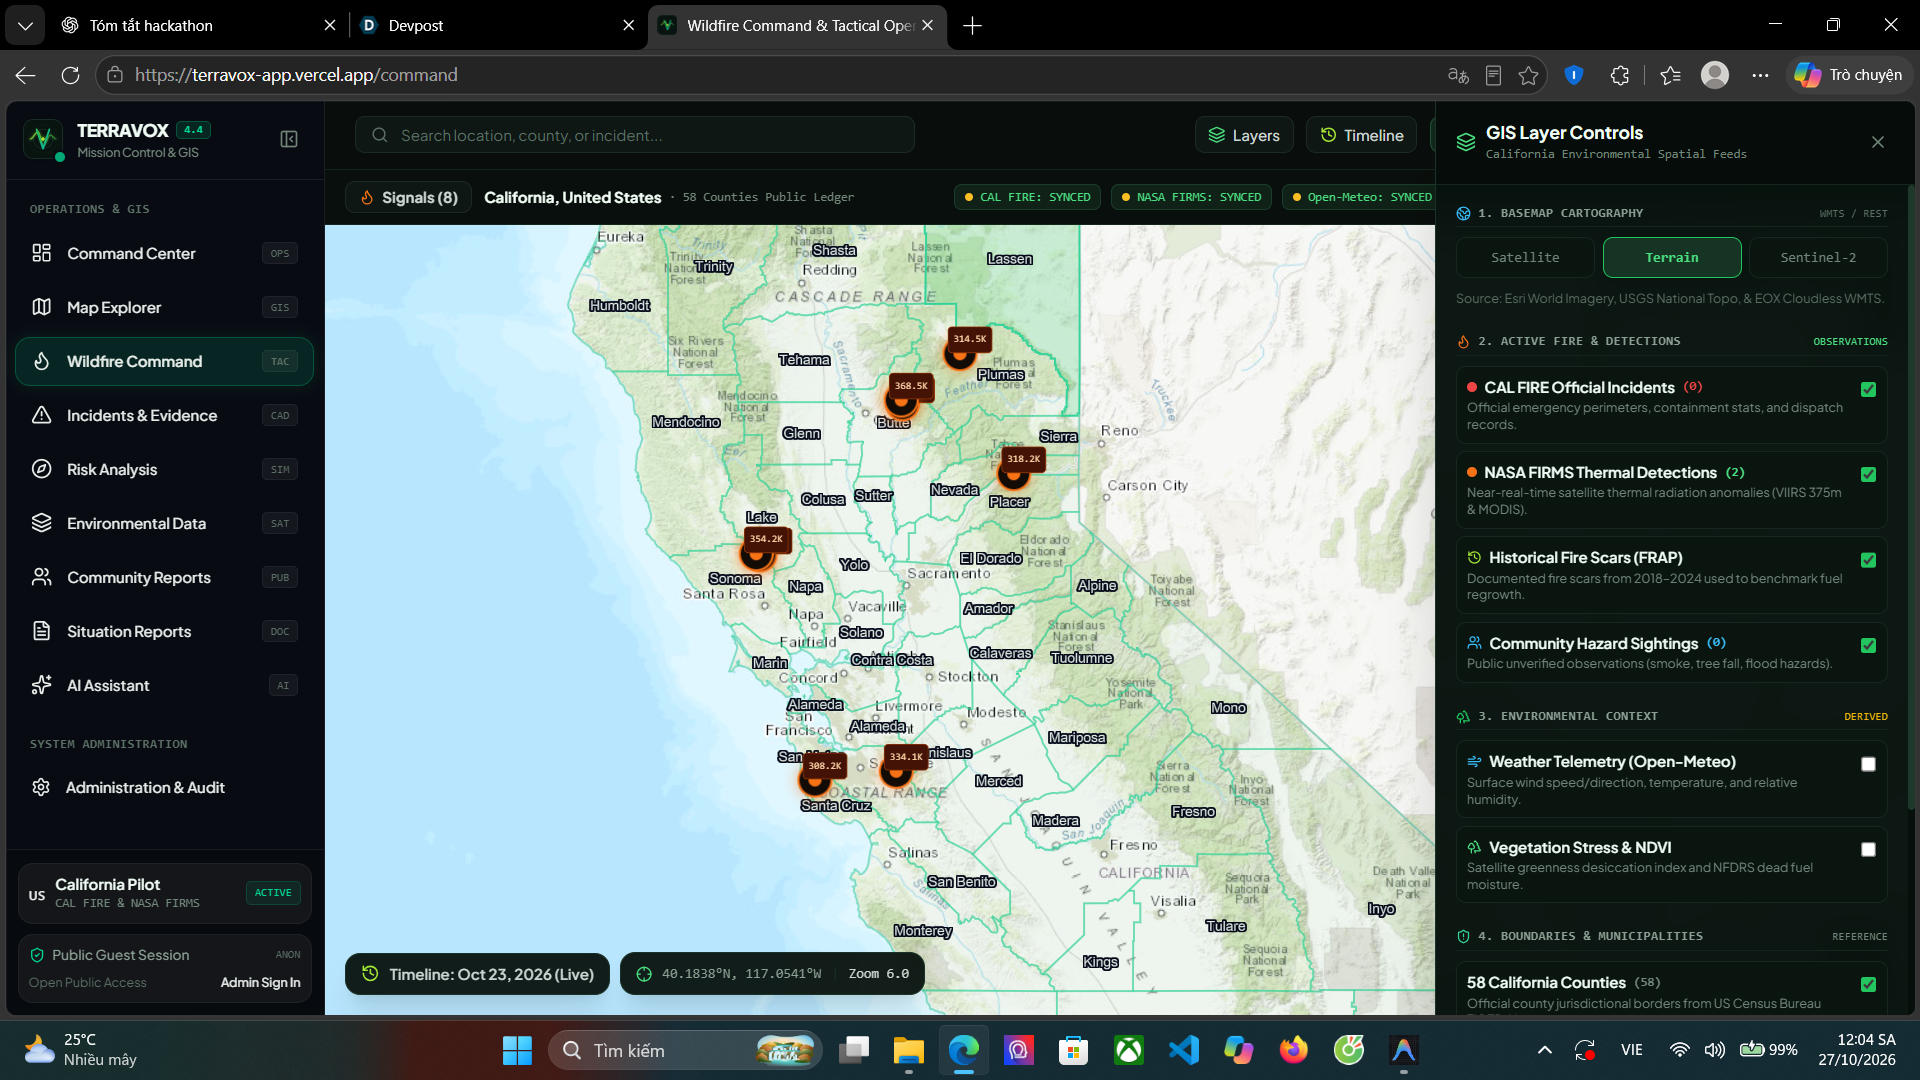
- Command Center: Provides a statewide overview of fire signals, incidents, and environmental conditions.
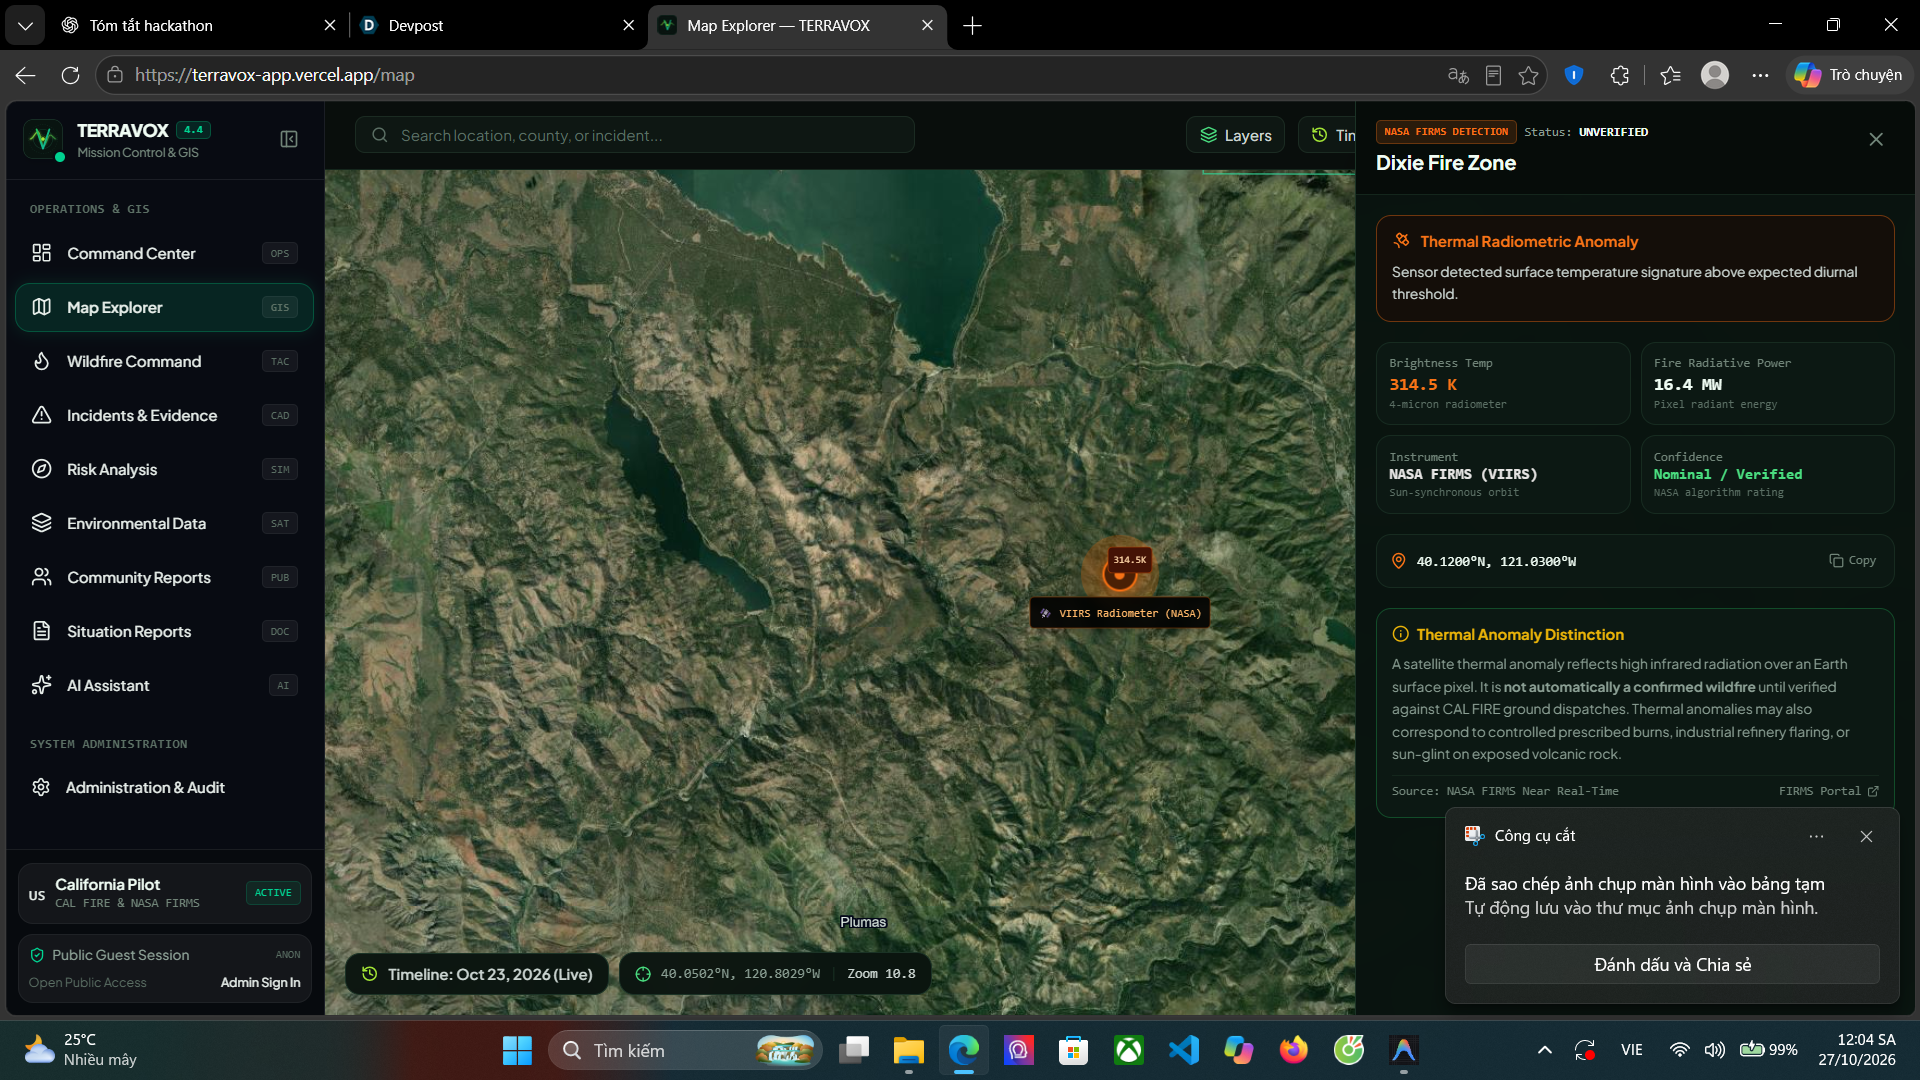
- Map Explorer: Lets users explore geographic areas, official fire incidents, satellite thermal detections, and available map layers.
- Satellite Evidence: Integrates NASA FIRMS observations to help users investigate thermal anomalies and their relationship to reported incidents.
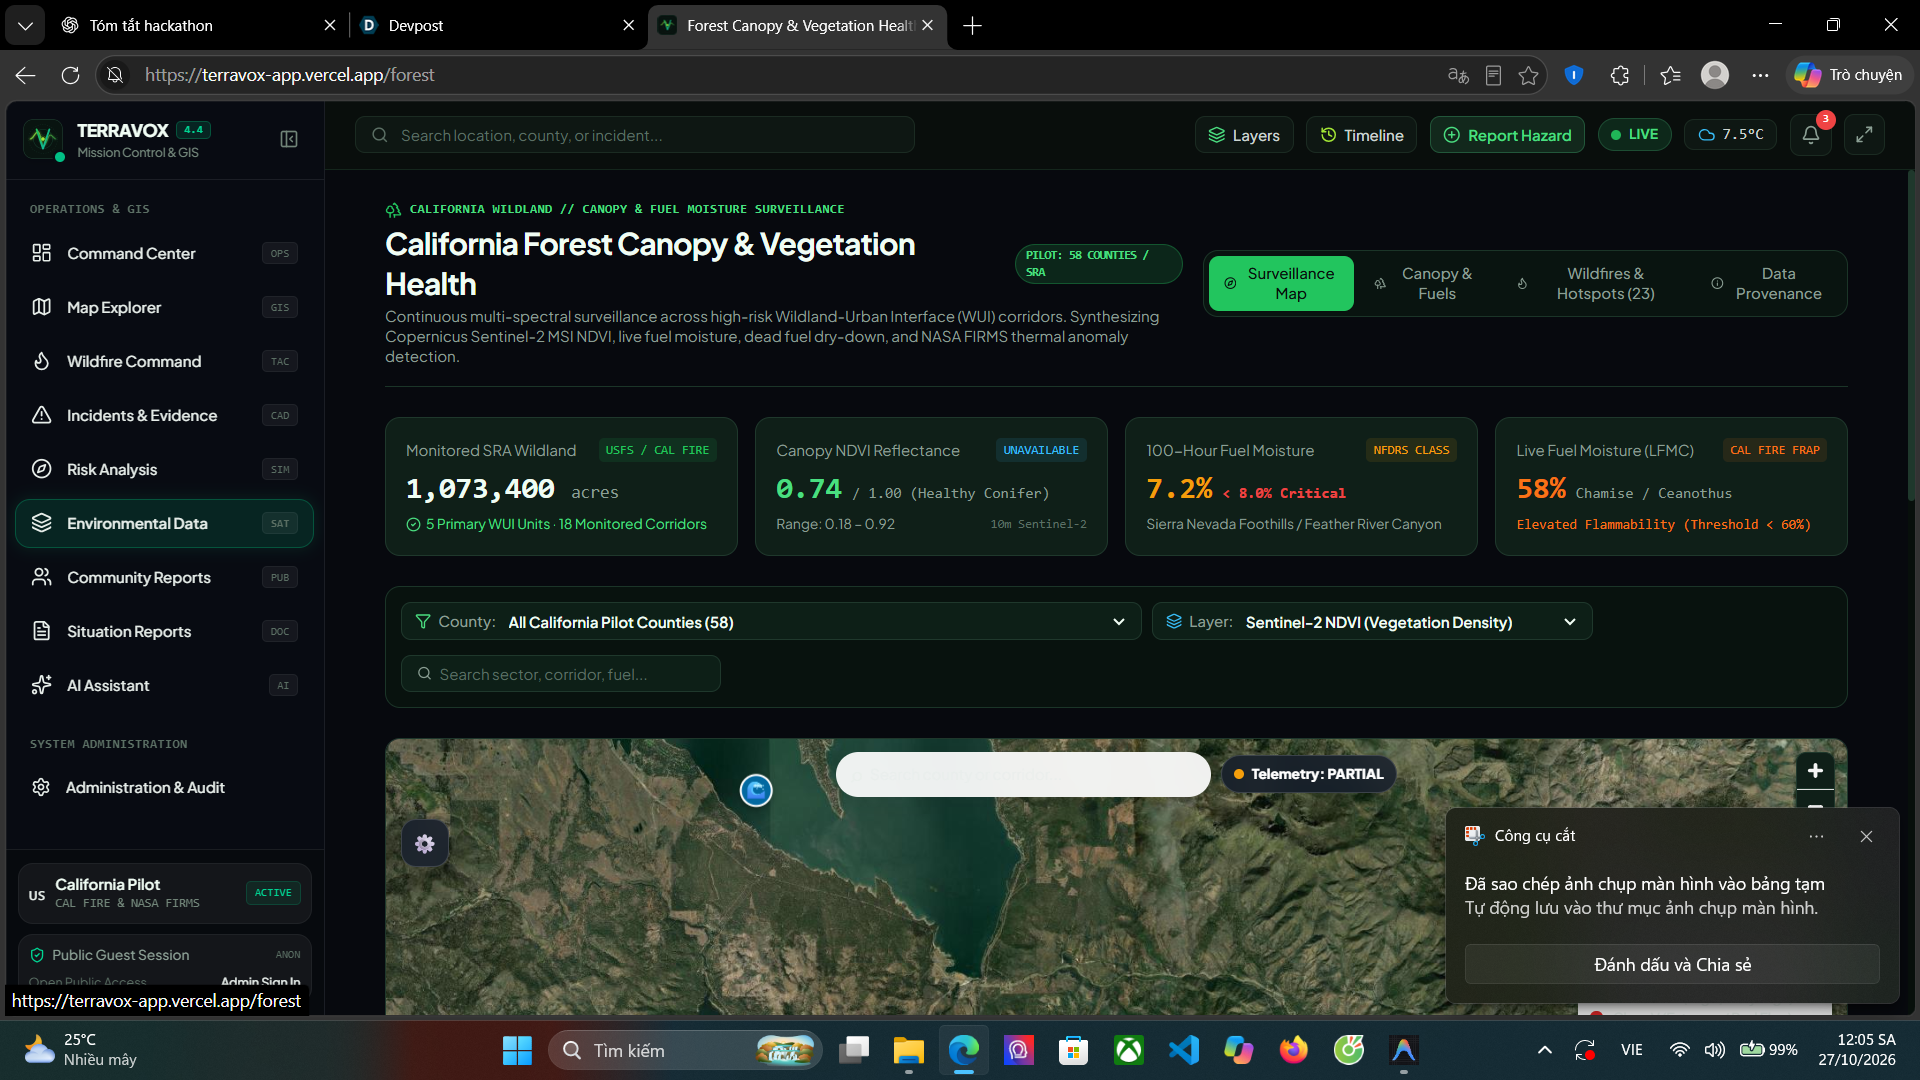
- Environmental Context: Brings together weather and vegetation indicators to provide additional context for environmental risk assessment.
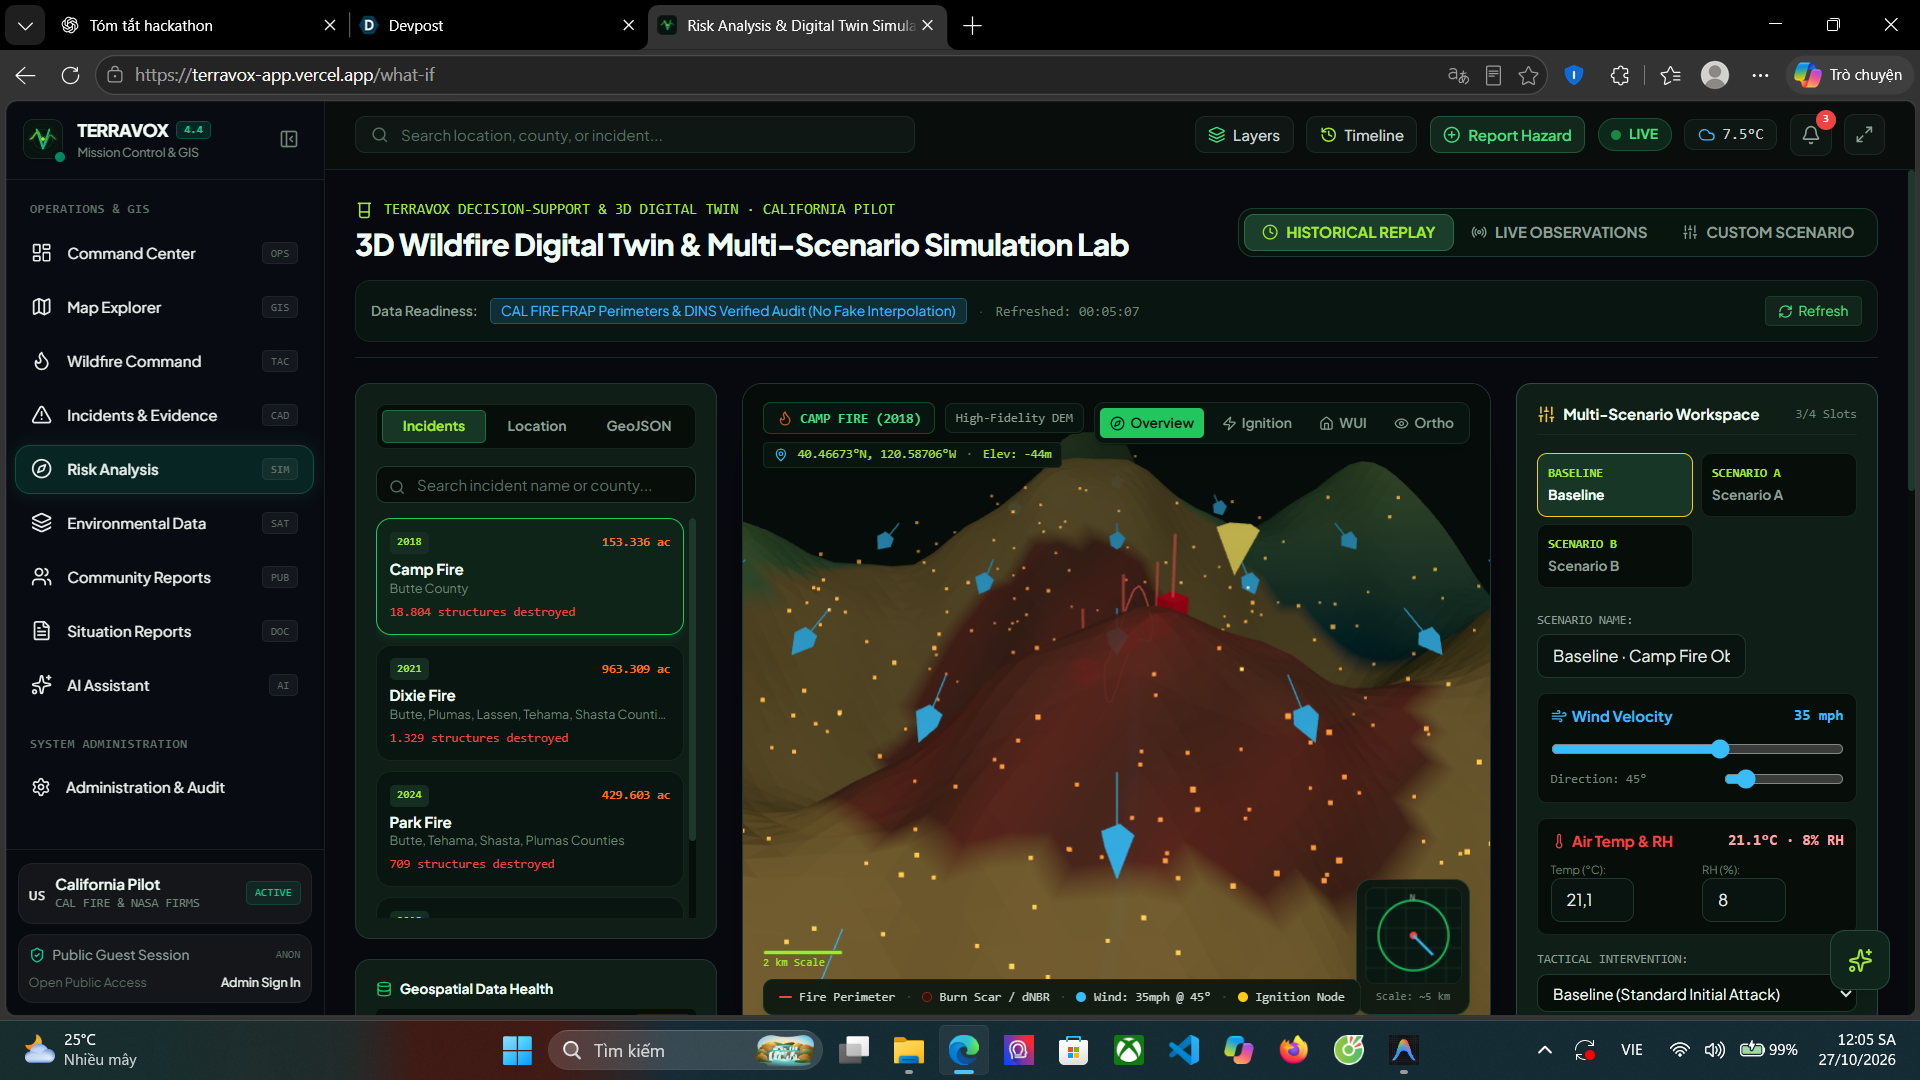
- Historical Analysis: Separates historical wildfire case studies from current incident monitoring to support more responsible comparisons.
- Community Reports: Enables people to submit environmental observations through a public-facing reporting workflow without mandatory login.
TERRAVOX distinguishes official incident records, satellite observations, model-derived indicators, historical evidence, and unverified community reports. It is designed to support situational awareness, not replace official emergency alerts or professional response systems.
How we built it
We developed TERRAVOX as a full-stack geospatial application, using React, TypeScript, Vite, and an interactive mapping stack for the frontend, with a Python FastAPI backend for data services and API integration.
The platform integrates data from sources including NASA FIRMS, CAL FIRE, Open-Meteo, and geographic boundary datasets. We built source-health indicators, caching behavior, satellite-to-incident correlation logic, and explicit data-status labels to make the provenance and freshness of information easier to understand.
We also focused on resilience and usability. The map experience includes a fallback visualization for environments where WebGL is unavailable. The interface uses a consistent design system, responsive layouts, contextual panels, and public access to core exploration features.
The codebase is maintained in GitHub, and the frontend is being prepared for production deployment on Vercel, with backend hosting and configuration handled separately.
Challenges we faced
One of our biggest challenges was making multiple data sources work together without confusing different kinds of evidence. A satellite thermal anomaly is not automatically a confirmed wildfire, and a successful API response does not necessarily mean the underlying observations are fresh.
We addressed this by improving source-status semantics, preserving timestamps and provenance, separating historical cases from active signals, and making uncertainty more visible.
Another challenge was building a usable geospatial interface without overwhelming users with layers, charts, and operational panels. We refined the Command Center and Map Explorer around clearer information hierarchy and progressive disclosure.
We also had to account for unreliable network access, caching, and browser environments where WebGL may not be available.
What we learned
TERRAVOX taught us that environmental intelligence is not just about collecting data or displaying a map. It requires careful data validation, transparent uncertainty, reliable integrations, and thoughtful user experience design.
We learned to distinguish data availability from data freshness, observations from inferences, and historical examples from current conditions. We also learned that a useful public-interest platform must be accessible to non-experts while preserving the technical detail needed for deeper investigation.
What's next
Our next priorities are to strengthen production data reliability, validate historical satellite comparisons against traceable records, improve community reporting and moderation, and evaluate the platform against real-world cases.
Our long-term vision is to make environmental intelligence more open and actionable, helping communities better understand the signals around them and make more informed decisions.
Built With
- cal
- census
- css
- fastapi
- fire
- firms
- gl
- javascript
- maplibre
- nasa
- open-meteo
- python
- react
- tailwind
- tiger/line
- typescript
- us
- vercel
- vite

Log in or sign up for Devpost to join the conversation.