
Inspiration
Our idea for TerrainRiskAI came from a very real and slightly terrifying moment. One of our teammate’s parents had bought a house in Washington State. Then one day while looking at maps, we discovered that their home was located directly on a major fault line. What shocked us most wasn’t just that it was risky, it was that this wasn’t the first time this had happened. Both times they had purchased homes, they unknowingly bought property sitting on major geological risk zones.
That realization caused immediate panic in our households. It made us ask a simple question:
Why is critical environmental risk data so hard for normal people to access?
There is plenty of data available; seismic maps, wildfire history, flood plains, soil stability, climate trends, but it’s scattered across agencies, buried in technical datasets, or difficult to interpret without expertise. We realized that what people actually need is actionable insight.
That moment became the seed for TerrainRiskAI (pun intended!).
What it does
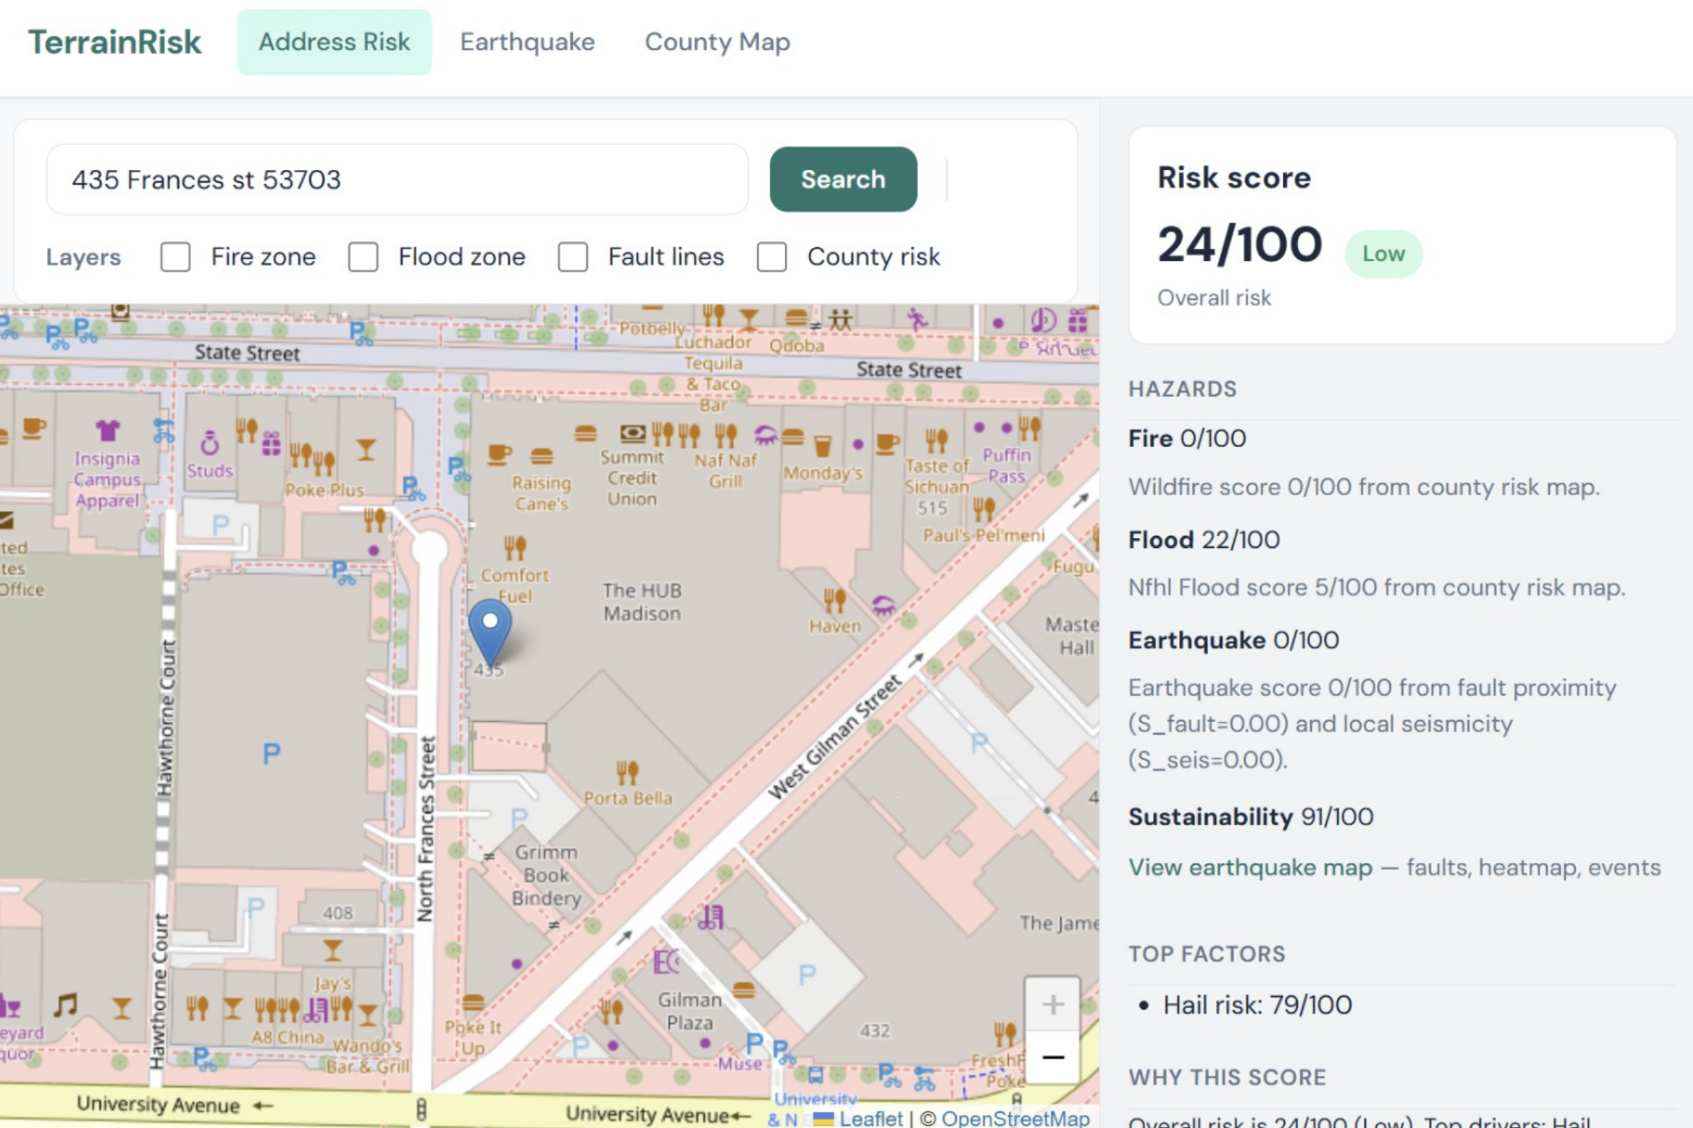
TerrainRiskAI is an AI-powered environmental risk analysis platform that evaluates land or property and predicts potential environmental threats. A user simply inputs an address or geographic coordinates, and the system analyzes risk factors such as:
- Flood Risk
- Storm Flood
- Wildfire
- Tornado
- Wind
- Winter
- NFHL Flood
Instead of showing raw datasets, TerrainRiskAI outputs an interpretable risk profile score:
Risk Score = sum(i=1->n) w_i * f_i(location)
Where:
- ( f_i ) = risk function for environmental factor ( i )
- ( w_i ) = importance weight of that factor
This lets us turn multi-source environmental data into a single understandable metric.
How we built it
We engineered TerrainRiskAI as a full data-to-decision pipeline, combining geospatial datasets, machine learning models, and an interactive frontend. Below is a breakdown of the system architecture, data sources, and technical stack.
A) Data Pipeline & Sources
Our biggest engineering effort was building a reliable environmental risk dataset from multiple government and scientific sources and converting them into unified risk scores.
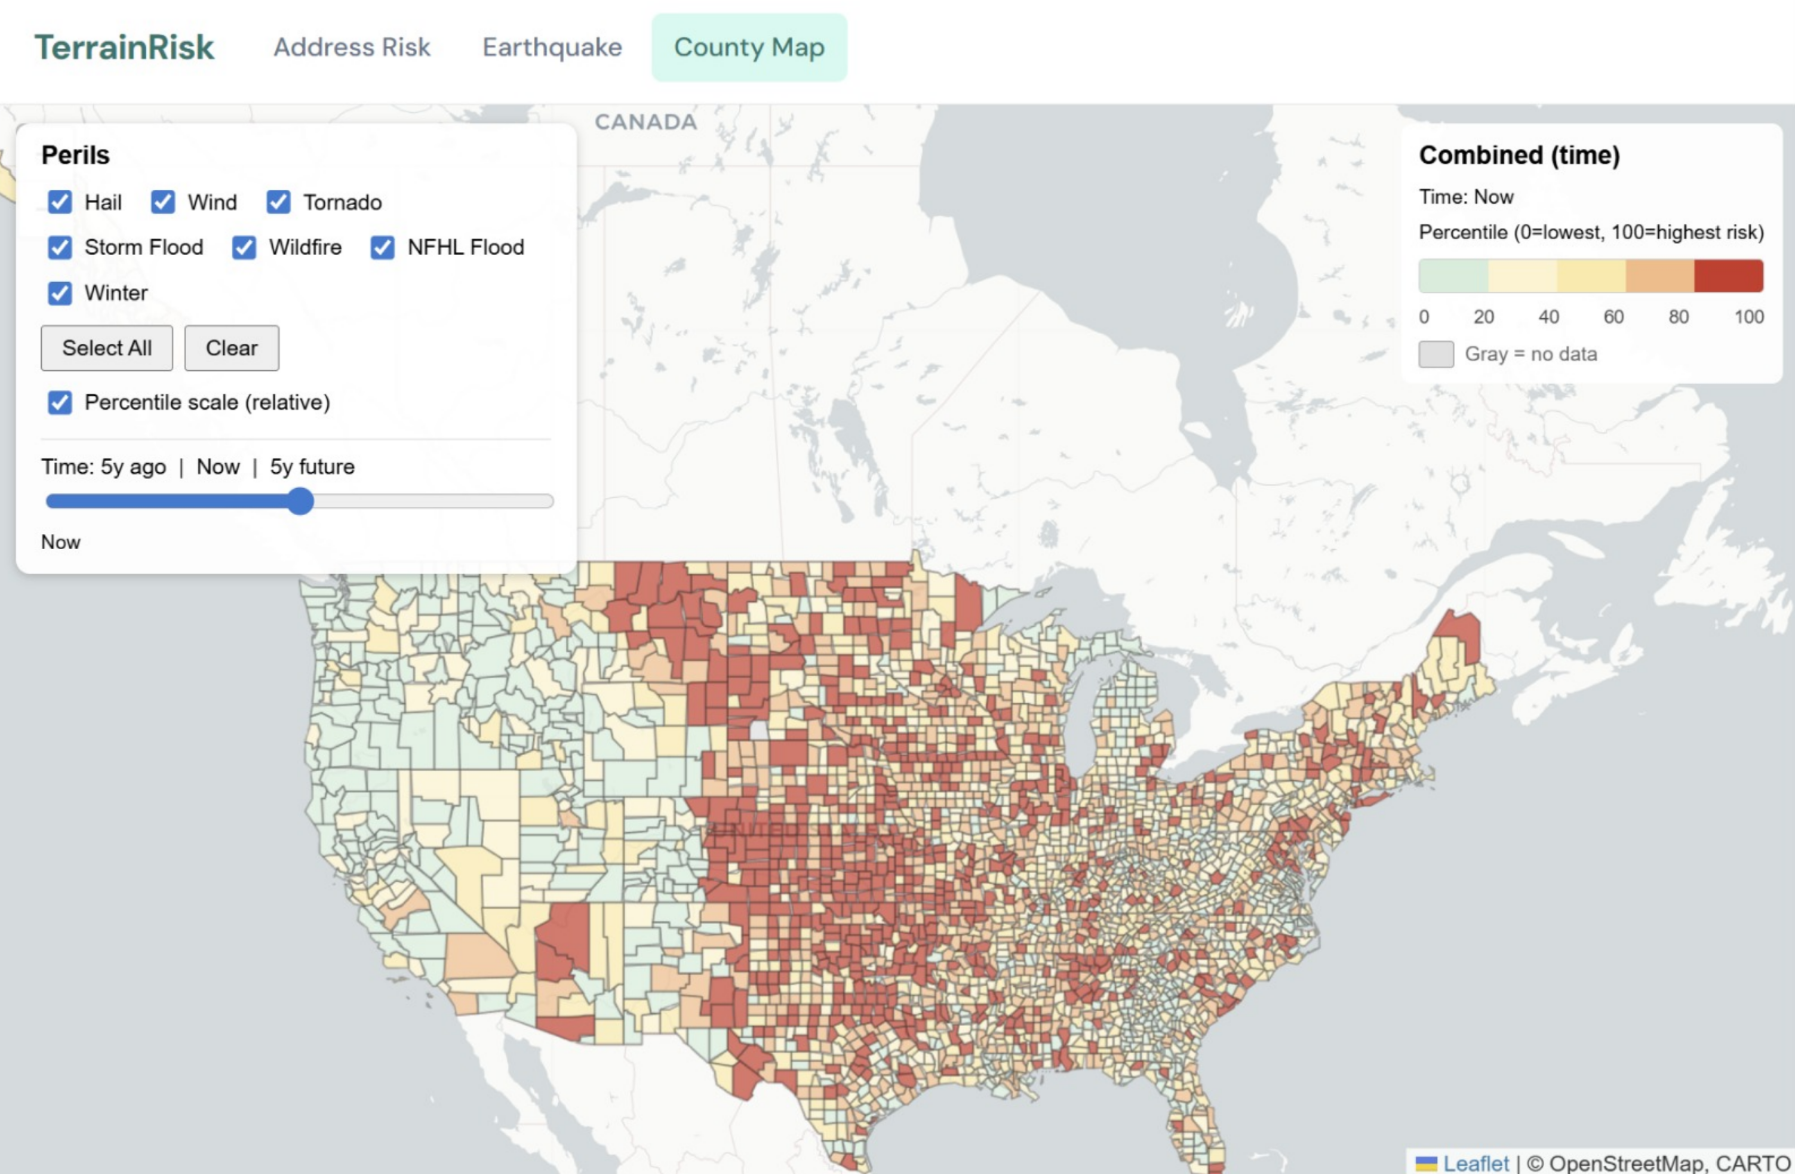
1. County-Level Hazard Risk Map (US - FIPS keyed)
We compute hazard scores per county after reverse-geocoding a user’s address into a county FIPS code.
Primary Sources
NOAA Storm Events Database (2000–2025)
Used to calculate county-level risk for:
- Hail
- Wind
- Tornado
- Storm flood
Method
County Risk = Normalize(Event Rate + Impact Proxies)
Where impact proxies include damage estimates, duration, and severity. All hazards are normalized to a 0–100 scale for consistency.
FEMA National Risk Index (NRI) + NFHL Flood Data
Provides precomputed county risk metrics for:
- Wildfire risk (=) likelihood × impact
- Flood exposure
These values are scaled to match our standardized 0–100 hazard system.
US Census County Boundaries
We used official shapefiles to:
- Render county choropleth maps
- Join risk scores to geometry
- Export final results into FIPS-indexed JSON
2. Winter Hazard Model (WHI)
Some counties include a Winter Hazard Index (WHI) generated through our custom pipeline.
Inputs
NOAA GHCN Daily station data
- temperature
- snowfall
- snow depth
- temperature
NOAA winter storm events
- counts
- rolling windows
- damage estimates
- counts
WHI Construction
WHI = w1(Extreme Cold) + w2(Snow Load) + w3(Storm Events) + w4(Damage)
If winter coverage is unavailable for a county, the winter score is excluded rather than assumed.
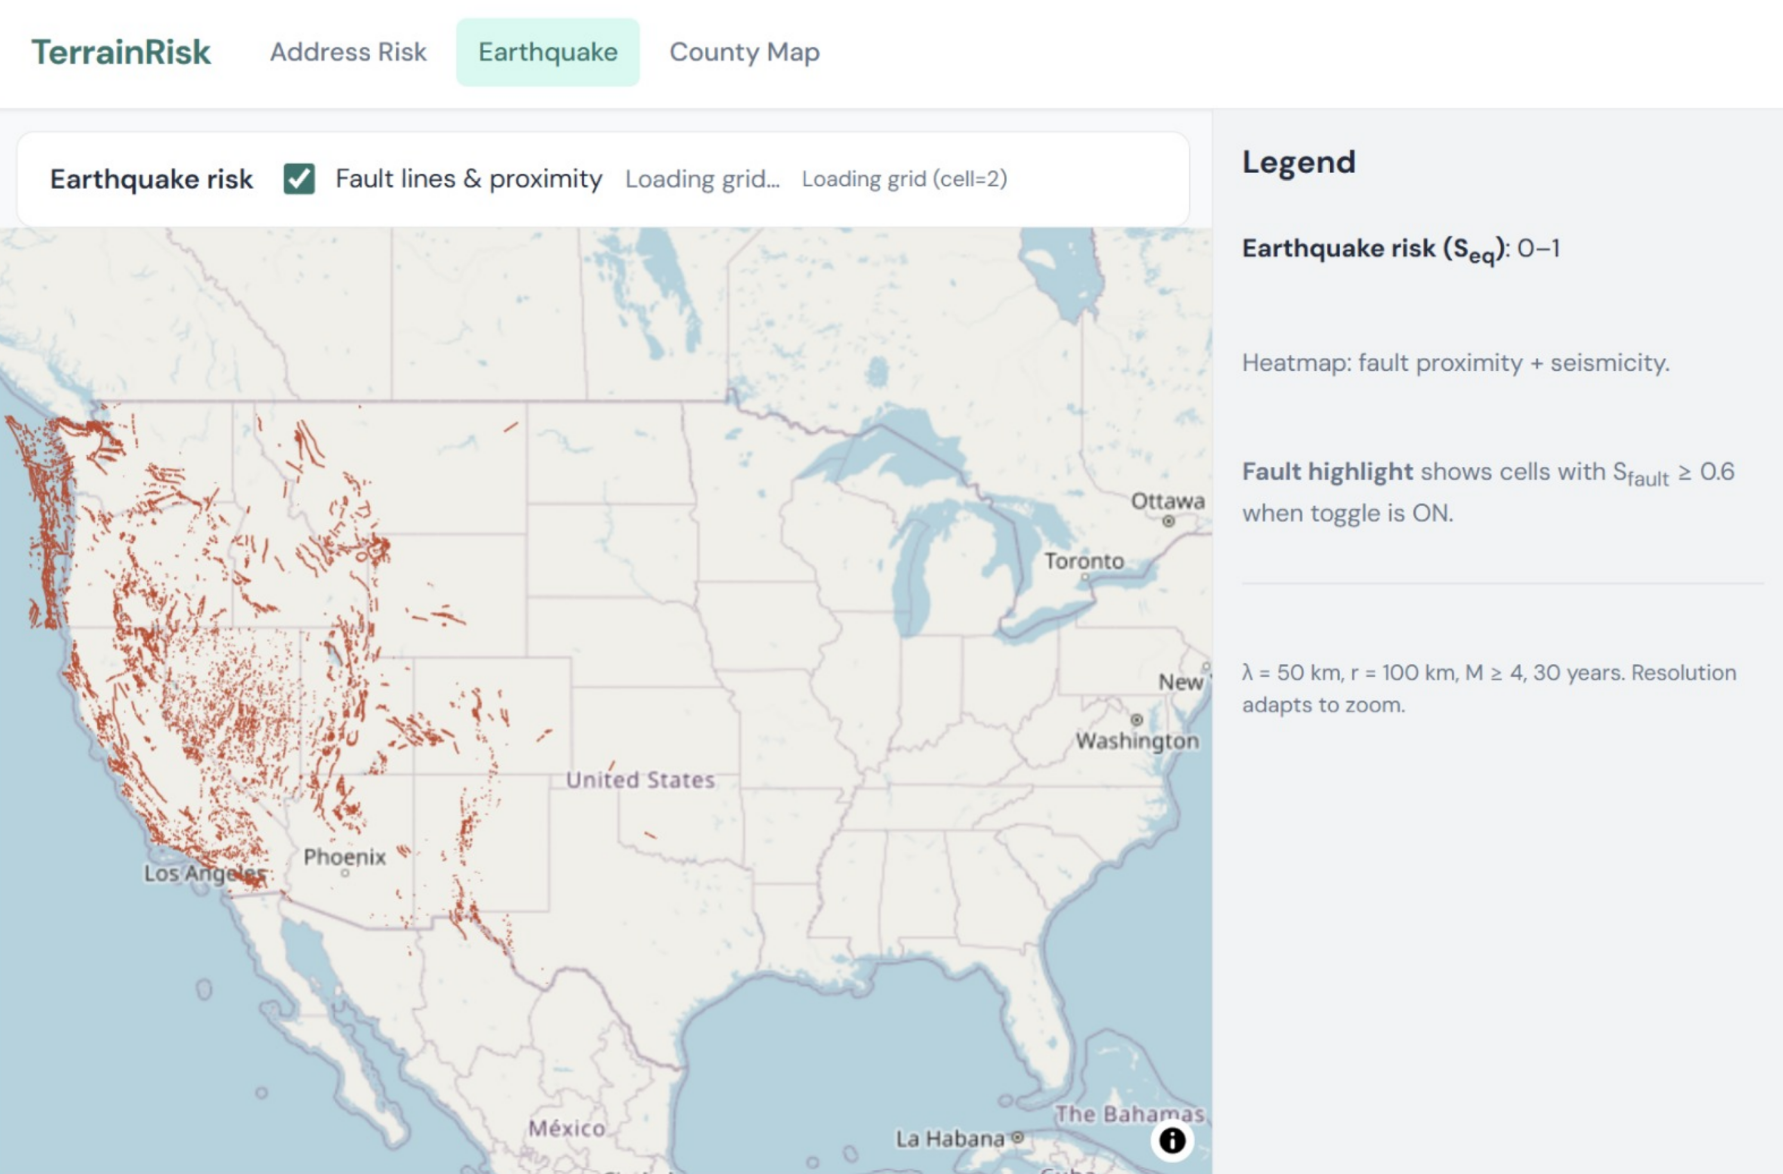
3. Earthquake Hazard (Coordinate-Level)
Unlike other hazards, earthquakes are computed per exact location rather than county.
Data Sources
- USGS Fault Geometry Data, distance-based fault proximity score (S_{\text{fault}})
- USGS Earthquake Catalog (≈30 yrs, M ≥ 4) local seismicity score (S_{\text{seis}})
Combined Score
S_eq = f(S_fault, S_seis)
Earthquake Risk = 100 * S_eq
4. Satellite Imagery
Optional visual verification layer:
- Google Geocoding API producing address coordinates
- Google Maps Static API producing satellite imagery
This lets users visually inspect terrain, vegetation, flood plains, and surroundings.
B) Technology Stack
Backend / Modeling
- Python
- Pandas + NumPy (data processing)
- scikit-learn (ML models)
- Linear Regression
- RandomForestRegressor
Models
- Linear Regression for interpretable baseline
- RandomForestRegressor for nonlinear accuracy
Artifacts
- joblib to model persistence
- parquet readers (pyarrow / fastparquet) to efficient winter dataset loading
Frontend
- React web interface
- Interactive map + overlays
- Real-time risk scoring display
Challenges we ran into
1. API Rate Limits
One of our biggest technical barriers was simply getting enough data. Many environmental and satellite APIs enforce strict rate limits, meaning we could only pull small amounts of data at a time.
2. Ambitious Early Plan
Originally, we wanted to integrate cutting-edge datasets and tools like:
- Google Alpha Earth
- WeatherNext prediction systems
These platforms contain massive, high-resolution global environmental data. However, we quickly discovered a practical constraint:
Model Training Time + Data Cleaning Time > Hackathon Time Who would've thought?!? (not us initially)
The datasets were simply too large and too complex to preprocess within our project timeline. We had to pivot to smaller, cleaner datasets that still captured meaningful environmental signals.
Accomplishments that we're proud of
- Built a full end-to-end system in limited time
Designed and implemented a working pipeline from raw environmental data, we cleaned features, ML models, and created an interactive frontend all in 24 hours! - Overcame real API and data engineering challenges
Worked through rate limits, dataset inconsistencies, and formatting mismatches to build a reliable data pipeline. - Validated a real-world use case
Demonstrated how environmental AI can directly help industries like insurance, real estate, and urban planning make smarter decisions.
What we learned
- Data engineering is the hardest part of AI
Training models wasn’t the main challenge — collecting, cleaning, aligning, and standardizing real-world environmental datasets was. We learned that most real AI work is actually data infrastructure. - Scope management is critical
We initially planned to use massive datasets like advanced Earth-system models, but realized quickly that ambitious ideas must be balanced with time constraints. Learning when to pivot was one of our biggest engineering lessons.
What's next for TerrainRiskAI
1) Insurance Industry Integration
One of the strongest applications for TerrainRiskAI is insurance underwriting and risk assessment. Instead of relying solely on historical claims data, insurers could incorporate predictive environmental risk scores when evaluating policies.
Potential uses:
- Dynamic premium pricing based on environmental exposure
- Automated risk audits for new policies
- Early warning alerts for high-risk clients
2) Real Estate Platform Integration
We envision TerrainRiskAI embedded directly into property search platforms such as Zillow and similar marketplaces.
Future property listings could display:
- Flood risk score
- Fire exposure rating
- Earthquake proximity risk
- Climate stability index
So instead of buyers asking:
“Is this house safe?”
They would instantly see a verified environmental risk profile before purchasing.
3) MLS Database Integration
A major next step is gaining access to Multiple Listing Service (MLS) databases used by real estate agents and brokers.
Why MLS matters:
- MLS contains the most complete and up-to-date property listings
- Includes detailed metadata not available publicly
- Provides historical sale records
- Offers property structural details
Integrating MLS data would allow TerrainRiskAI to:
- Score properties automatically as they are listed
- Provide risk badges inside agent dashboards
- Generate risk-adjusted valuation insights
- Detect environmental risk trends across housing markets
This would transform TerrainRiskAI from a consumer-facing tool into an industry infrastructure layer used directly by real estate professionals.
AI Usage
AI played an important role in our development process, not as a replacement for our work, but as a technical accelerator and brainstorming tool. We did not rely on AI to design our system architecture or make decisions for us. Instead, we treated it like an interactive reference system that could suggest possibilities, explain concepts, or sanity-check ideas while we remained fully responsible for:
- architecture decisions
- model design
- feature engineering
- final implementation
Built With
- css
- google-maps
- javascript
- joblib
- noaa
- numpy
- pandas
- pyarrow
- python
- react
- scikit-learn


Log in or sign up for Devpost to join the conversation.