TerraPulse was inspired by a simple question:
What if exploring cities felt like opening a beautifully designed travel magazine instead of scrolling through a data dashboard?
Most travel platforms are information-heavy and visually cluttered. We wanted to create something different — a calm, climate-aware, visually poetic exploration experience.
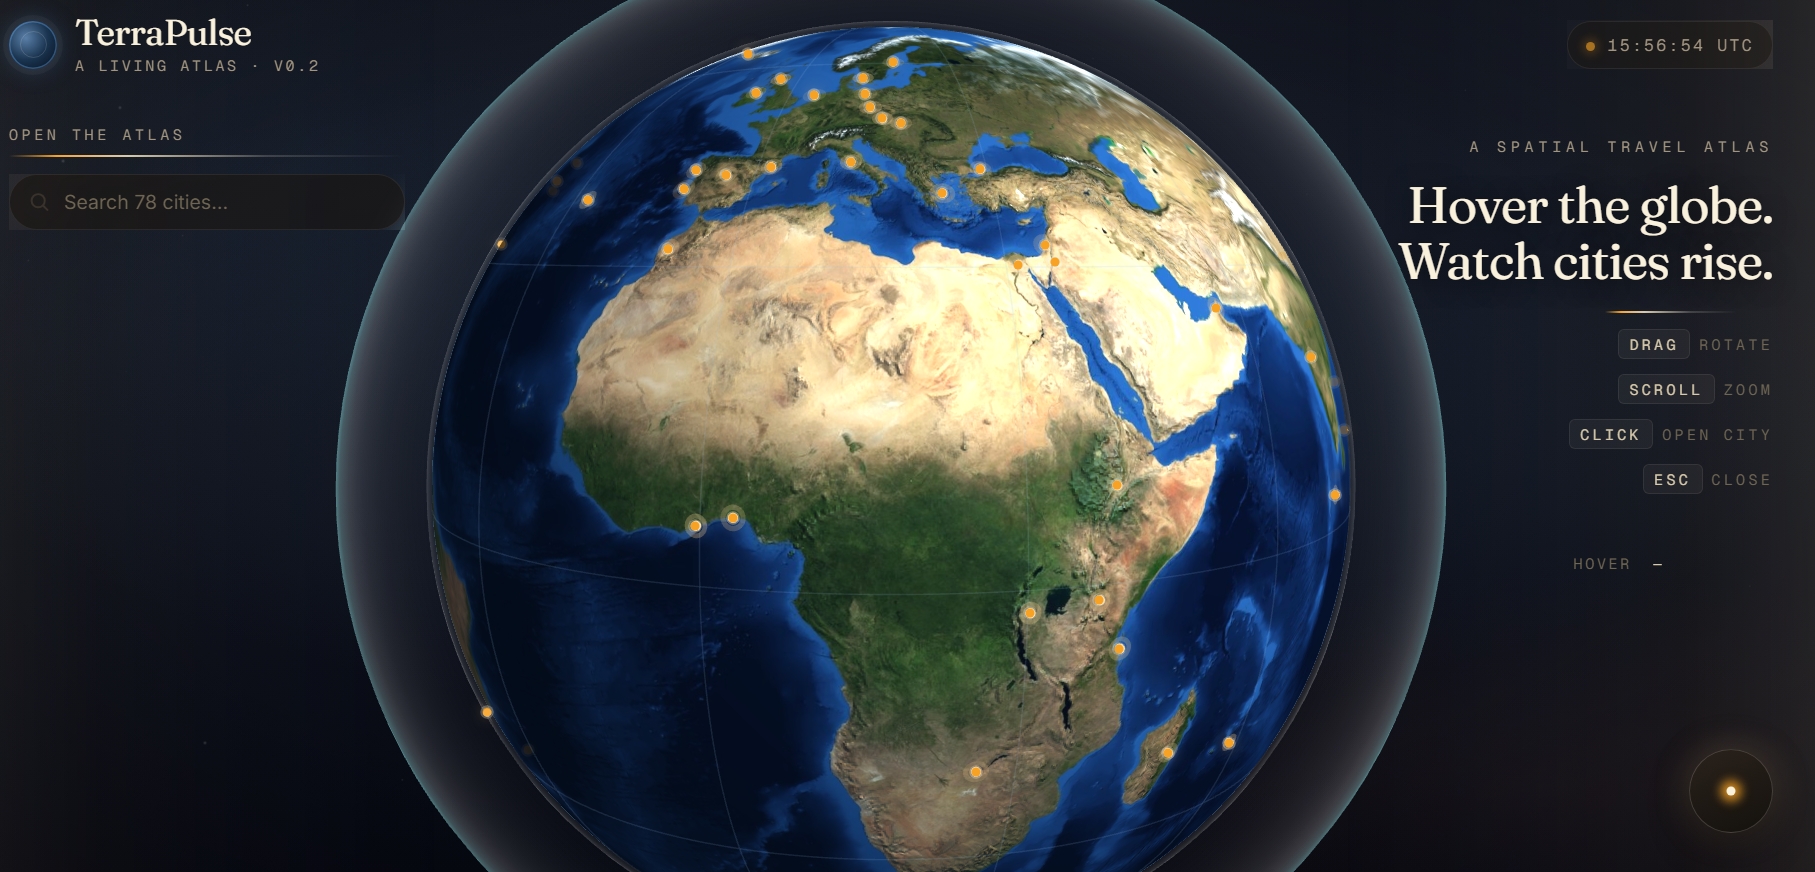
The idea started with a 3D globe as the entry point. Instead of listing cities in text, users rotate the Earth, click a glowing city, and enter a layered experience that feels immersive and intentional.
We were especially inspired by:
Editorial travel magazines Climate-driven design systems The emotional feeling of “arrival” when discovering a new place
TerraPulse is about atmosphere. What it does
TerraPulse is a multi-layer interactive travel interface:
Layer 1 — The Globe
A 3D Earth where cities glow dynamically. Users rotate and select a destination.
Layer 2 — City Cover
A full-screen, climate-aware travel cover:
Large atmospheric photography Soft pastel palettes adapting to geography Big typography Five immersive tabs (Landmarks, Trending, Food, Weather, Community) Layer 3 — Section Zoom
Each tab zooms in with a page-turn animation, inheriting the city’s climate style.
Layer 4 — Landmark Postcard
Clicking a landmark opens a floating travel postcard:
Cinematic image Description Rating Direct Google Maps link
We designed the experience to feel light, breathable, and joyful — never like a dashboard.
How we built it
We built TerraPulse as a layered front-end system.
Design System
We implemented five climate-based UI palettes:
Coastal — mist blue / sand Tropical — peach / cream Mountain — fog green / stone Warm — honey / apricot Urban — silver / pale violet
Each city is mapped to a climate category, and the UI dynamically adapts colors and accents.
Architecture React-based component structure Layered rendering system (Globe → Cover → Section → Lightbox) CSS-based animated transitions Climate-aware theme engine Modular landmark card system
We also integrated:
Automated image sourcing workflow Structured Google Maps links for each landmark Voice narration pipeline (via ElevenLabs) for immersive city introductions Challenges we ran into
- Design vs. Data Balance
Early versions felt like a dashboard — too many numbers, too much density. We had to redesign the entire second layer to feel like a travel editorial spread instead of a data interface.
- Multi-layer UX Architecture
Ensuring smooth transitions between:
Globe → Cover Cover → Section Section → Postcard
Without visual clutter required major structural refactoring.
- Image Scaling
With 78 cities and 3–4 landmarks each, we faced large-scale image automation challenges.
We designed a prompt-based system for sourcing:
Hero city imagery Landmark photography Consistent 3:2 aspect ratio Editorial lighting style
- Climate-Based Theming
The hardest part was subtlety. The system needed variation without fragmentation. Each city feels unique — but still part of one visual language.
What we learned Great UX is about restraint. Motion should feel like breathing, not exploding. Climate can be a powerful design variable. A visual system can carry emotion better than text.
Most importantly:
Judges notice feeling before functionality.
We learned how to build not just a product — but an atmosphere.

Log in or sign up for Devpost to join the conversation.