-
-
TerraLens -- Home
-
Analysis
-
HyperLocal -- steps
-
Project
-
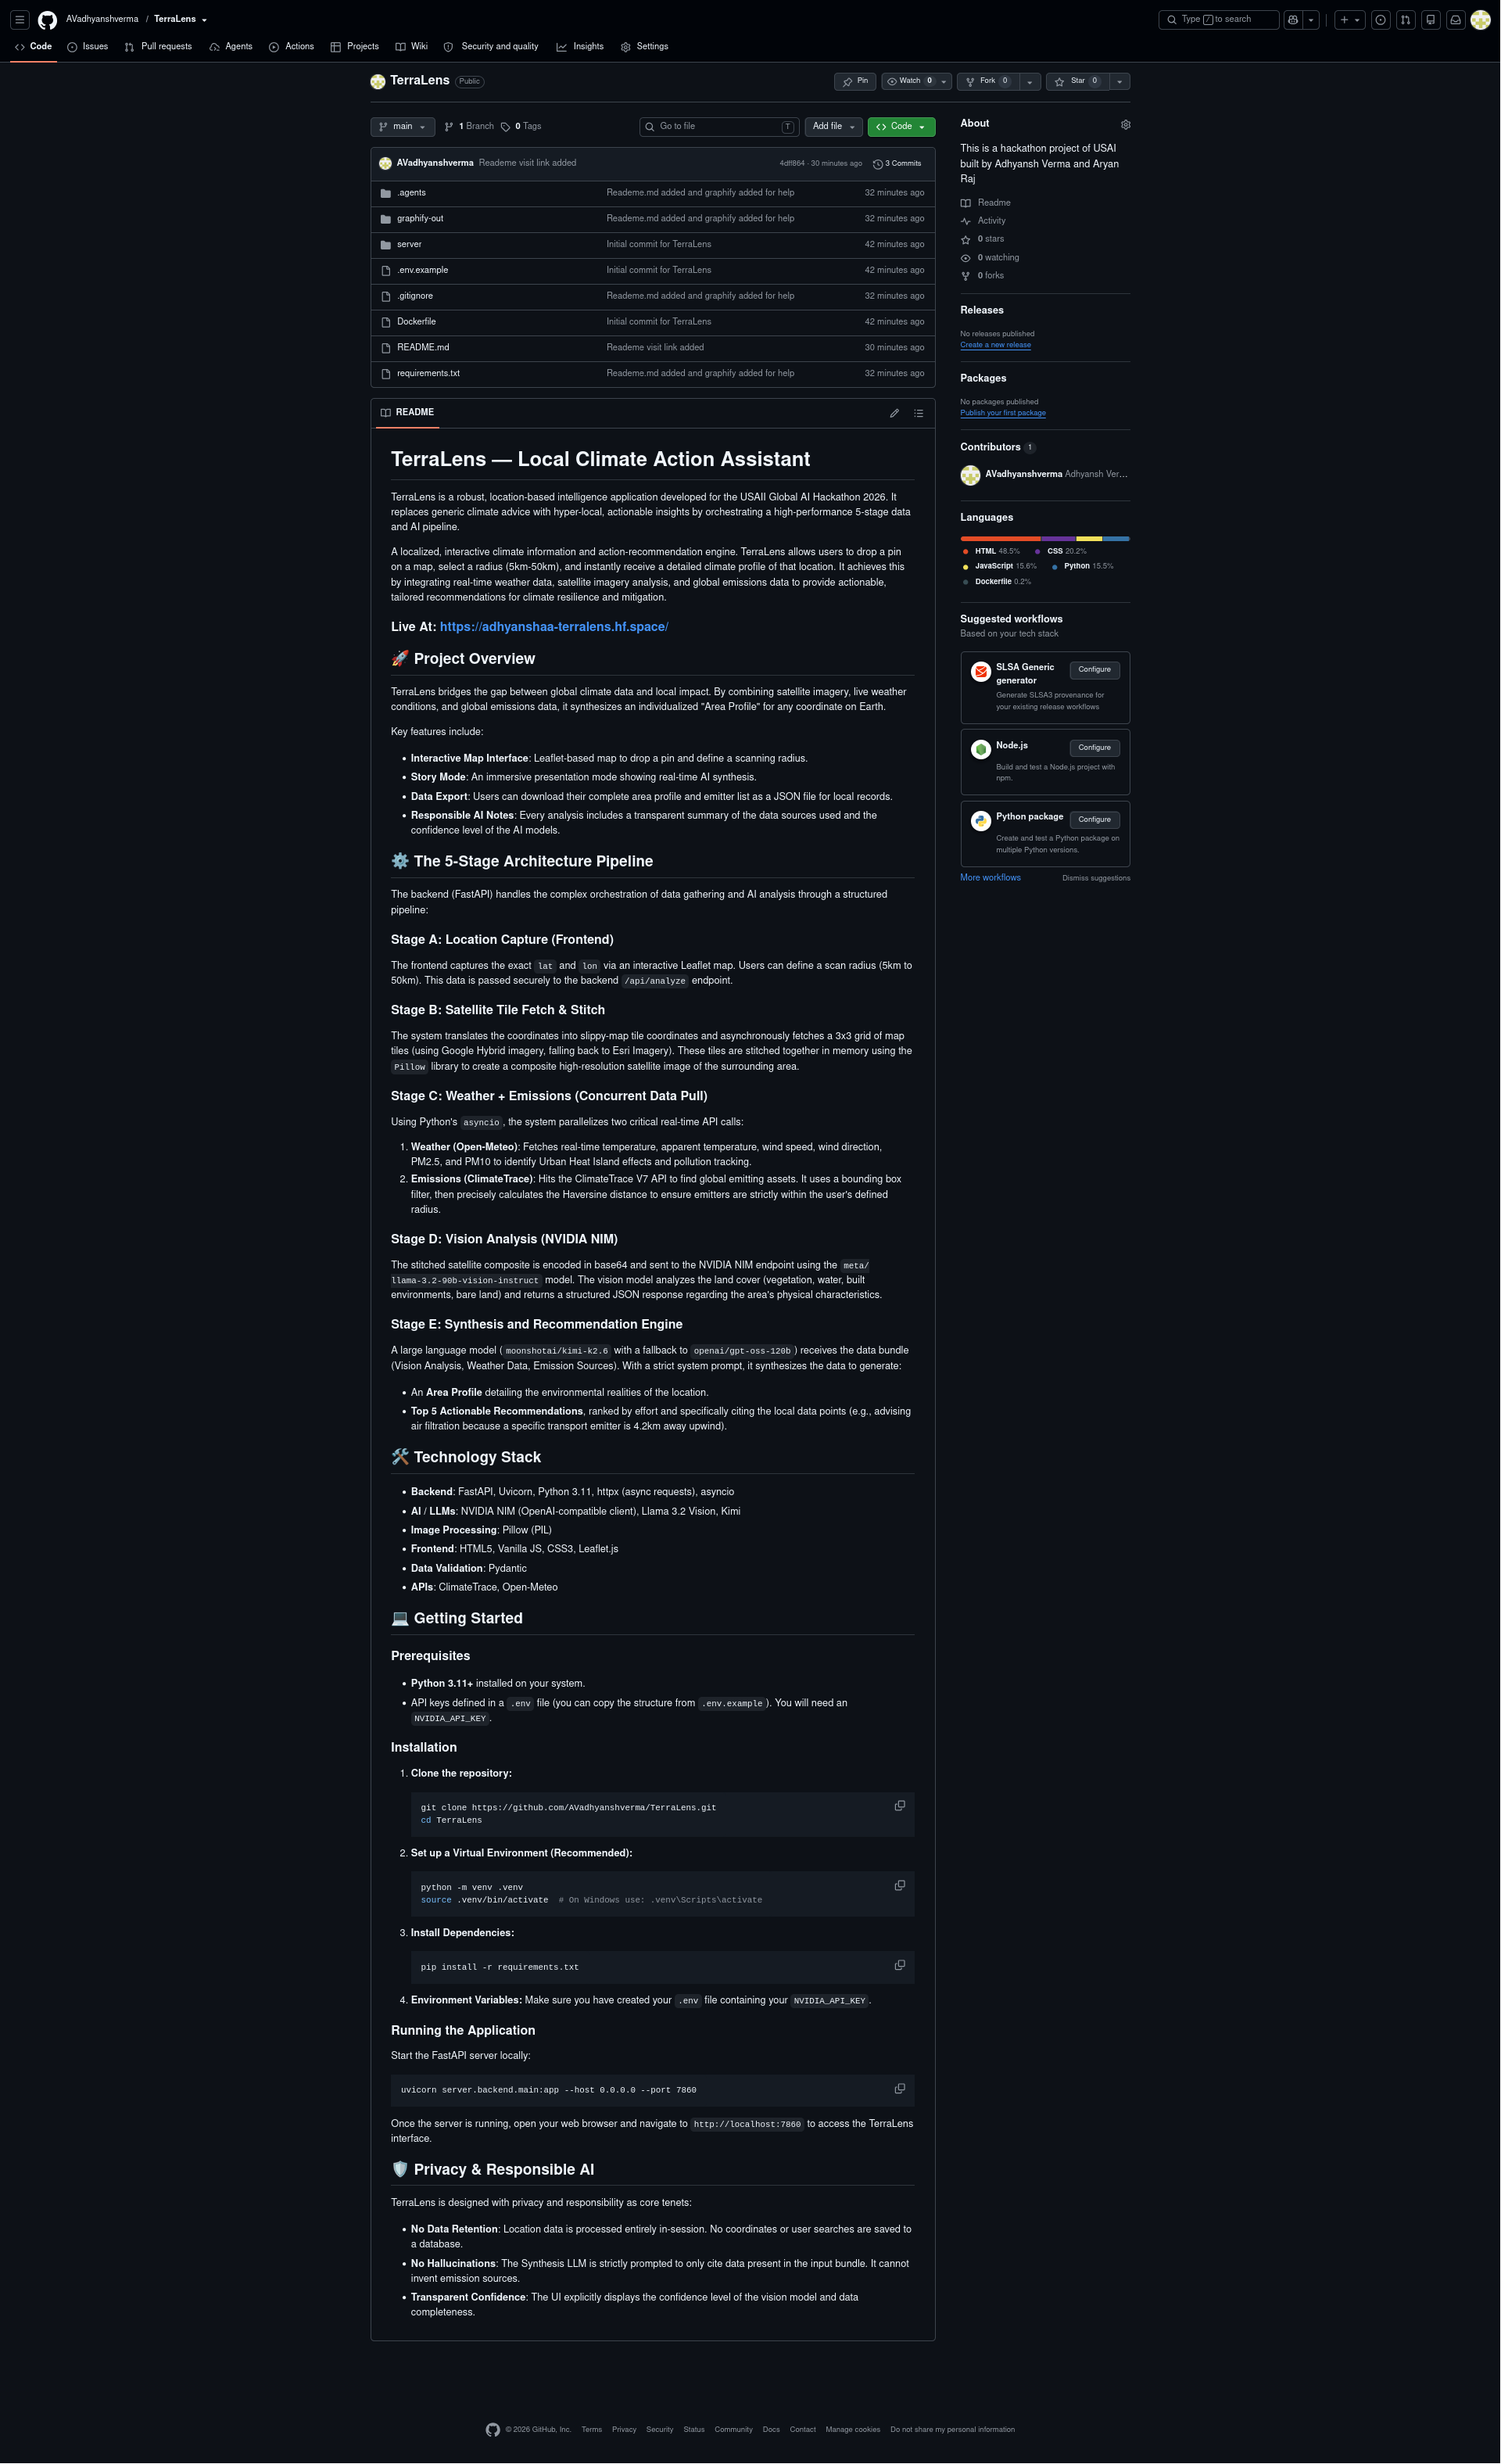
Github
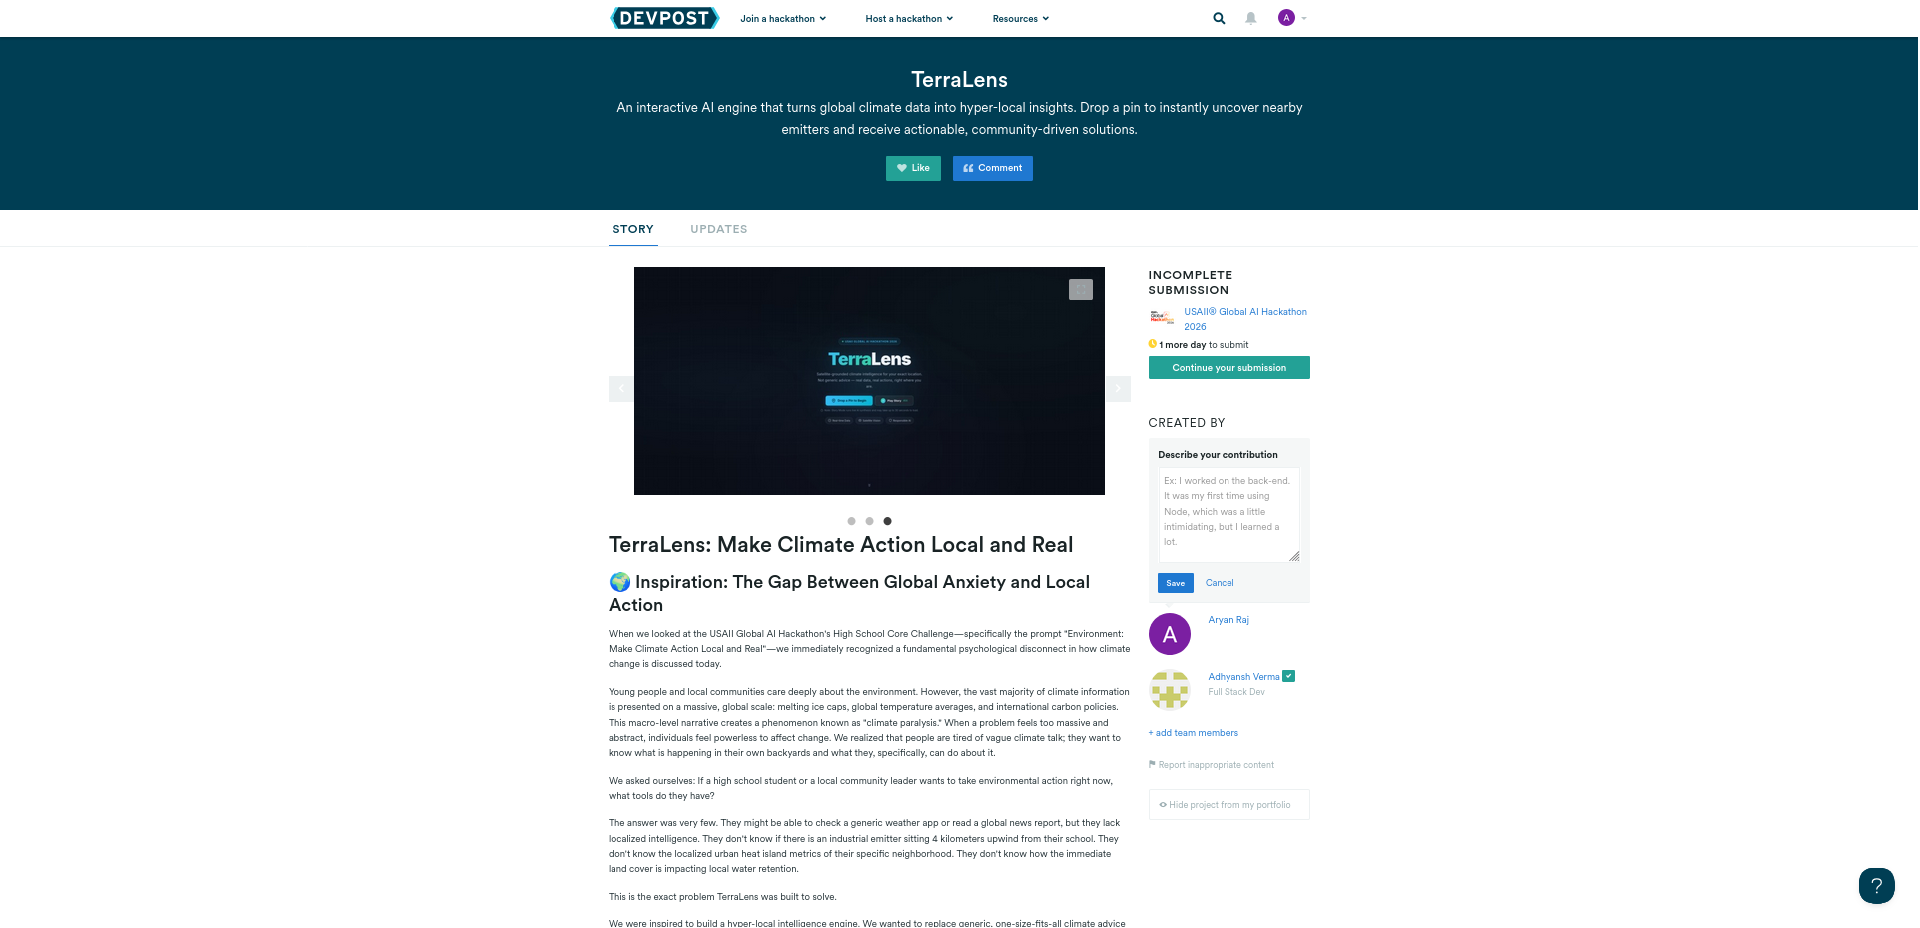
TerraLens: Make Climate Action Local and Real
🌍 Inspiration: The Gap Between Global Anxiety and Local Action
When we looked at the USAII Global AI Hackathon's High School Core Challenge—specifically the prompt "Environment: Make Climate Action Local and Real"—we immediately recognized a fundamental psychological disconnect in how climate change is discussed today.
Young people and local communities care deeply about the environment. However, the vast majority of climate information is presented on a massive, global scale: melting ice caps, global temperature averages, and international carbon policies. This macro-level narrative creates a phenomenon known as "climate paralysis." When a problem feels too massive and abstract, individuals feel powerless to affect change. We realized that people are tired of vague climate talk; they want to know what is happening in their own backyards and what they, specifically, can do about it.
We asked ourselves: If a high school student or a local community leader wants to take environmental action right now, what tools do they have?
The answer was very few. They might be able to check a generic weather app or read a global news report, but they lack localized intelligence. They don't know if there is an industrial emitter sitting 4 kilometers upwind from their school. They don't know the localized urban heat island metrics of their specific neighborhood. They don't know how the immediate land cover is impacting local water retention.
This is the exact problem TerraLens was built to solve.
We were inspired to build a hyper-local intelligence engine. We wanted to replace generic, one-size-fits-all climate advice (like "use fewer plastic straws") with precision, data-backed recommendations (like "An industrial manufacturing plant is 3.5km upwind of your location, contributing to high PM10 levels; local action should focus on advocating for indoor air filtration in nearby schools"). By shrinking the scale of the data down to a user-defined 5km to 50km radius, we transform overwhelming global anxiety into focused, actionable local empowerment.
🔍 What it does: Hyper-Localizing Environmental Intelligence
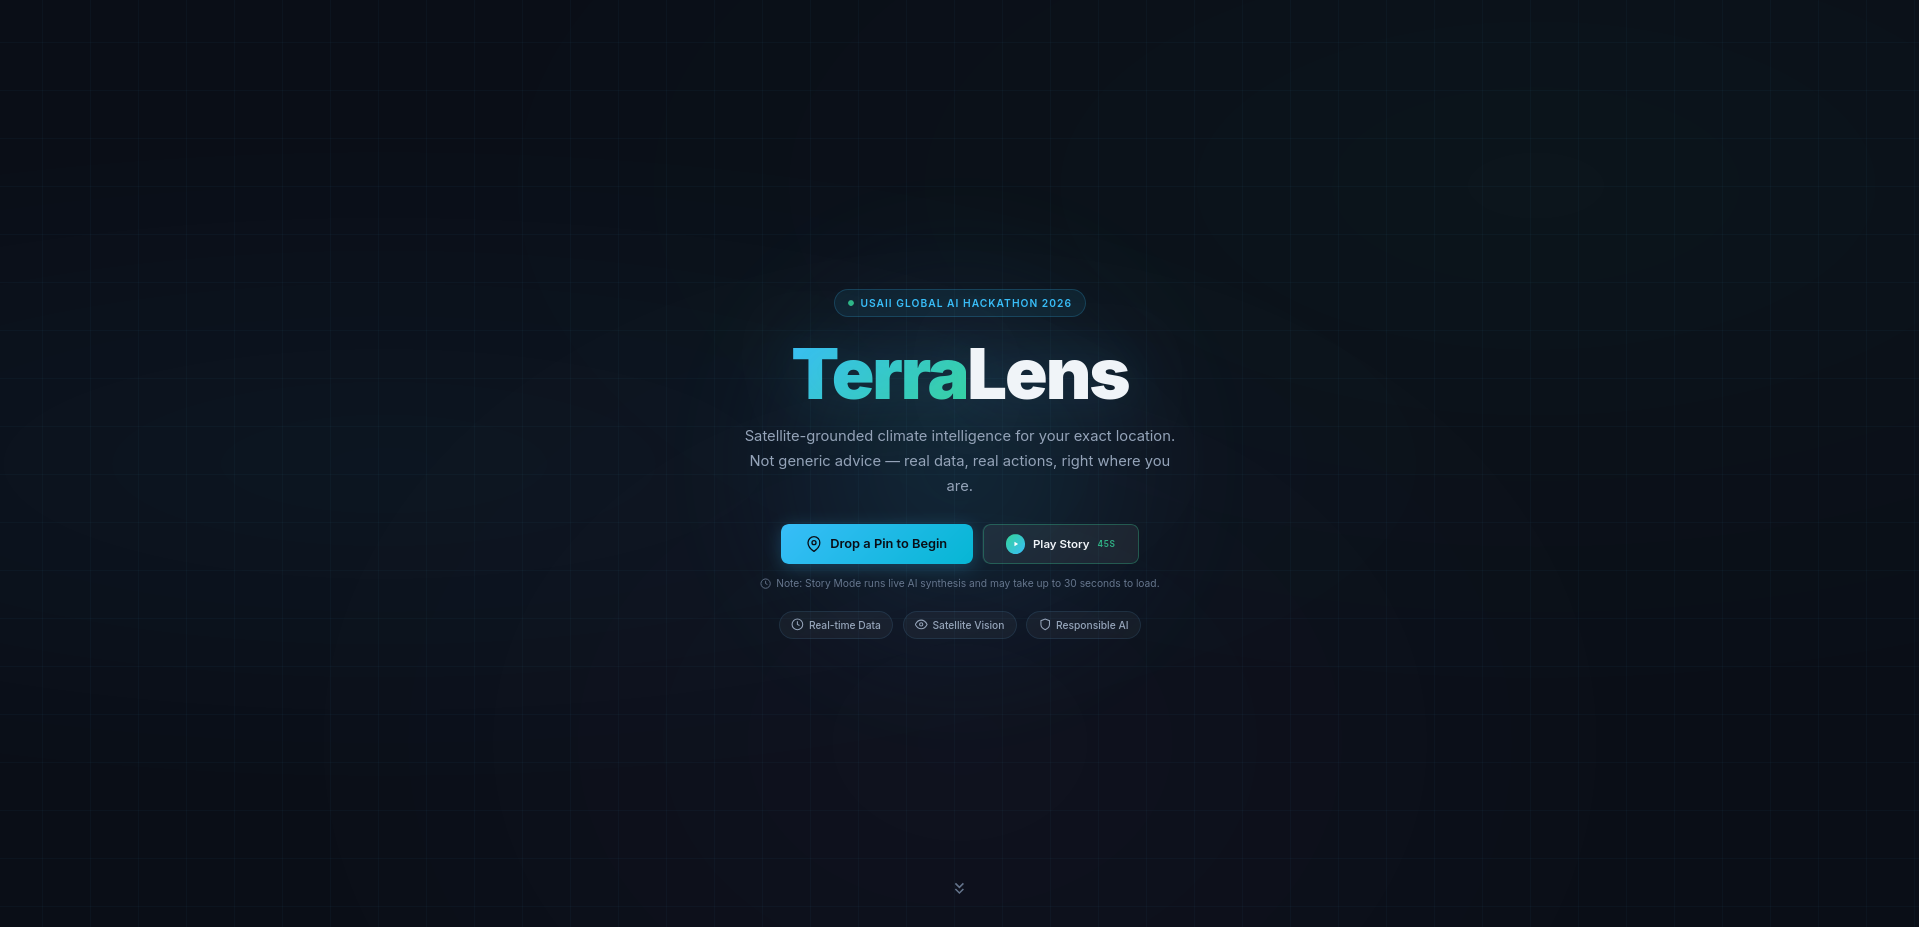
TerraLens is a robust, interactive, location-based environmental intelligence application. It acts as a hyper-local decision-support assistant for communities, students, and local policymakers.
From a user perspective, the experience is designed to be completely seamless, immersive, and immediately impactful:
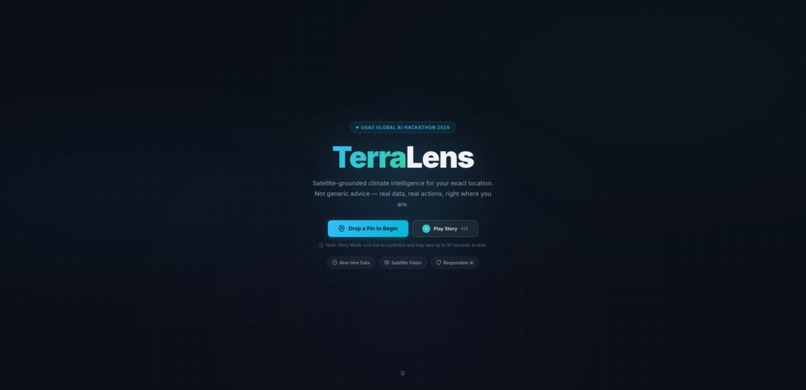
- Interactive Mapping: The user is greeted by a beautiful, responsive, and intuitive web interface powered by Leaflet.js. They are prompted to drop a pin anywhere on the global map—representing their home, their school, or their city.
- Customizable Radius: The user selects an area of interest using a radius slider, defining a strict boundary anywhere between 5 kilometers and 50 kilometers.
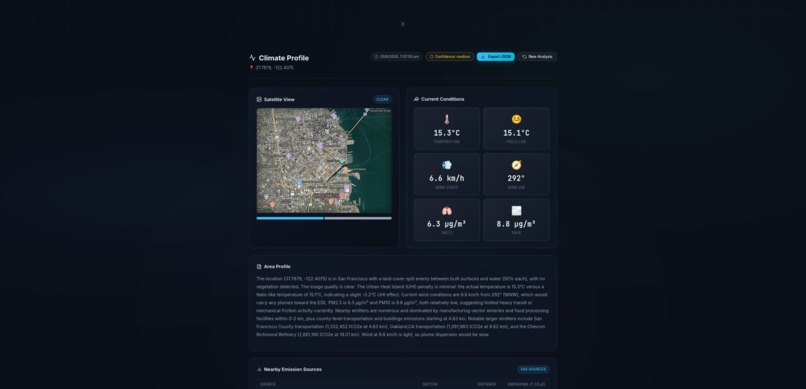
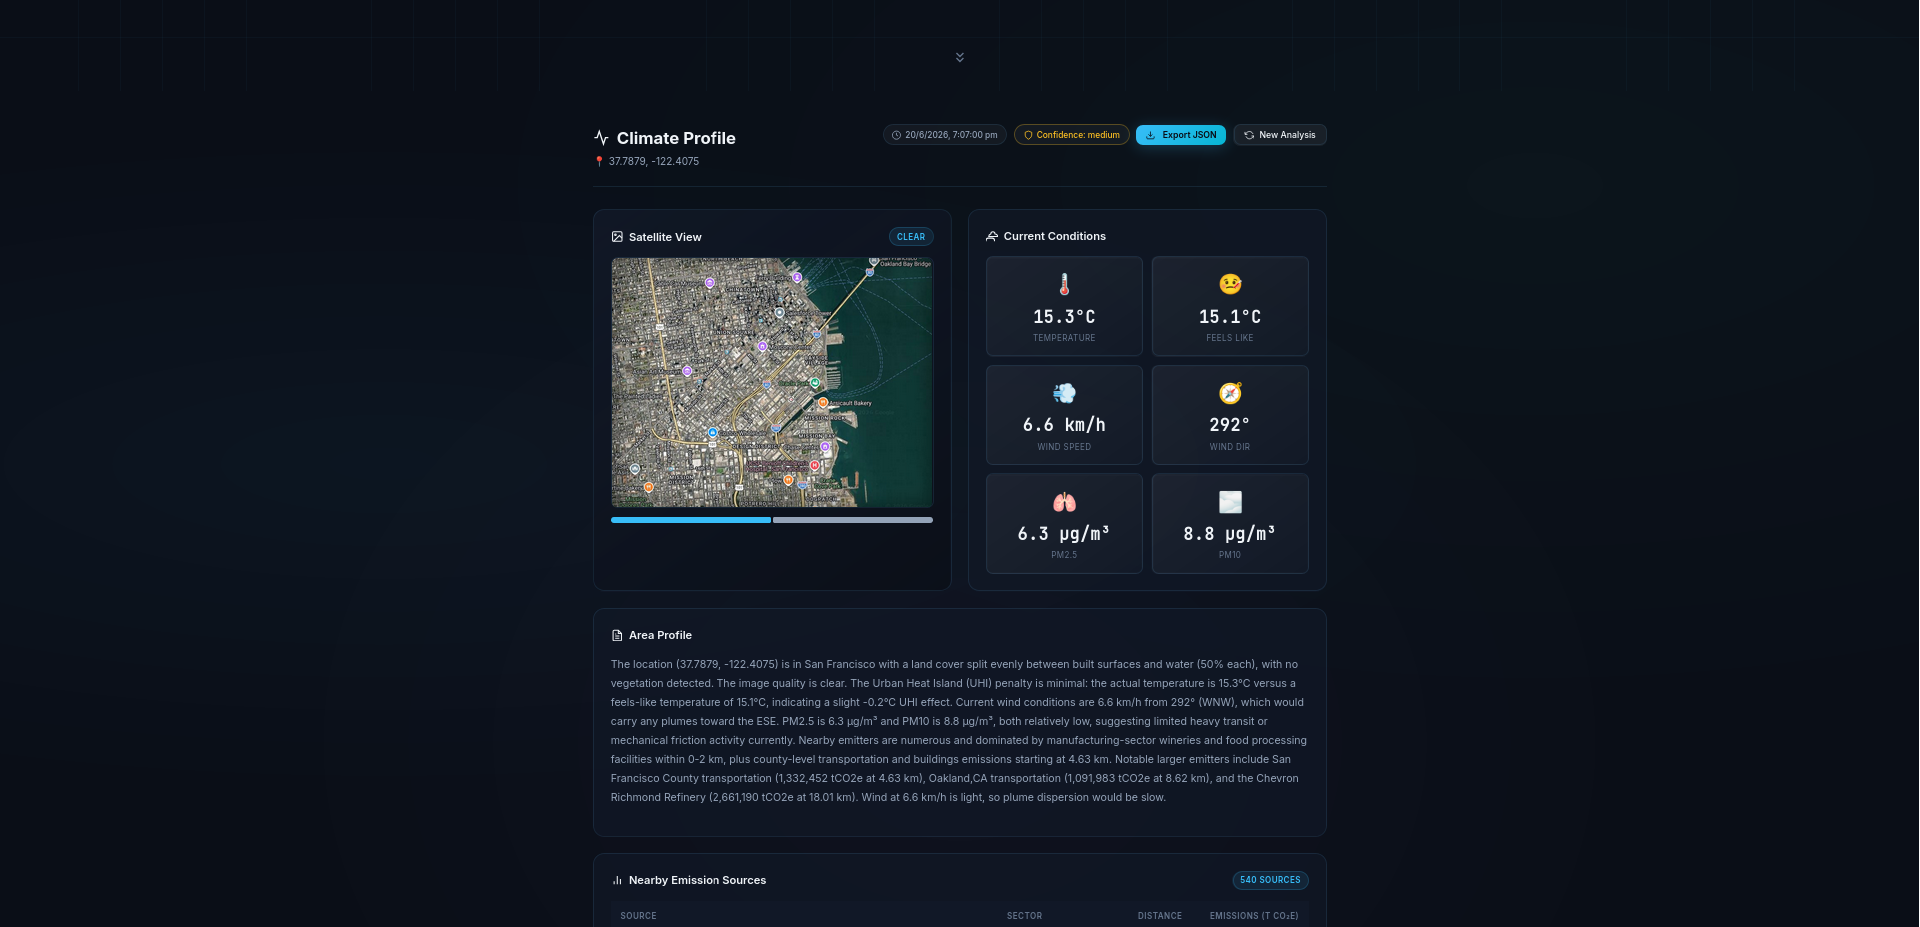
- The Data Synthesis (The Magic): Upon clicking "Analyze Area," the application goes to work. It doesn't just pull one data point; it concurrently aggregates massive amounts of environmental data. It pulls real-time weather conditions, localized pollution metrics, a satellite snapshot of the physical terrain, and a comprehensive list of heavy greenhouse gas emitters located strictly within that drawn radius.
- Streaming Insights: Within seconds, the UI transforms into an immersive "Story Mode." Using an asynchronous backend, TerraLens streams the AI's analysis live to the screen, providing a dynamic and engaging experience.
- The Area Profile: The system generates a comprehensive narrative detailing the exact environmental realities of the defined location. It explains the relationship between the physical land cover (e.g., heavy concrete vs. dense vegetation), the current atmospheric conditions, and the presence of any nearby polluting infrastructure.
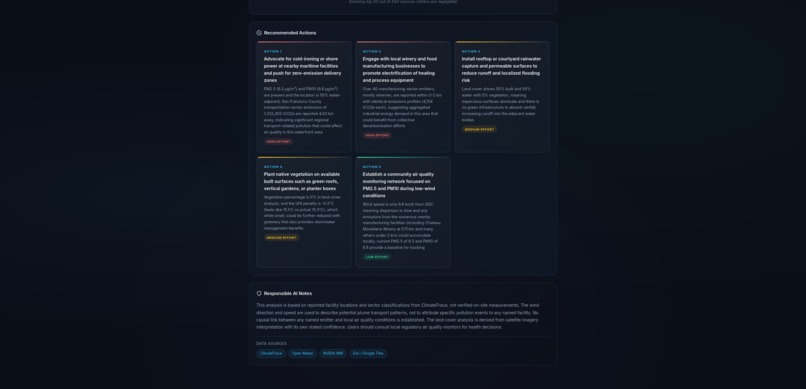
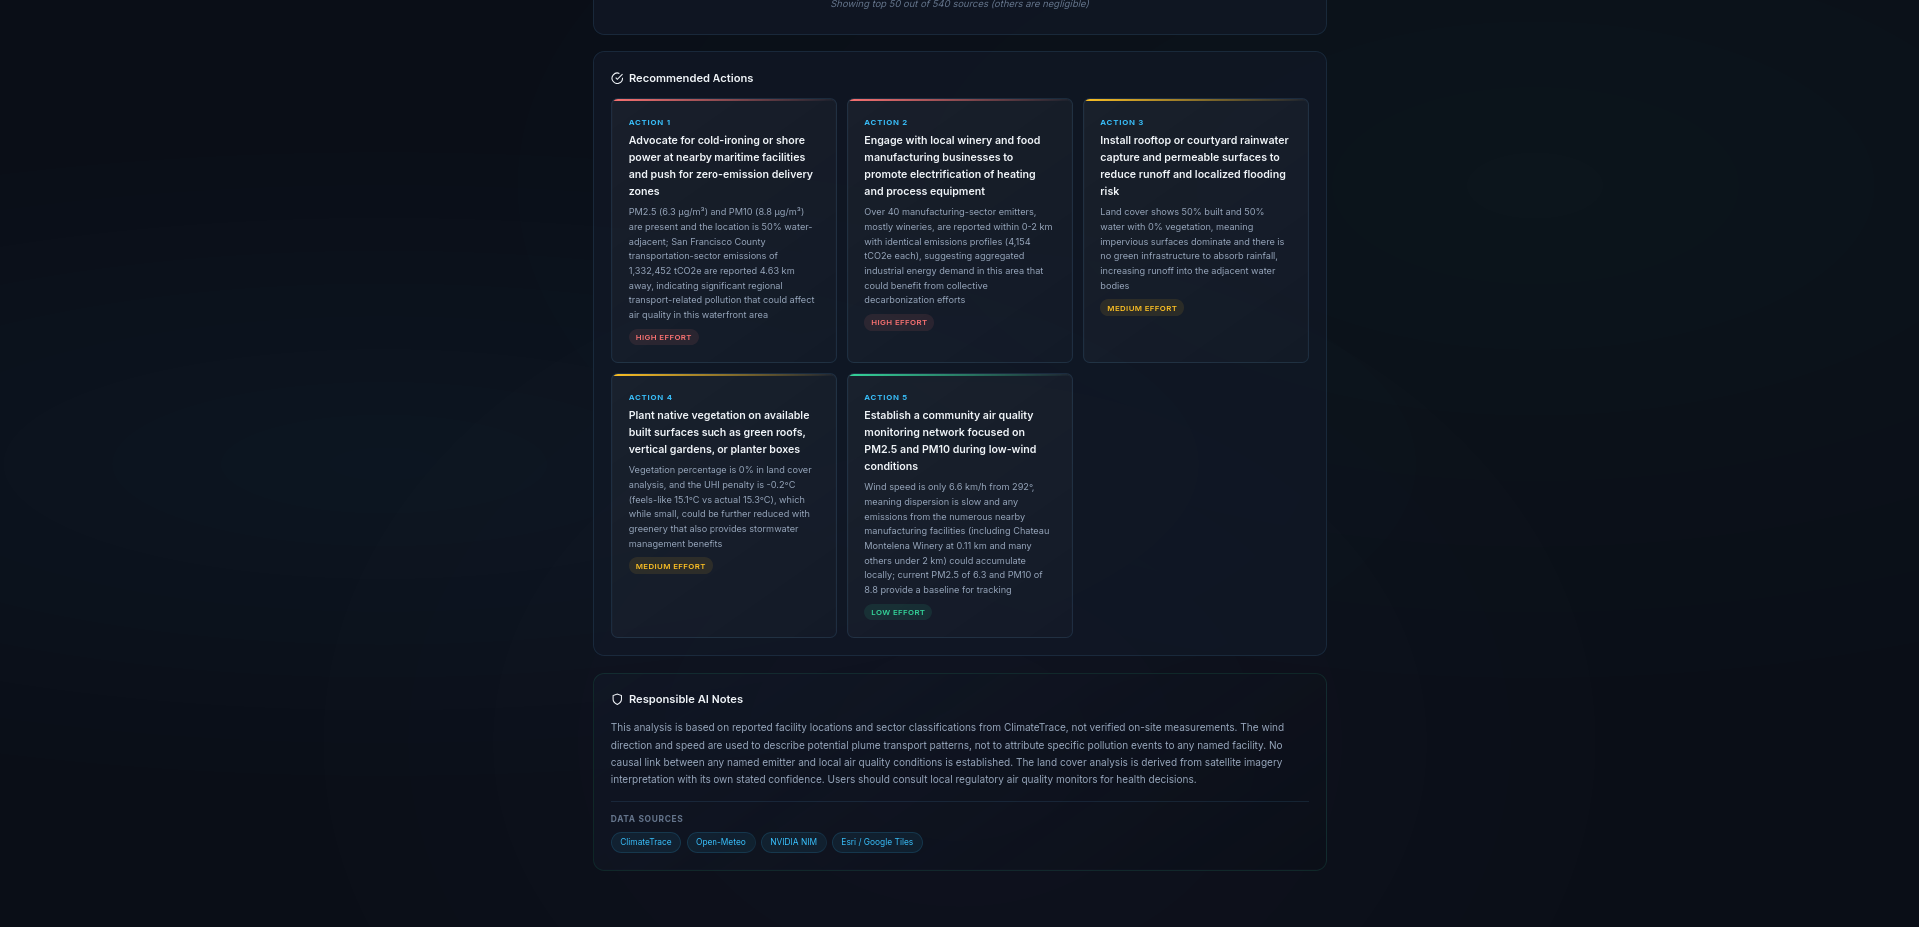
- Actionable, Ranked Recommendations: Most importantly, TerraLens generates the "Top 5 Actionable Recommendations." These are not generic tips. They are highly specific, grounded entirely in the local data, and sorted meticulously by effort level (from High Effort community organization to Low Effort individual actions).
- Data Export: Because community action requires evidence, users can click a single button to export their entire analysis—including the raw data of local emitters and AI insights—as a structured JSON file to share with local councils or environmental clubs.
🏗️ How we built it: The 5-Stage Orchestration Pipeline
To achieve this level of hyper-localized intelligence, we had to engineer a highly complex, high-performance backend. We built the core application using FastAPI (Python 3.11) to handle the intense asynchronous workloads.
We designed a robust "5-Stage Architecture Pipeline" that operates sequentially and concurrently to guarantee speed and accuracy:
Stage A: Geographic Coordinate Capture & Validation The pipeline begins on the frontend. When the user interacts with the Leaflet map, precise latitude, longitude, and radius constraints are securely transmitted to our FastAPI
/api/analyzeendpoint. We utilized Pydantic for strict schema validation to ensure the coordinates are geographically valid before triggering any expensive API calls.Stage B: Satellite Tile Fetching & Dynamic Image Stitching We needed the AI to "see" the environment. Instead of relying solely on text data, we implemented a Slippy Map tile algorithm.
- The backend mathematically converts the user's exact lat/lon into X/Y tile coordinates at a high zoom level (Zoom Level 14/15).
- It asynchronously fetches a 3x3 grid of satellite imagery tiles (using high-resolution Hybrid routing, falling back to Esri imagery if necessary).
- Using the Pillow (PIL) library, the backend stitches these 9 disparate tiles together in memory into a single, cohesive, high-resolution composite image representing the user's immediate physical surroundings.
Stage C: Concurrent Multi-Source Data Ingestion While the image is being stitched, the system maximizes efficiency using Python's asyncio to parallelize data gathering from two massive external sources:
- Open-Meteo API: We ping this service for real-time, hyper-local meteorological data. We pull down temperature, apparent temperature, wind speed, wind direction, and critical air quality metrics like PM2.5 and PM10 to identify Urban Heat Island effects and pollution vectors.
- ClimateTrace V7 API: This is where the local accountability comes in. We query the global ClimateTrace database for emitting assets. To ensure hyper-locality, we first apply a geographic bounding box filter. Then, we run a precise Haversine Distance calculation on the backend to filter out any emitter that falls even a meter outside of the user's chosen radius.
Stage D: Multi-Modal Vision Analysis (NVIDIA NIM) We take the dynamically stitched satellite composite, encode it in base64, and transmit it to an advanced Vision Language Model. We utilized
Llama-3.2-90B-Vision-Instruct, accessed seamlessly via the NVIDIA NIM API.- We engineered a strict prompt instructing the vision model to act as a geographical surveyor.
- It analyzes the image for concrete density, vegetation health, water proximity, and industrial footprints.
- The model returns a structured JSON response detailing the physical vulnerabilities of the terrain (e.g., "High risk of runoff due to 80% impervious surfaces").
Stage E: The Synthesis & Grounding Engine In the final stage, all the gathered intelligence—the Vision Analysis, the Weather/Pollution Data, and the array of ClimateTrace Emitters—are bundled into a massive context window.
- We pass this to a high-tier reasoning LLM (using
moonshotai/kimi-k2.6with fallbacks togpt-oss). - Responsible AI Prompting: We applied rigorous "System Prompting" to prevent hallucinations. The LLM is strictly instructed: It may only reference emitters that exist in the provided data. It cannot invent solutions.
- The model synthesizes the raw data, applies logic (e.g., checking wind direction against emitter locations to determine pollution drift), and streams the formatted, actionable markdown directly back to the frontend UI via Server-Sent Events (SSE).
- We pass this to a high-tier reasoning LLM (using
🚧 Challenges we ran into
Building a multi-modal, asynchronous pipeline under the pressure of a hackathon presented several immense technical and design challenges:
Managing Asynchronous Race Conditions: Our architecture requires pulling data from three different sources simultaneously (Satellite imagery, Open-Meteo, ClimateTrace) before feeding it to the AI. Initially, we faced timeout issues and race conditions where the LLM would attempt to synthesize data before the image stitching was complete. We had to deeply refactor our FastAPI backend using
asyncio.gatherto ensure all coroutines resolved perfectly before the final payload was assembled.Vision Model Hallucinations and Scale Context: Early in development, the Vision Model (Llama 3.2 Vision) would look at the stitched satellite image and occasionally misinterpret the scale, confusing a large parking lot for a barren desert, or hallucinating industrial complexes that weren't there. Solution: We solved this through intense Prompt Engineering. We forced the vision model to output its analysis in strict JSON and gave it the exact radius context. More importantly, we instituted a Responsible AI Guardrail: we explicitly coded the Synthesis LLM to trust the hard data (ClimateTrace/Meteo) over the Vision Model if there was a contradiction regarding infrastructure.
Strict Geographic Filtering (The Haversine Problem): The ClimateTrace API returns data in large bounding boxes. When a user selects a 5km radius, a bounding box might return emitters 7km away in the corners. We had to write custom Python logic utilizing the Haversine formula to calculate the exact spherical distance of every single returned emitter from the user's central pin, ruthlessly stripping out anything that didn't strictly belong in their local community.
UI/UX Streaming Latency: Waiting 15 seconds for a massive AI synthesis payload to load creates a poor user experience. To fix this, we implemented asynchronous Server-Sent Events (SSE) so the user could watch the AI "think" and type out the analysis in real-time, greatly improving perceived performance and engagement.
🏆 Accomplishments that we're proud of
- A Truly Working, Deployed Prototype: We didn't just build a Figma mockup or a slide deck. TerraLens is a fully functioning, production-ready web application currently live on Hugging Face Spaces. It handles real concurrent users, real API calls, and real AI inference.
- Seamless Multi-Modal Integration: We are incredibly proud of successfully orchestrating multiple differing technologies—mapping libraries, geospatial math, multi-modal vision models, and reasoning LLMs—into a single, cohesive, 5-stage pipeline that runs in seconds.
- Responsible AI by Design: We adhered strictly to the USAII ethics guidelines. We are proud of our strict data-bounding. TerraLens will not lie to a user about local polluters; it is algorithmically locked to only cite verified ClimateTrace data. Furthermore, we designed the system to respect privacy—no location data is ever saved to a database post-analysis.
- The "Effort-Sorted" Algorithm: By forcing the AI to sort recommendations from "High Effort" (community lobbying) to "Low Effort" (individual habits), we created a tool that respects the user's capacity, making climate action accessible to a high schooler and a city planner alike.
🧠 What we learned
This hackathon was an intense, accelerated masterclass in modern software architecture and applied artificial intelligence.
- The Power of Constrained AI: We learned that Large Language Models are infinitely more powerful when you constrain them. Giving an LLM open-ended access to the internet results in generic advice. Forcing an LLM to only synthesize a highly specific, pre-filtered local data bundle results in breathtakingly accurate and actionable intelligence.
- Geospatial Mathematics: We drastically improved our understanding of GIS (Geographic Information Systems). Learning how to convert latitude and longitude into Web Mercator projection tiles, stitch them together, and calculate spherical distances over the curvature of the earth (Haversine) was a massive technical leap for our team.
- Asynchronous Python: We learned the intricacies of FastAPI, Uvicorn, and Python's asyncio library. We learned how to prevent thread-blocking when making external HTTP requests, which is critical for scalable web applications.
- The Nuance of "AI for Good": We learned that building "AI for Good" isn't just about picking a good topic; it's about responsible design. It requires actively designing guardrails to ensure the AI doesn't induce panic or spread misinformation about local environments.
🚀 What's next for TerraLens
The USAII Global AI Hackathon is just the beginning for TerraLens. We believe this hyper-local approach is the future of environmental advocacy. Moving forward, we plan to implement:
- Temporal Analysis (Time-Travel Mode): We want to integrate historical satellite data so users can use the slider to see how their local environment's land cover (like deforestation or urban sprawl) has changed over the last 10 years, allowing the AI to predict future vulnerabilities.
- Community Crowdsourcing: We aim to add a feature where local users can upload ground-level photos (e.g., a polluted local river) to be analyzed by the vision model and appended to the local Area Profile, merging satellite top-down data with grassroots bottom-up data.
- Direct Civic Integration: Our goal is to format the "Export Data" JSON feature into automated, legally formatted PDF briefs that high school students and community organizers can print out and hand directly to their local city councils or zoning boards.
- Gamification and Leaderboards: To encourage youth engagement, we want to introduce a localized point system where schools or neighborhoods can track the implementation of the "Top 5 Actions" and see measurable reductions in their localized carbon footprint.
TerraLens proves that we don't need to look at the entire globe to fight climate change. We just need the right lens to look at our own backyards.
Built With
- asyncio
- climatetrace-api
- css3
- fastapi
- html5
- huggingface
- javascript
- leaflet.js
- llama-3
- nvidia-nim
- open-meto-api
- pillow
- python


Log in or sign up for Devpost to join the conversation.