-
-
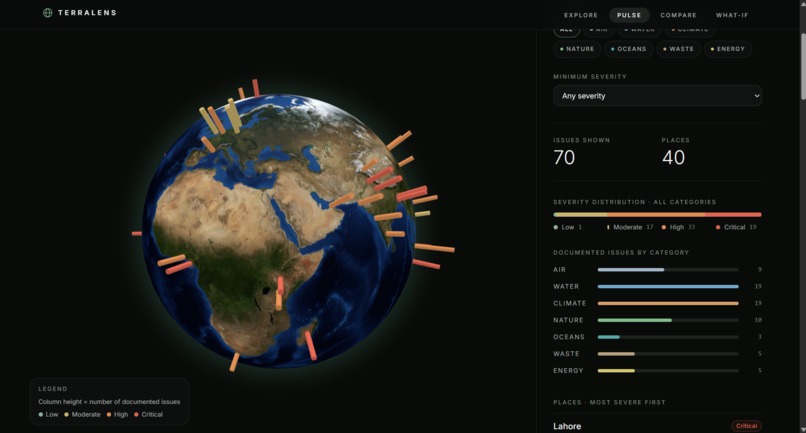
TerraLense Pulse feature
-
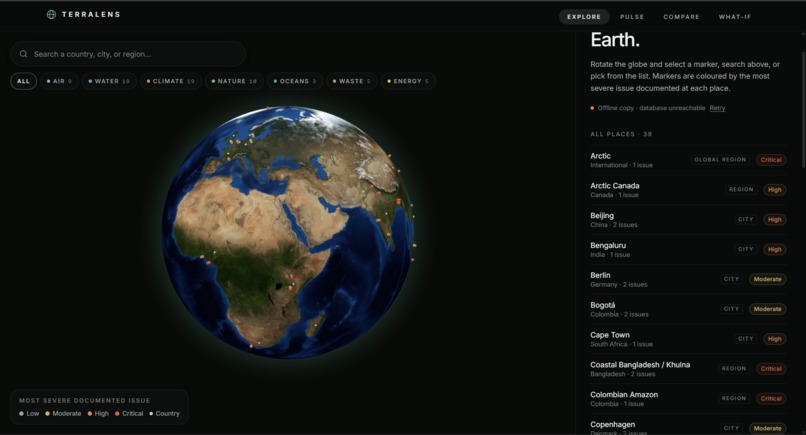
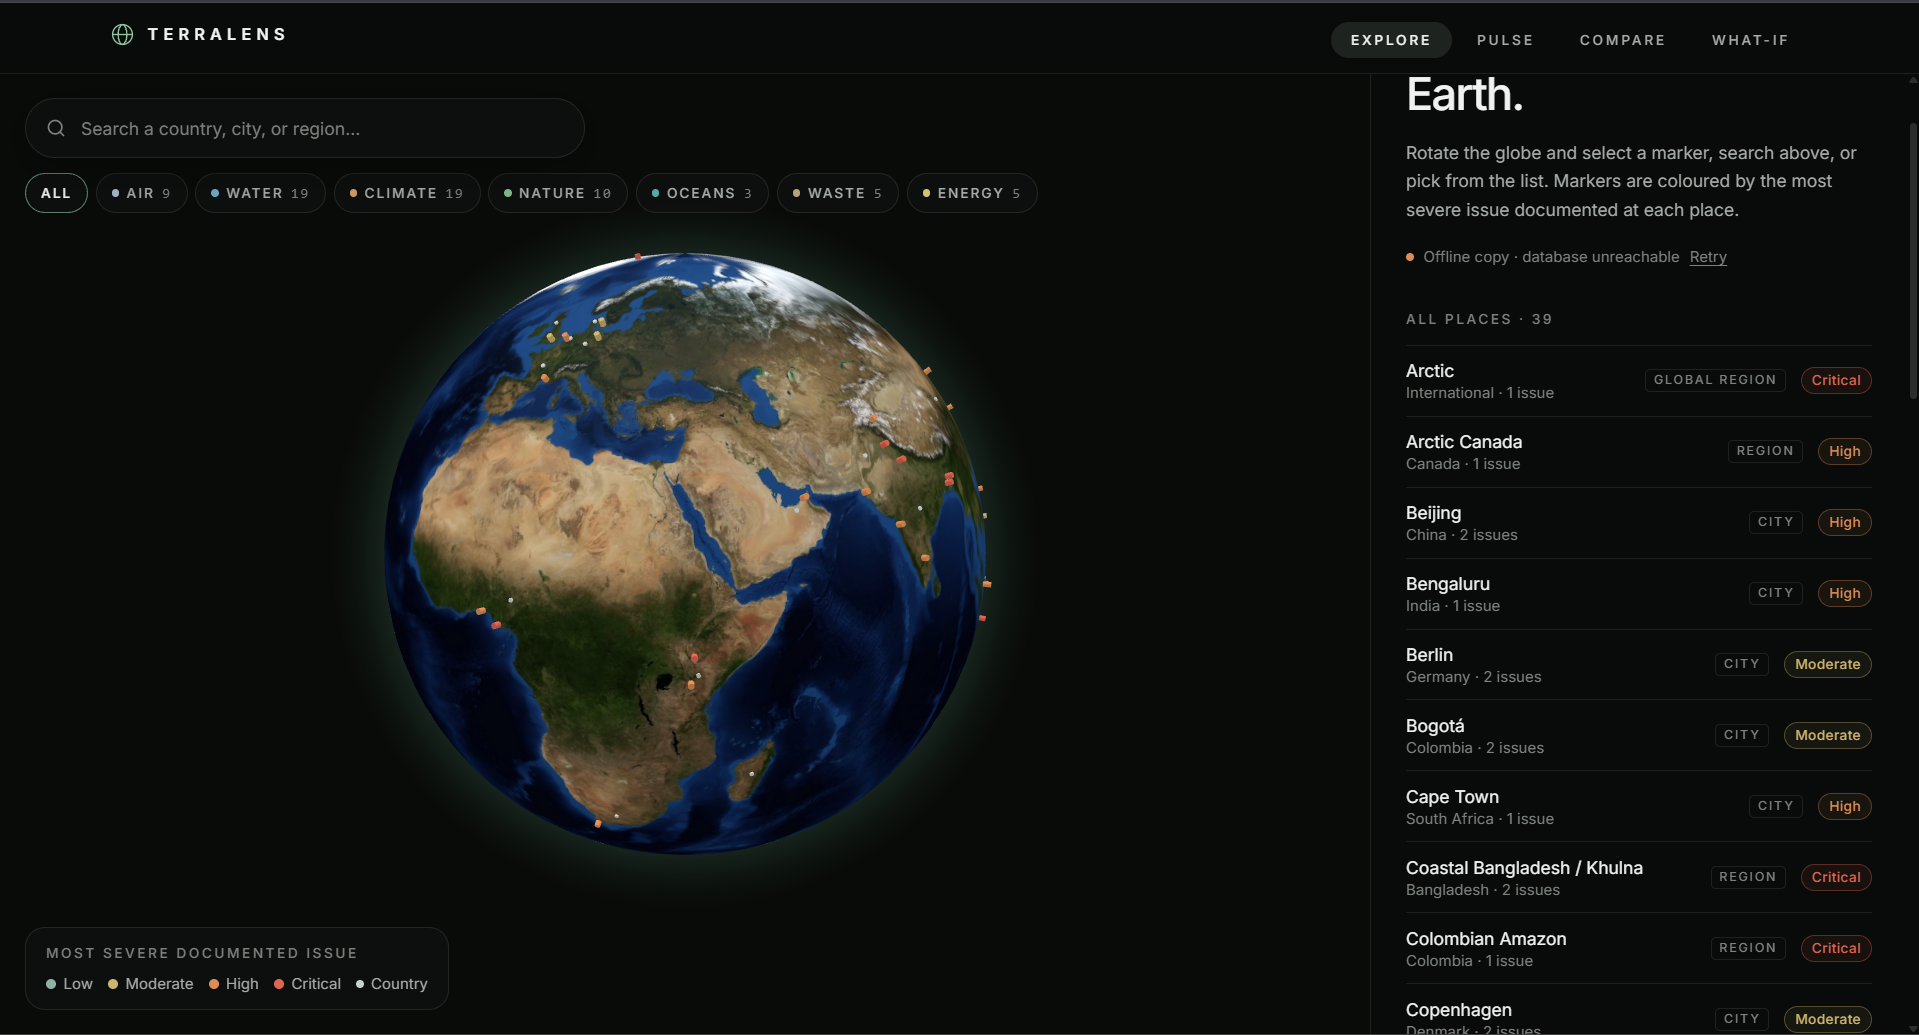
TerraLens explore Earth page
-
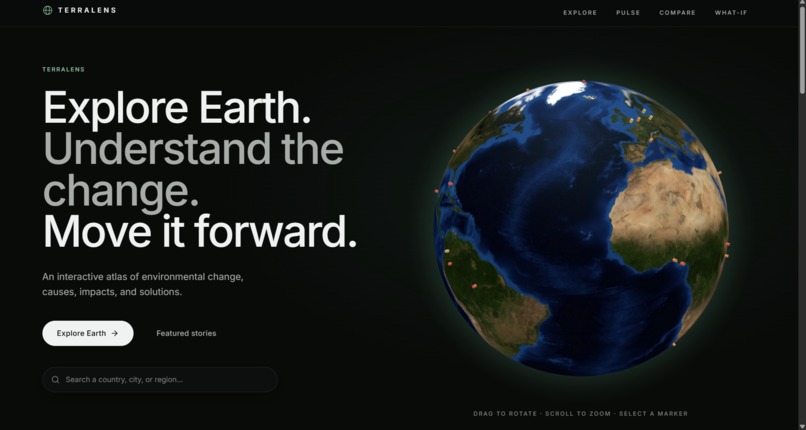
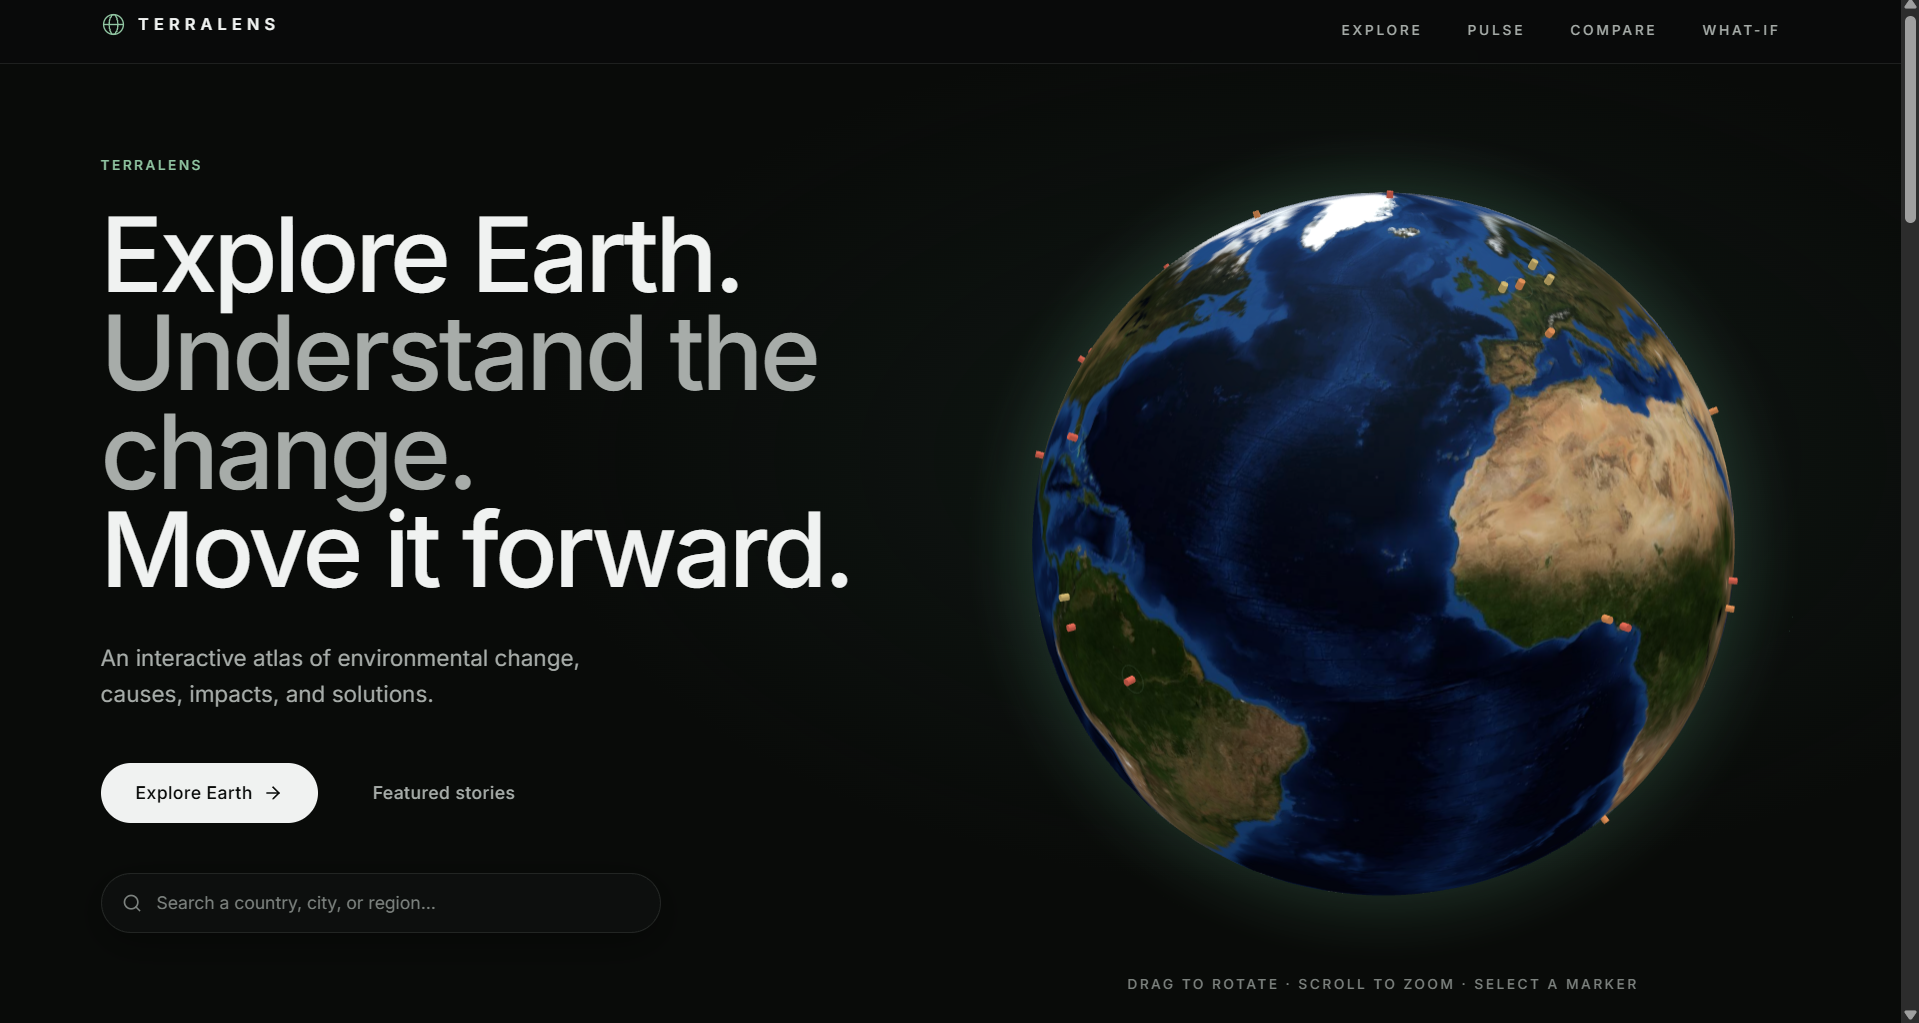
TerraLens homepage
Inspiration
Environmental problems are often presented as disconnected statistics, reports, and headlines. We wanted to create a way to explore that information geographically — to see where problems are happening, understand why they are happening, and explore what can be done.
That idea became TerraLens Atlas: an interactive environmental platform built around the idea that understanding environmental change should be as intuitive as exploring a map.
What it does
TerraLens Atlas lets users explore documented environmental challenges around the world through an interactive 3D globe.
Users can:
- 🌍 Explore environmental issues by location.
- 🔎 Search and investigate specific places.
- 📌 View the causes, impacts, interventions, and sources behind individual issues.
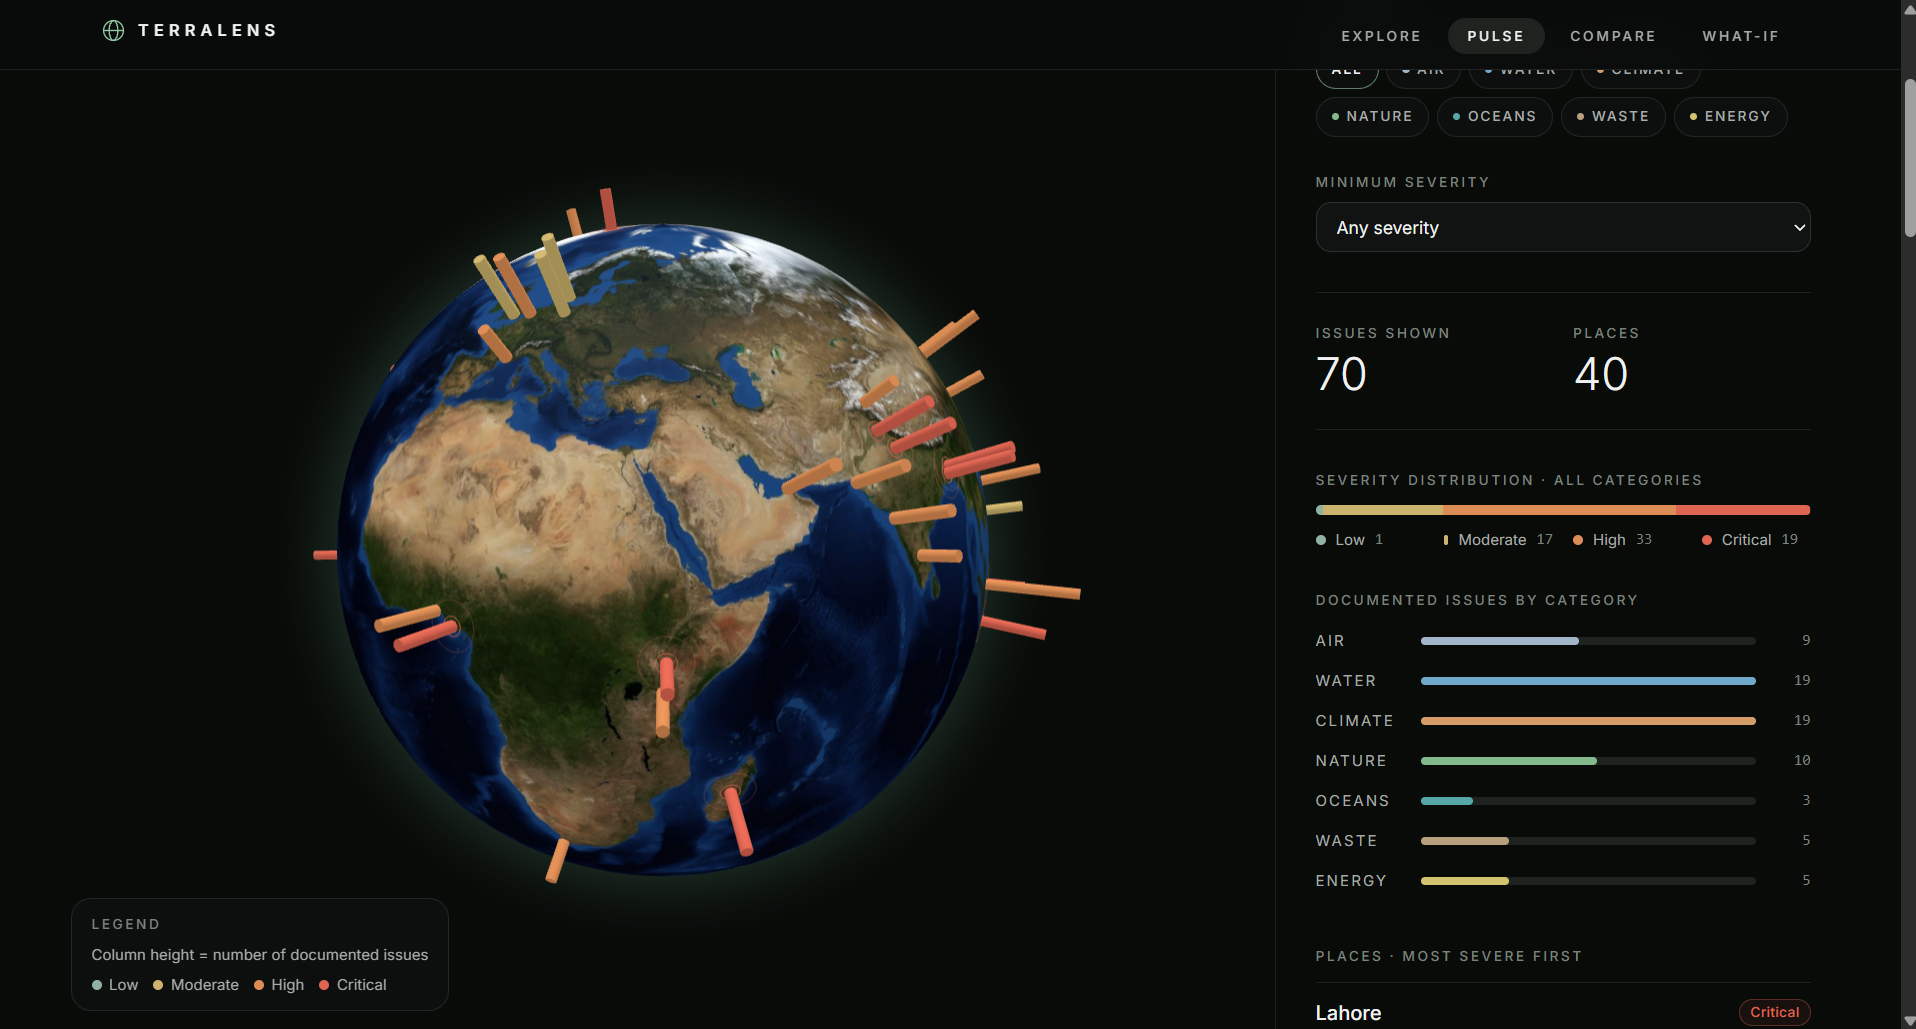
- 📊 Use Pulse to explore broader environmental patterns.
- ⚖️ Use Compare to examine documented issues across locations.
- 💡 Use What-If to explore illustrative intervention scenarios based on documented approaches.
- 🌱 Explore environmental lenses including Air, Water, Climate, Nature, Oceans, Waste, and Energy.
The goal is to turn complex environmental information into something visual, understandable, and actionable.
How we built it
We built TerraLens Atlas as a modern web application using React, TypeScript, TanStack Start, Vite, Tailwind CSS, shadcn/ui, and Supabase.
The core experience is built around an interactive 3D globe connected to structured environmental issue data. Each issue is organized into consistent components such as its causes, impacts, potential interventions, and supporting sources.
We focused on creating an experience that feels more like exploring Earth than navigating a traditional environmental dashboard.
Challenges we ran into
One of our biggest challenges was balancing depth with simplicity. Environmental issues can involve large amounts of information, but we wanted users to understand an issue quickly without being overwhelmed.
We also had to structure environmental information consistently across different locations while preserving the unique context of each issue.
Building an interactive globe introduced additional challenges around performance, responsive layouts, and making geographic exploration intuitive.
Accomplishments that we're proud of
We are proud of turning a large and complex topic into a single interactive experience.
A user can start with a global view, zoom into a specific location, investigate an environmental issue, understand its causes and impacts, compare it with another location, and explore an intervention scenario — all within the same platform.
We are also proud of the visual experience and the emphasis on connecting issues to documented sources rather than presenting environmental information as unsupported claims.
What we learned
We learned that building an environmental platform is not just about collecting information — how that information is structured and presented matters just as much.
We learned how to organize diverse environmental data into a consistent structure, build interactive geographic interfaces, design information-dense experiences, and think carefully about communicating scenarios without confusing them with guaranteed predictions.
Most importantly, we learned how much can be accomplished by combining modern web technologies with a clear, user-focused idea.
What's next for TerraLens Atlas
We want TerraLens to grow into a much broader environmental intelligence platform.
Next, we would like to expand geographic coverage, integrate more live environmental datasets, add richer environmental indicators, and develop more advanced analytical and AI-assisted exploration.
We also want to continue improving the What-If experience while maintaining clear source attribution and a strong distinction between documented evidence and exploratory scenarios.
Our long-term goal is simple: help people see environmental problems, understand them, and explore what could change them.

Log in or sign up for Devpost to join the conversation.