-

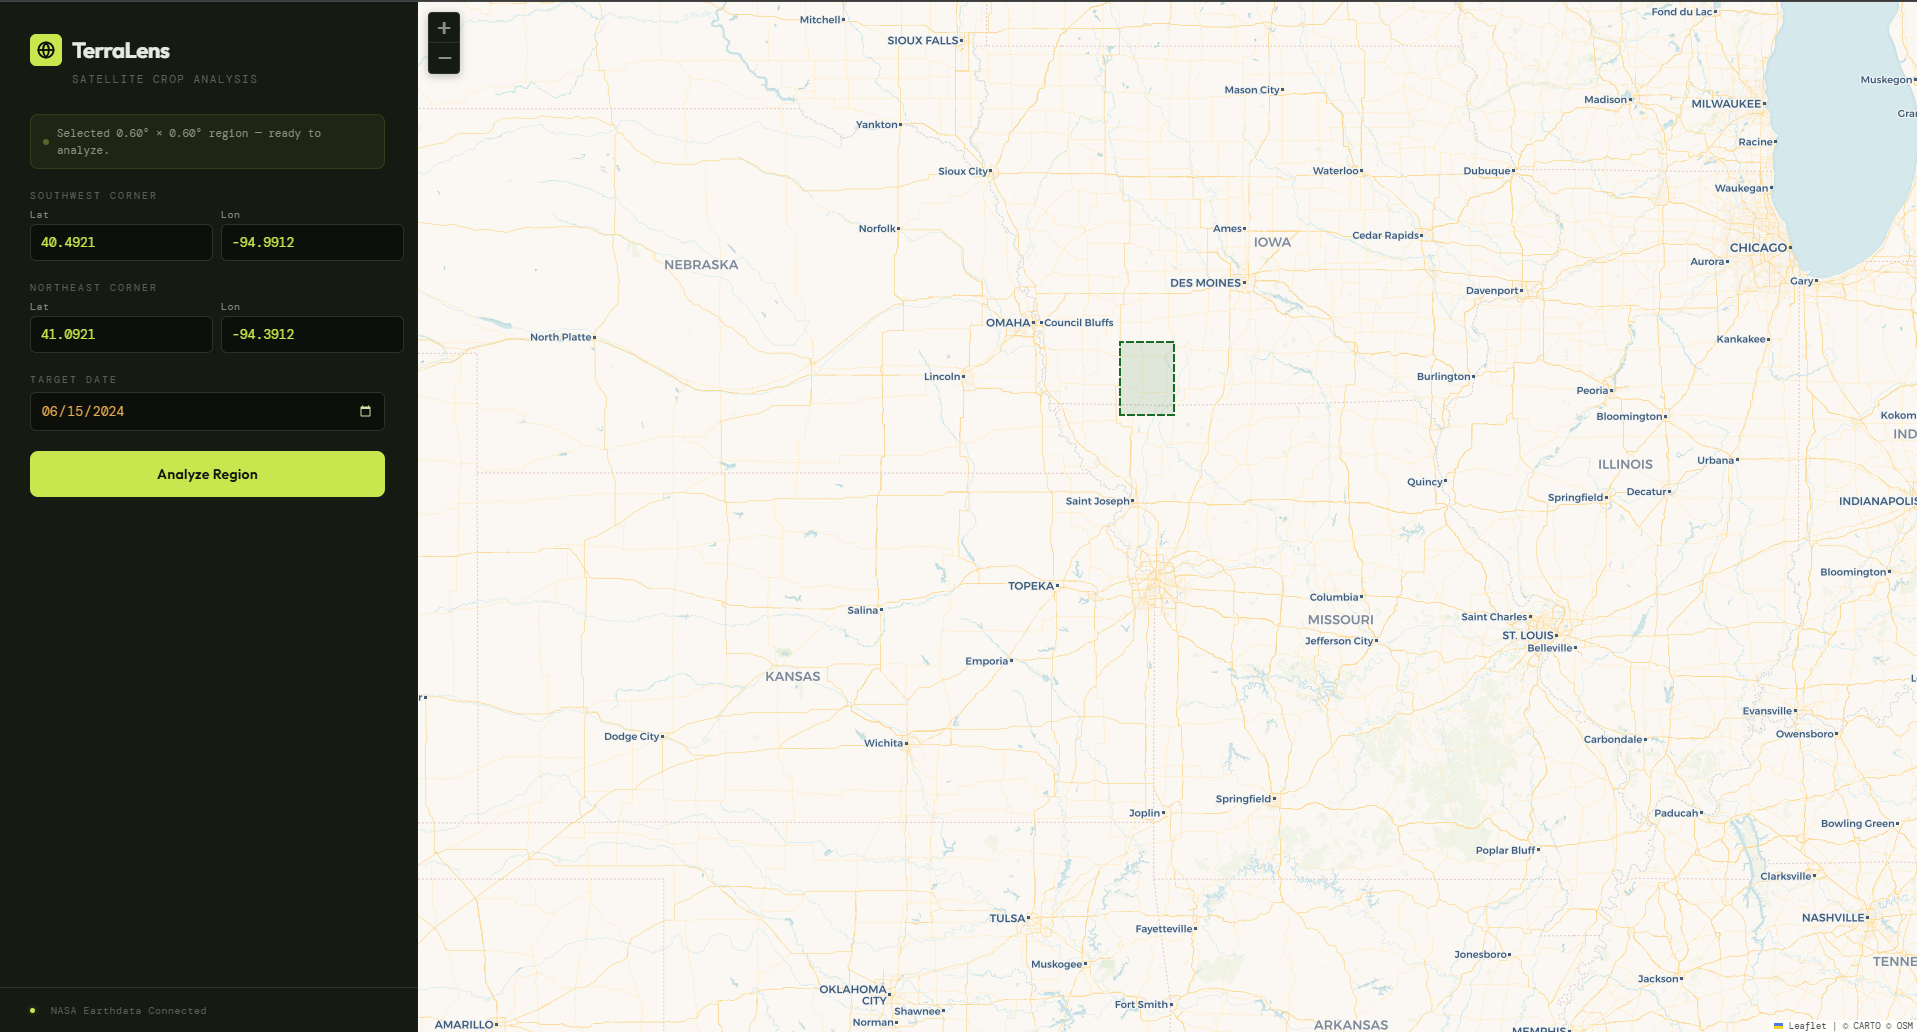
Location selector
-
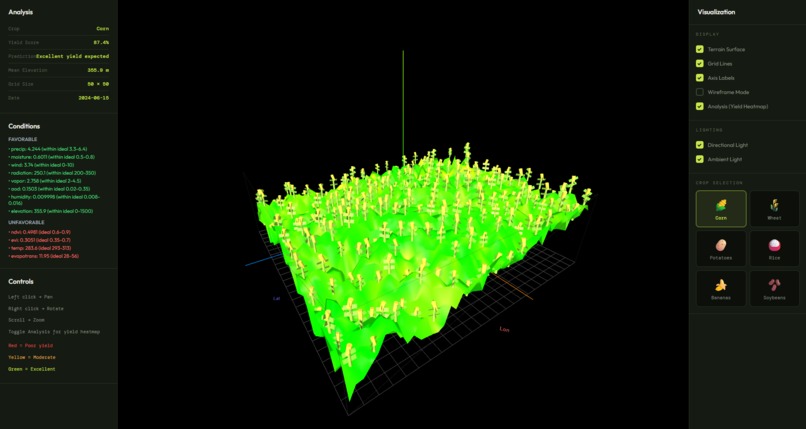
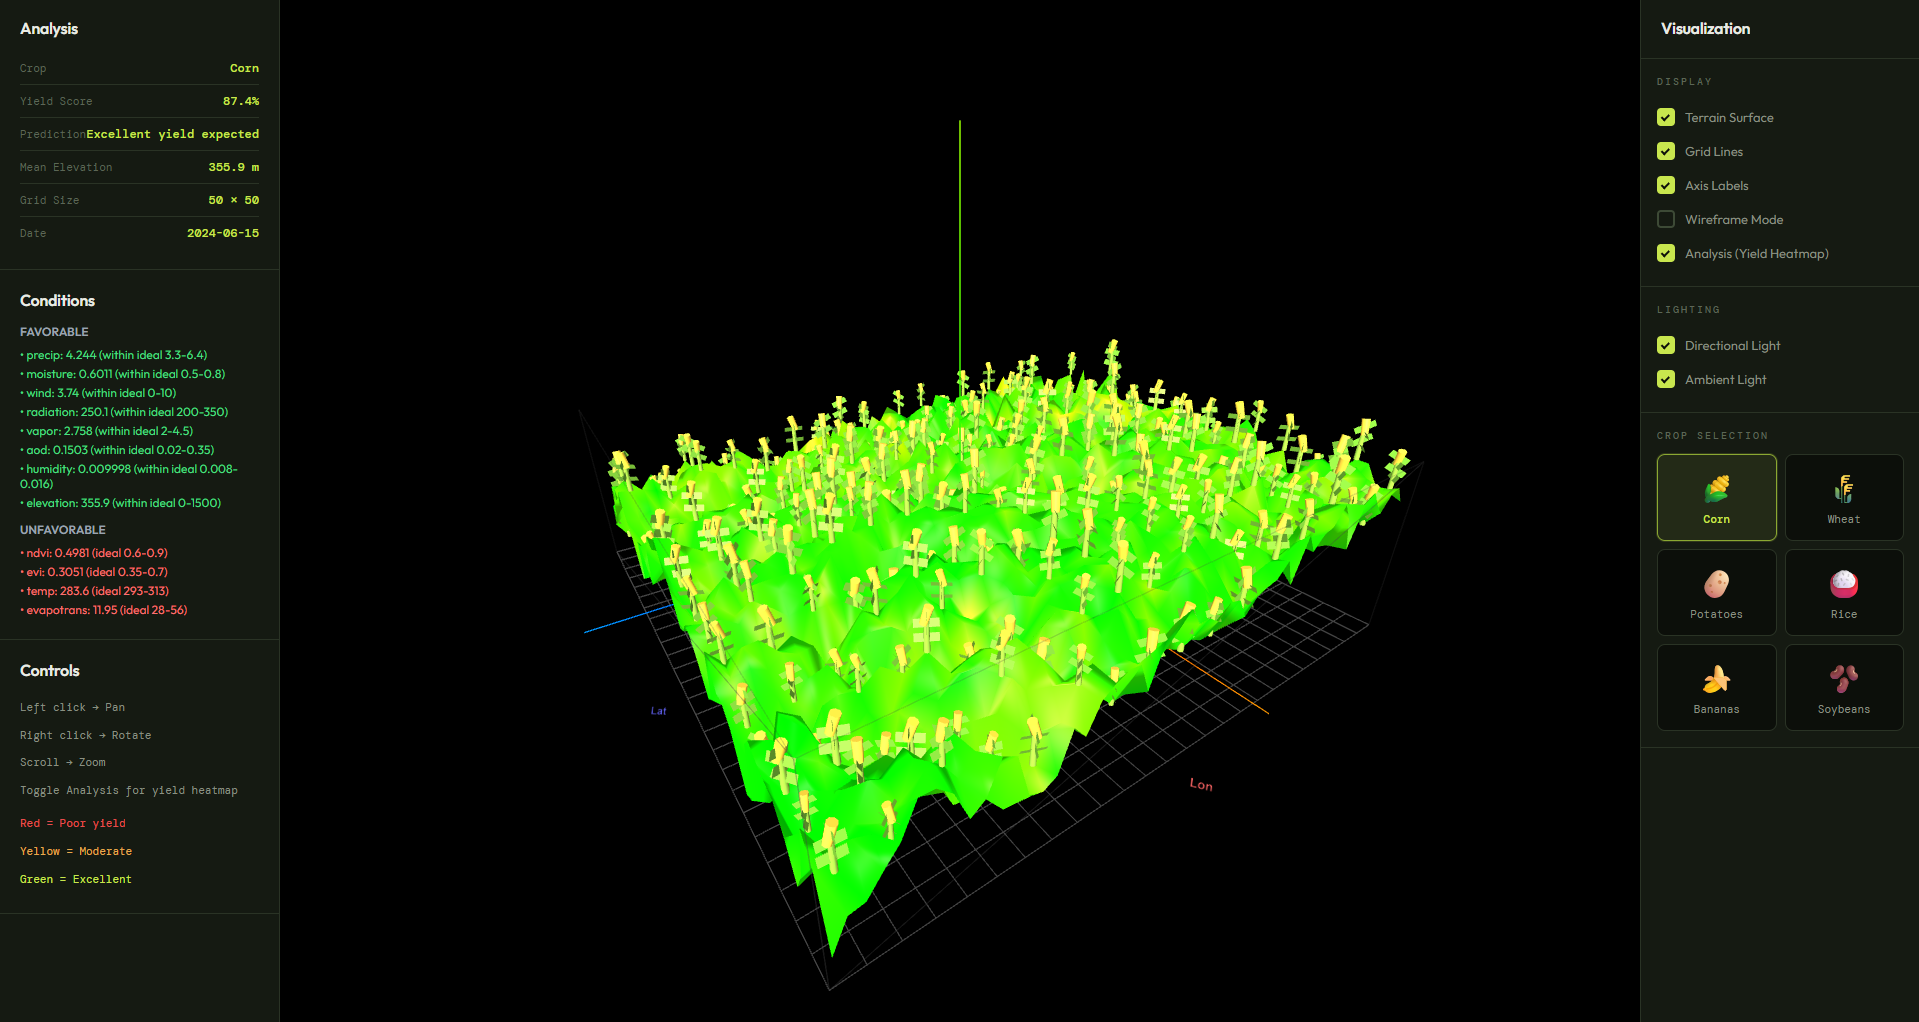
Visual analysis of crop yield for a real farm
-
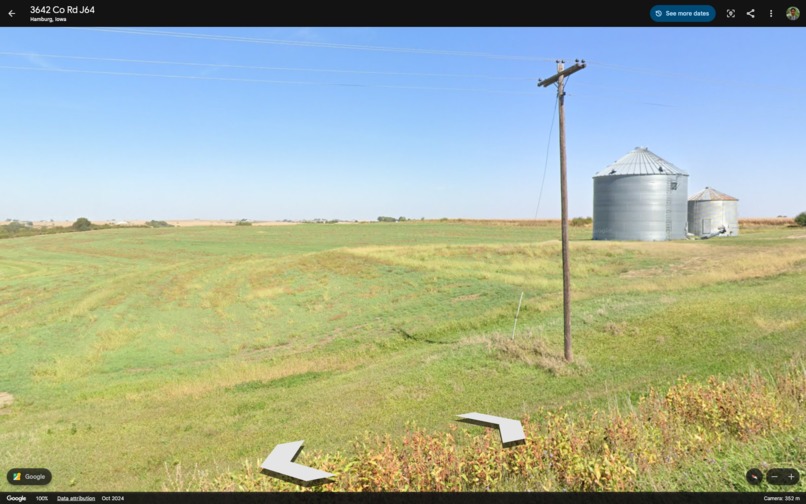
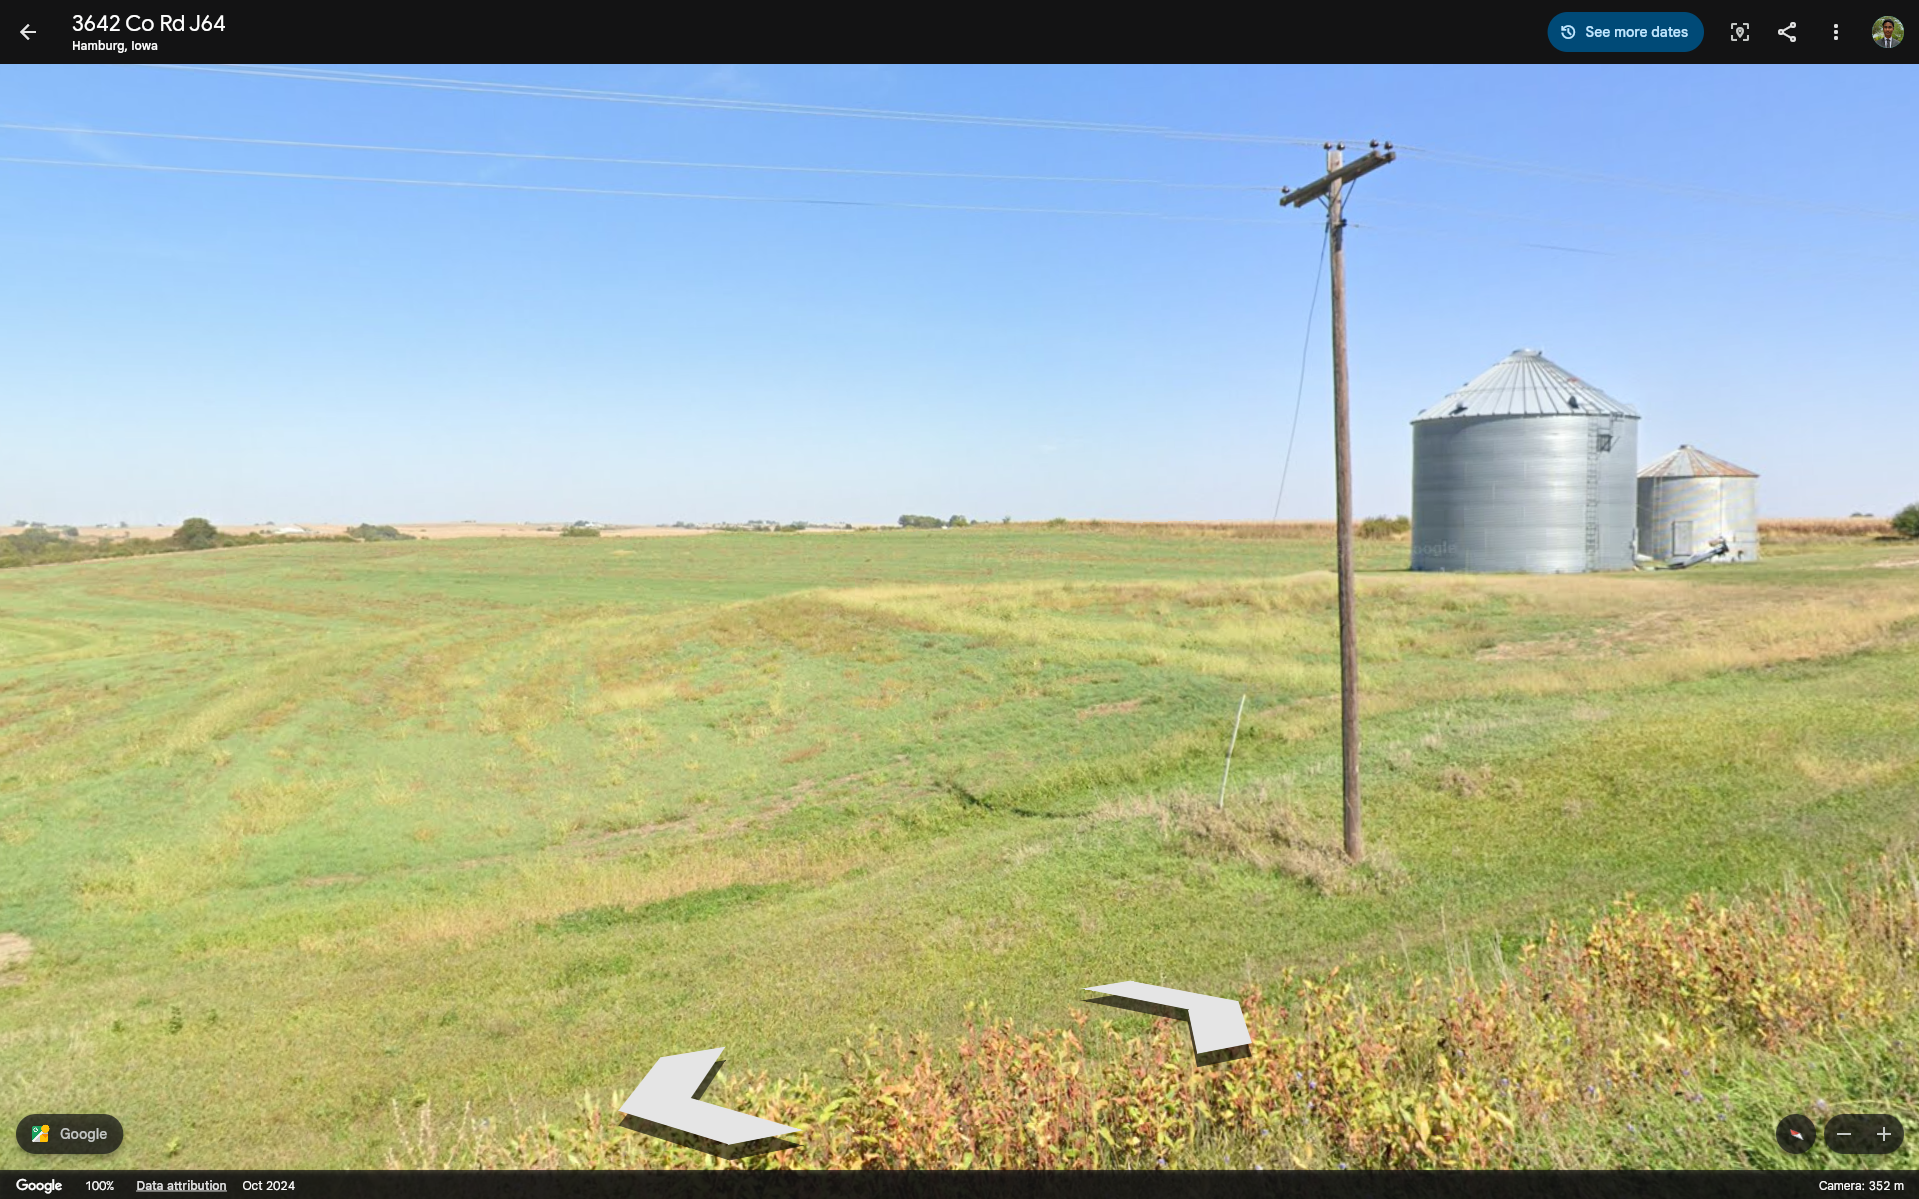
Google Earth street view of the same farm
-
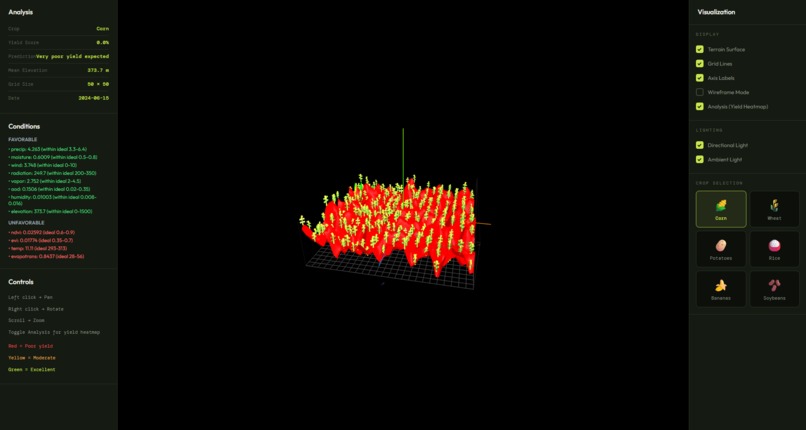
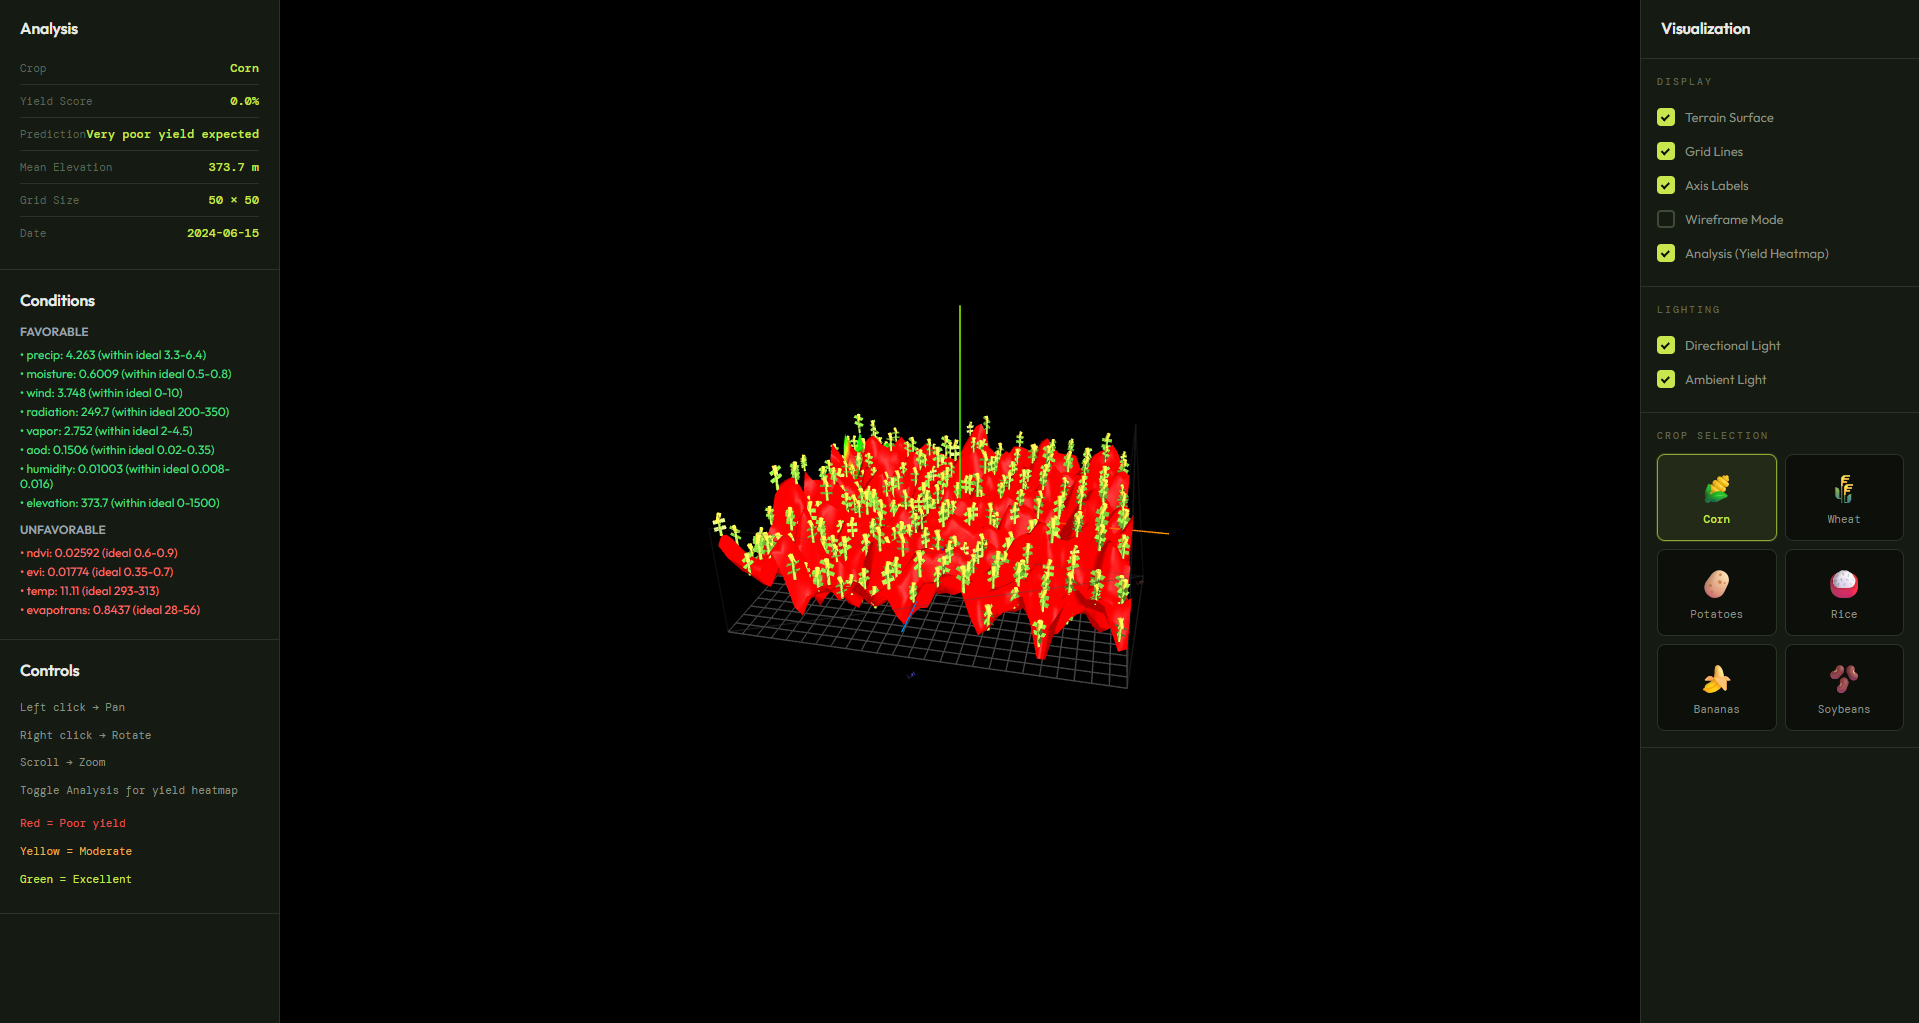
Visual analysis of a region in the ocean
Inspiration
Climate change and food insecurity are putting increasing pressure on farmers to make smarter, data-driven decisions. We were inspired by the idea that the same satellite data NASA uses to study Earth could also be used to help predict crop health and yields at a local level. TerraLens was born from the question: What if anyone could analyze how well a crop might grow in a specific region before planting it?
What it does
TerraLens uses NASA Earthdata satellite imagery to analyze a selected region of Earth and predict how successfully one of six crops—corn, wheat, potatoes, rice, bananas, or soybeans—will grow. It evaluates vegetation indices and environmental variables such as temperature, precipitation, soil moisture, radiation, wind, and elevation, then produces a yield score and qualitative prediction. The results are visualized in 3D, allowing users to see simulated crop health and growth patterns across an area.
How we built it
We built TerraLens with a Python backend that integrates with NASA Earthdata satellite datasets. Environmental variables are extracted and fed into a custom crop yield prediction model that compares real-world conditions against ideal growth ranges for each crop. The model computes a yield score for each location, along with an analysis of favorable and unfavorable conditions.
Challenges we ran into
One major challenge was normalizing and interpreting diverse environmental variables from NASA satellite data while translating raw scientific measurements into meaningful agricultural insights. In addition, moving data between different programs and languages introduced complexity, as we needed a reliable pipeline to transfer analyzed results from the Python backend into formats suitable for Three.js visualization. Ensuring data consistency, performance, and accuracy across large spatial grids required careful data structuring and iteration.
Accomplishments that we're proud of
We’re proud of building a full pipeline—from satellite data ingestion to predictive modeling to real-time 3D visualization. Our crop yield predictor supports multiple crop types with detailed environmental analysis, and our visualization makes complex data intuitive even for non-experts. Seeing satellite data come to life as simulated crop growth was a big win for us.
What we learned
We learned how powerful Earth observation data can be when paired with domain-specific models. The project deepened our understanding of vegetation indices, climate variables, and spatial data analysis, as well as the challenges of turning scientific data into user-friendly visual tools.
What's next for TerraLens
Next, we want to improve model accuracy by incorporating historical yield data and machine learning techniques. We also plan to expand the number of supported crops, add time-based growth predictions, and allow users to compare scenarios under different climate conditions. Ultimately, we hope TerraLens can become a practical decision-support tool for farmers, researchers, and policymakers.


Log in or sign up for Devpost to join the conversation.