-
-
Pic: 4
-
Pic: 3
-
Pic: 2
-
Pic: 6
-
Pic: 1
-
Pic: 5
Inspiration
Every coach says "be unpredictable." But nobody puts a price on it. If an offense makes the call its situation makes obvious, does it actually lose expected points (EPA)? We wanted a straight answer, and we wanted to get it in a way nobody could accuse us of bending to fit.
What it does
Tendency Tax is a pre-registered test plus an interactive app.
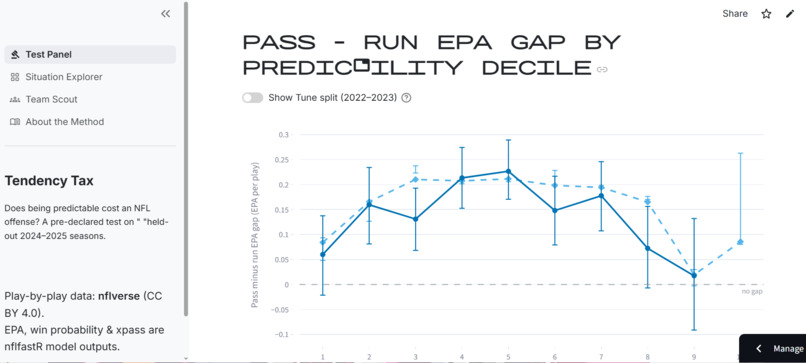
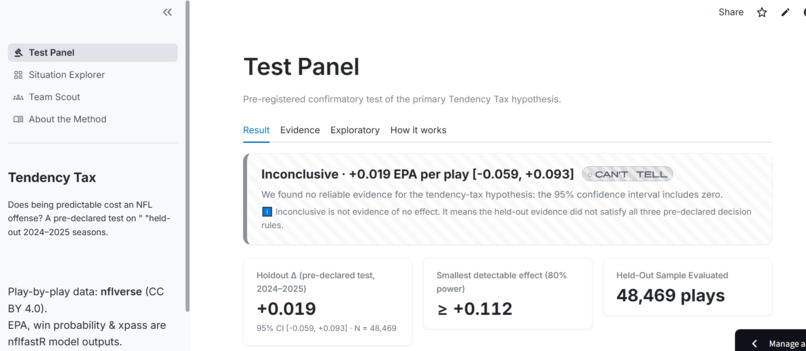
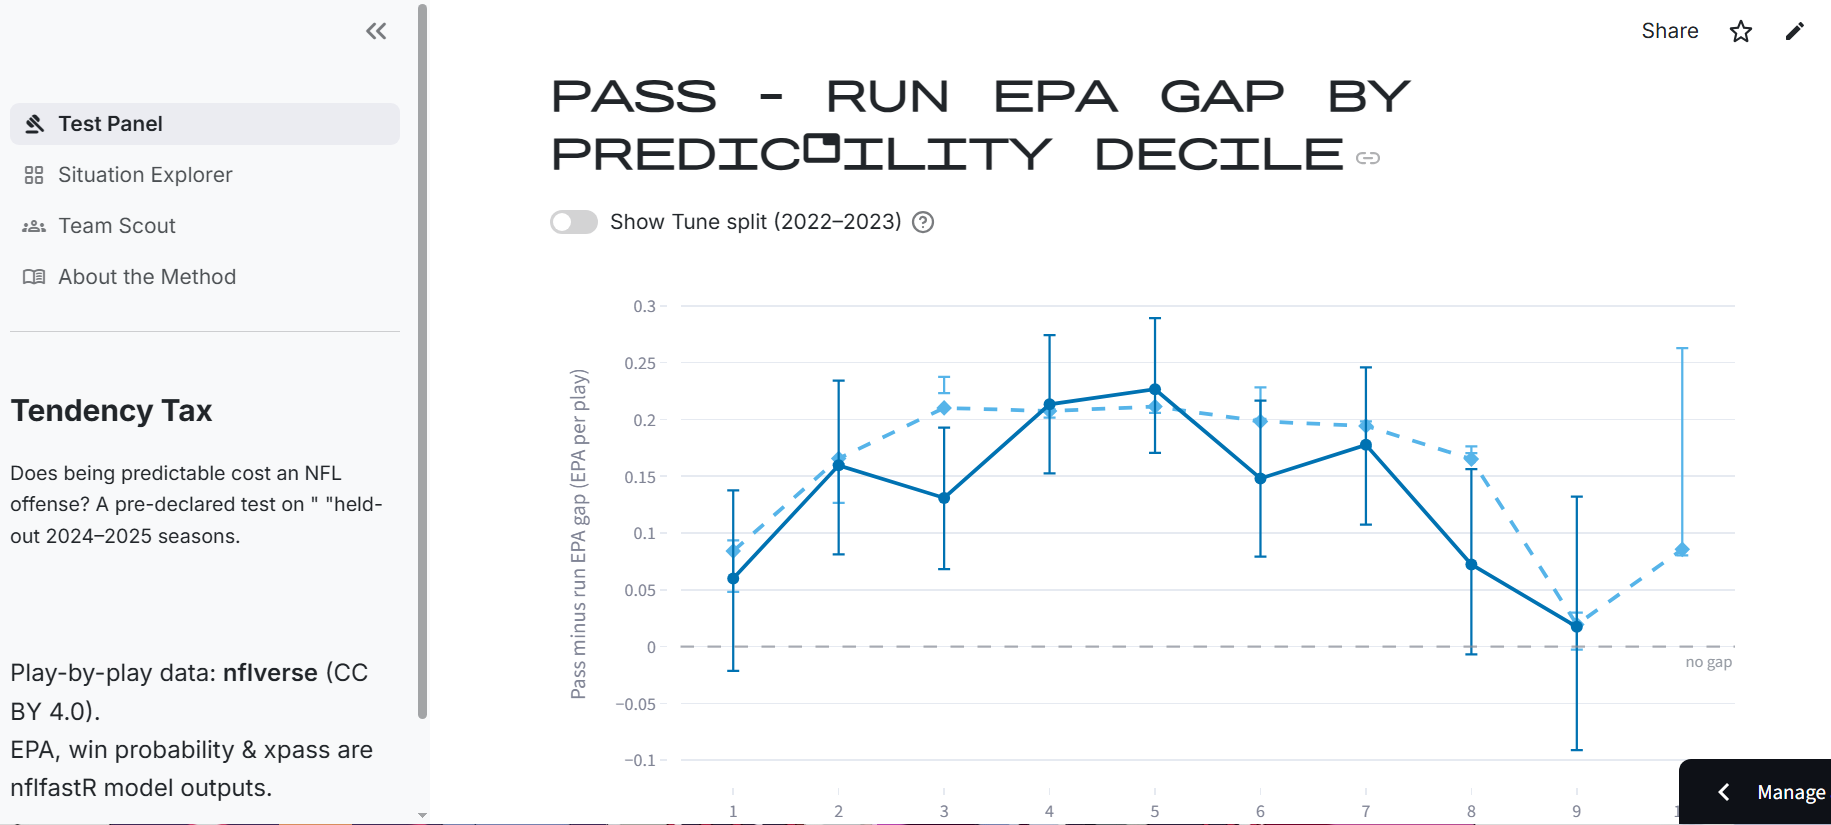
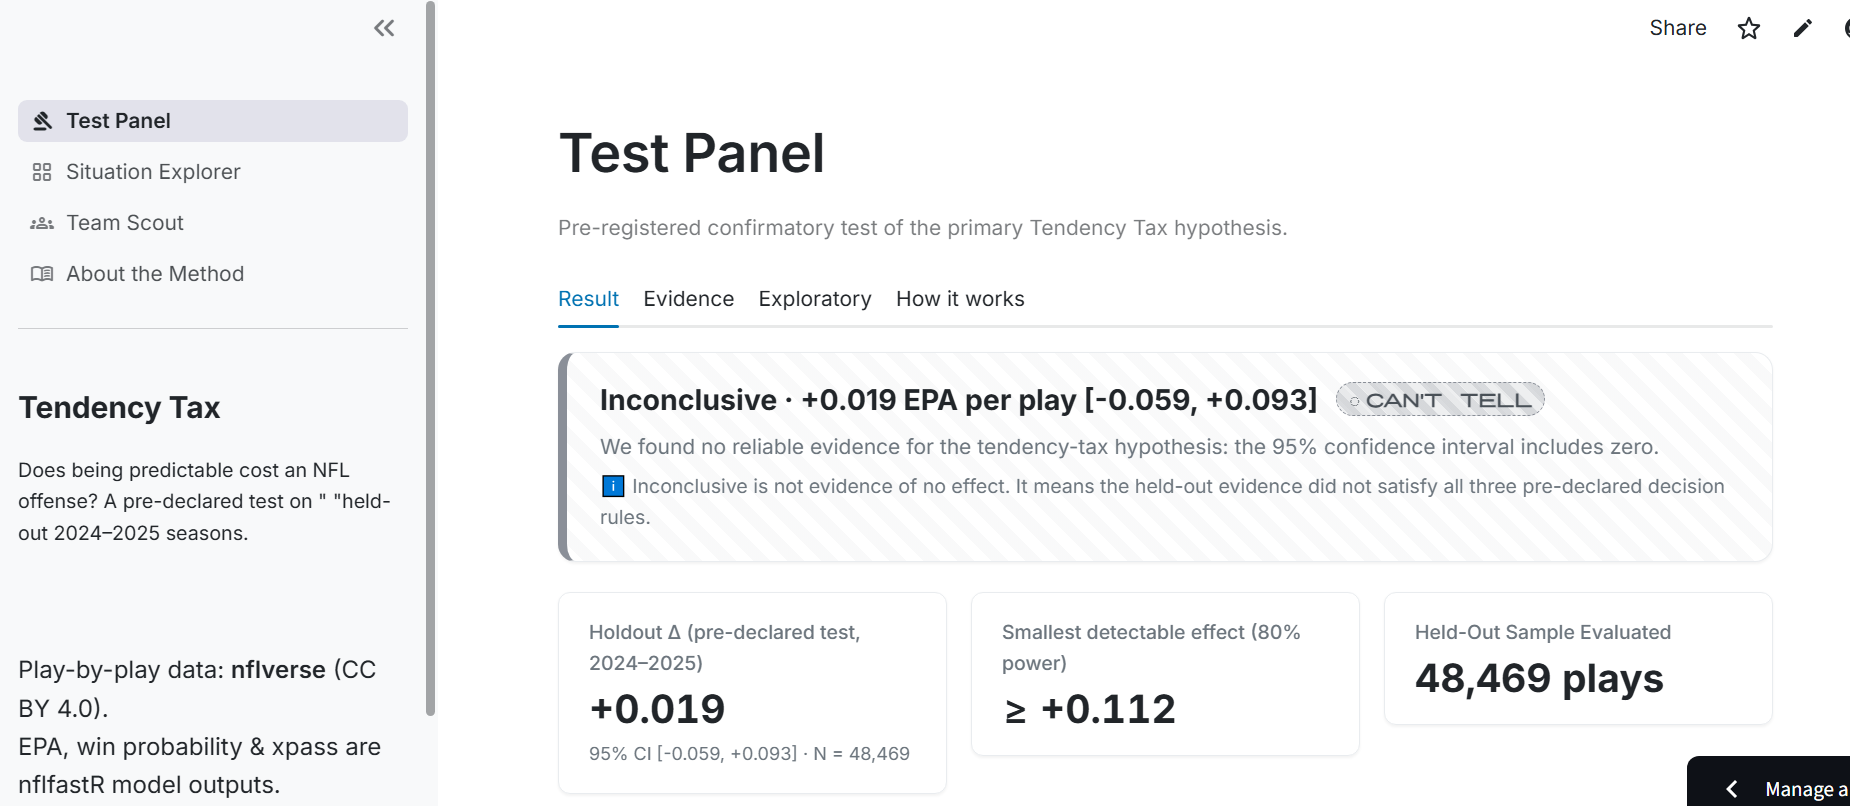
- Test Panel: the verdict first, then the evidence: the estimate with its interval, the three pre-declared conditions, a decile chart, and exploratory checks clearly labeled as such.
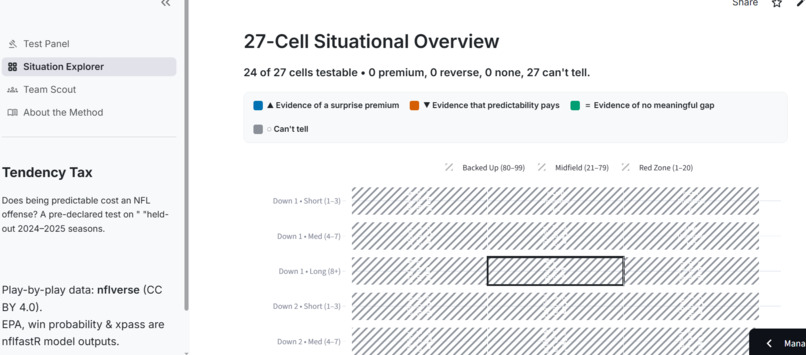
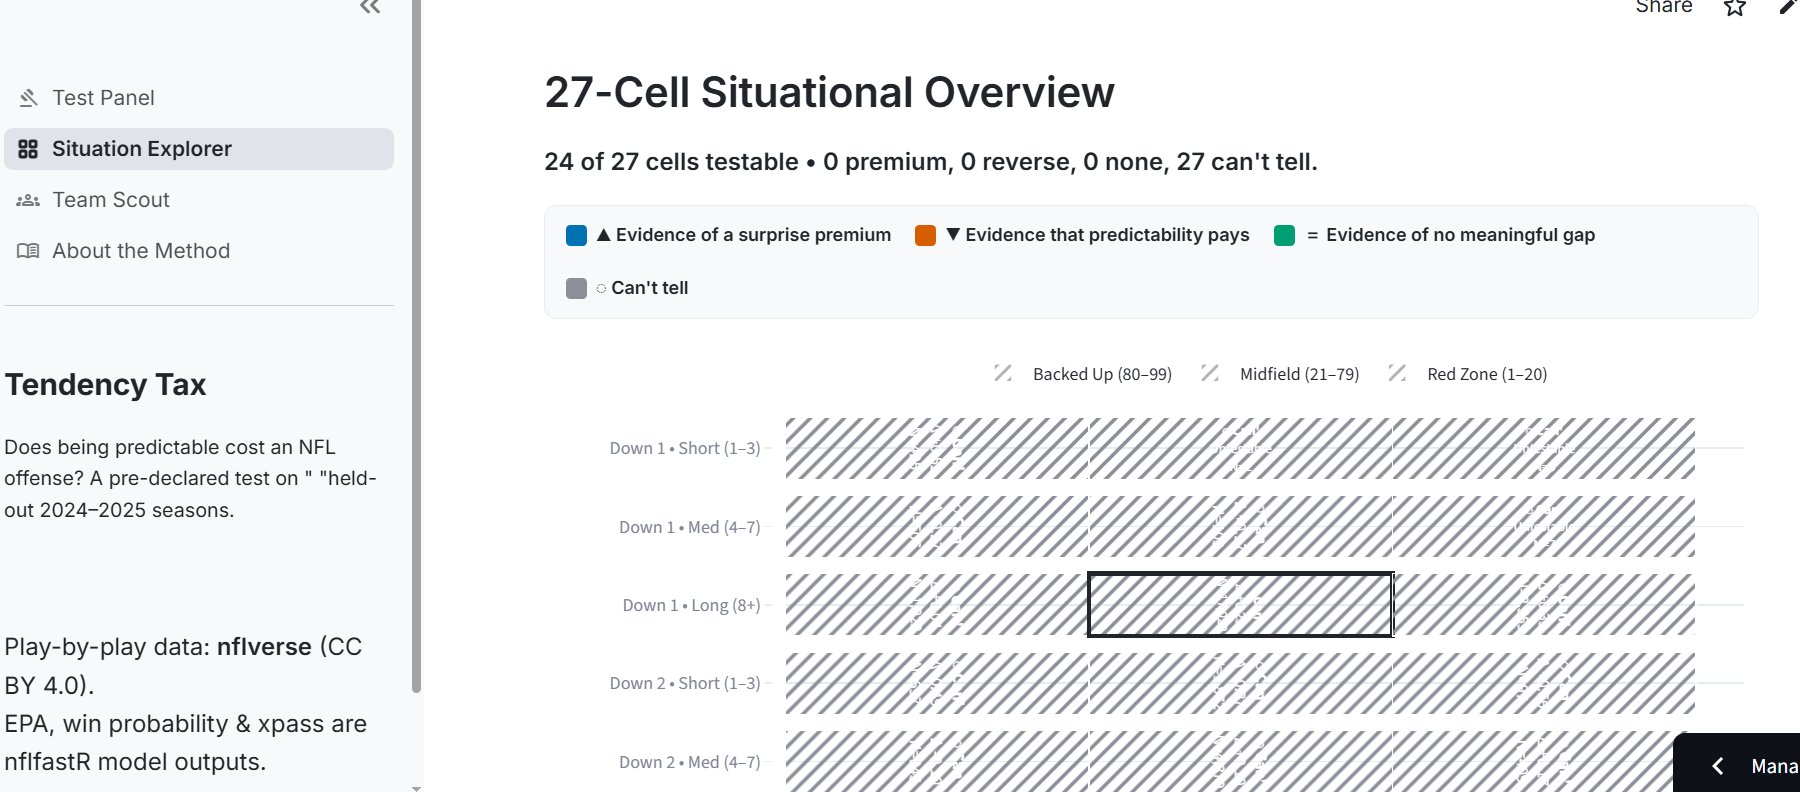
- Situation Explorer: 27 situations by down, distance and field zone, each showing its estimate, its interval and its adjusted p-value. A cell with too little data says "Can't tell" instead of producing a number. A slider shows the model's predicted pass probability for any score and clock.
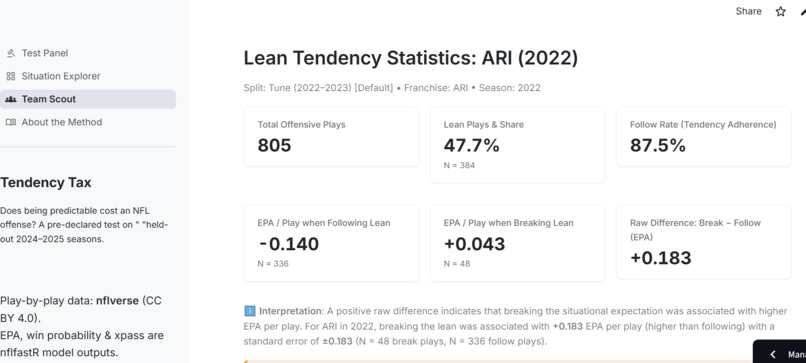
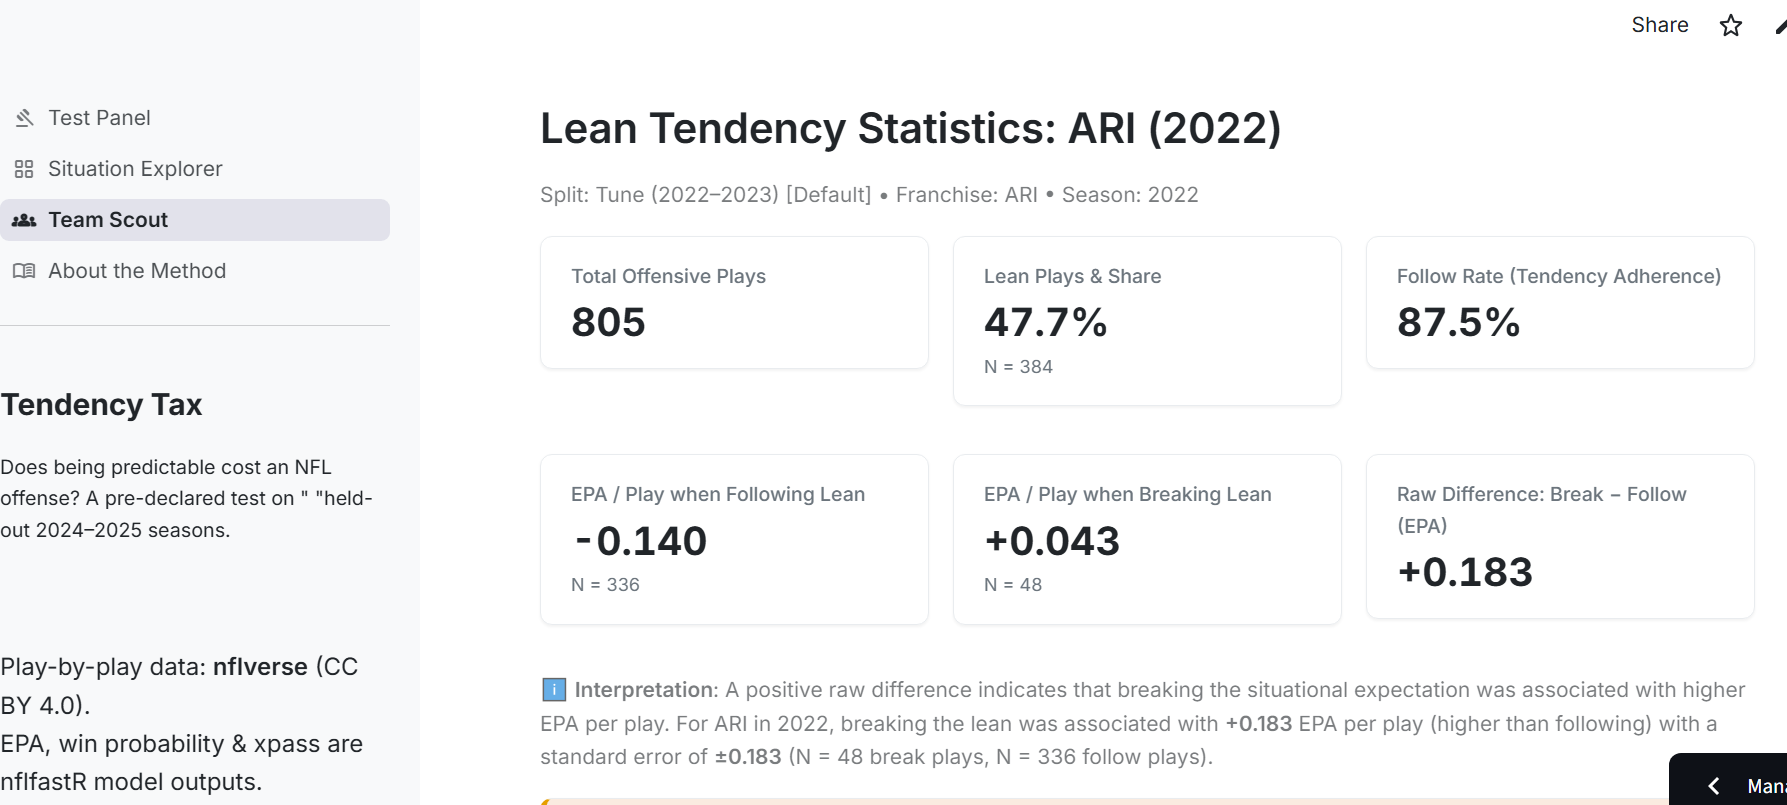
- Team Scout: how often a team follows the model's lean and how it fares when it breaks it. Small samples are pulled toward the league average, and any team with fewer than 60 breaking plays carries a warning. Teams are never ranked.
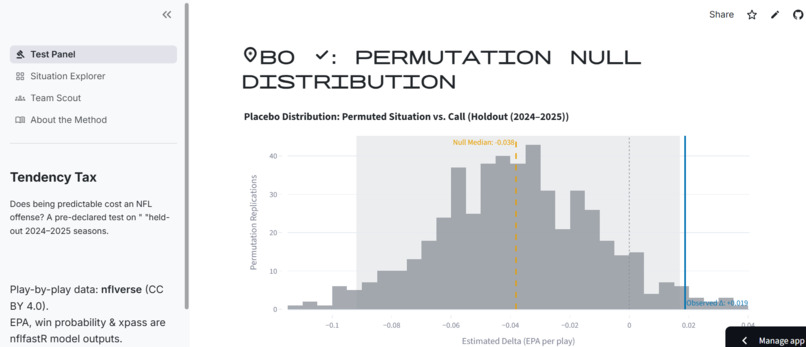
The result: on the sealed 2024-2025 seasons, plays that went against the situational expectation were associated with +0.019 EPA per play (95% interval −0.059 to +0.093). The interval includes zero, so our pre-declared verdict is inconclusive. That is not evidence of no effect. With two seasons, the smallest effect we could reliably detect (80% power) is about 0.11 EPA per play.
How we built it
We used nflverse play-by-play data for 2016-2025 and split it by season:
- 2016-2021: to build and check the method.
- 2022-2023: to tune the model.
- 2024-2025: sealed.
A gradient-boosted model predicts the chance of a pass using only pre-snap information: down, distance, field position, clock, score, timeouts and the point spread. It never sees EPA. Then we estimate
$$\Delta = -\tfrac{\beta_3}{2}$$
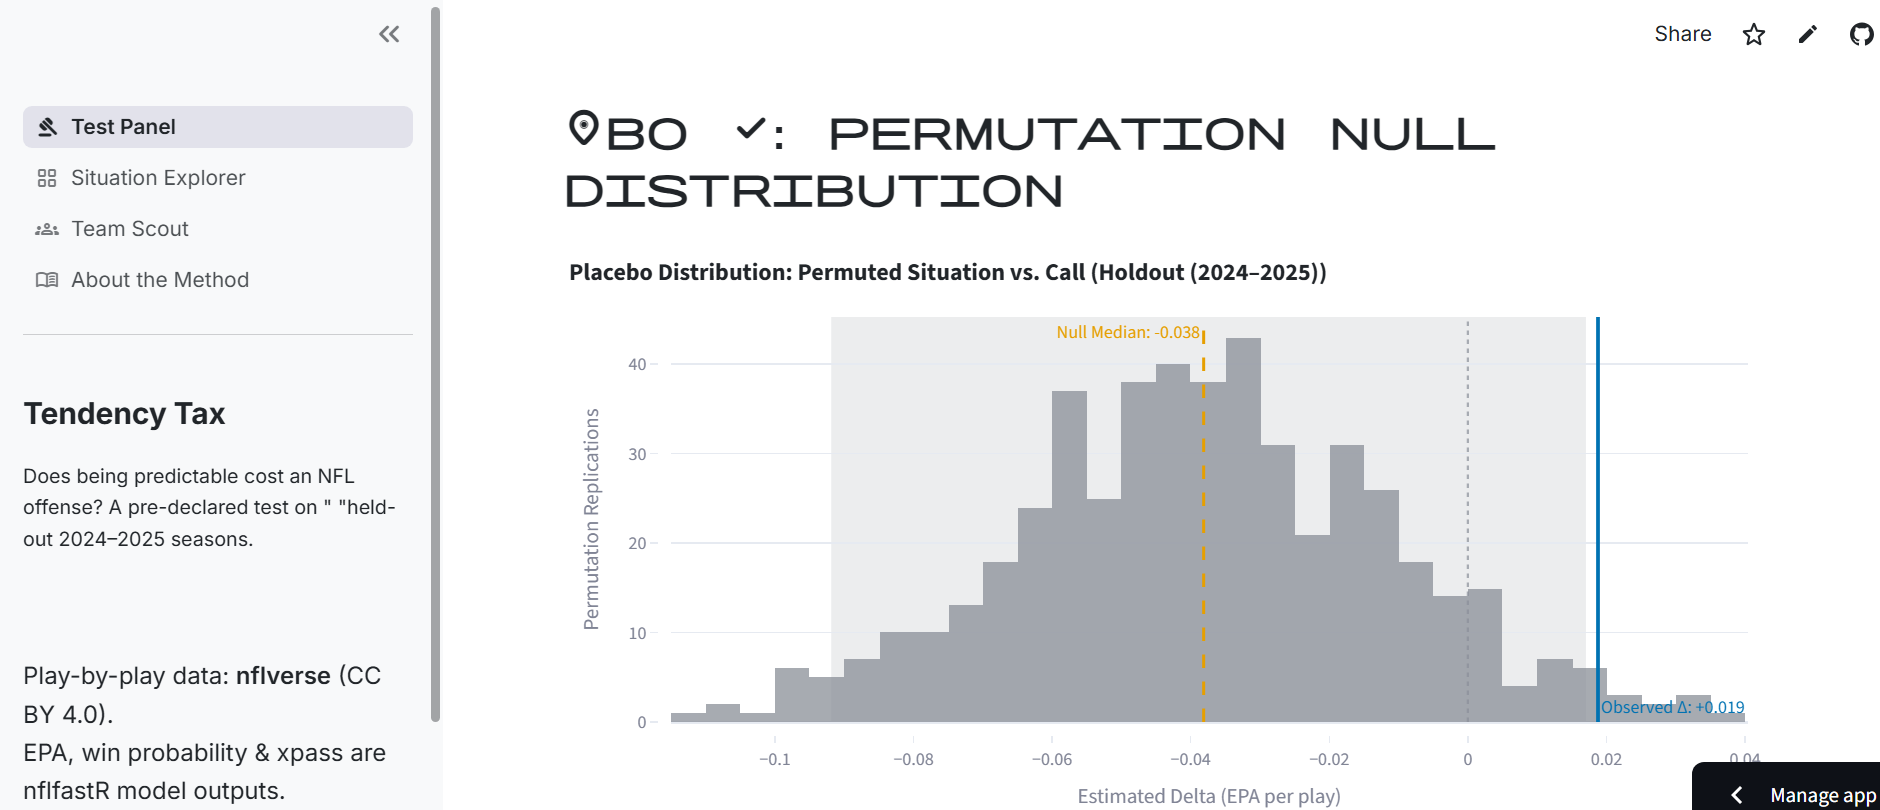
from a regression of EPA on the play call, the predicted pass probability and their interaction, with fixed effects for each down and distance bucket. Intervals come from a game-clustered bootstrap (1,000 resamples), checked against a placebo test in which the link between situation and call is scrambled (500 shuffles).
To keep ourselves honest:
- We committed the plan, the filters and the three-part pass-or-fail rule to GitHub before touching the sealed seasons (the commit).
- The code blocks access to the sealed seasons until the plan is committed, and logs every access.
- We tagged the verdict rule before the run, and ran the pre-declared test once.
- Later analyses (robustness checks, the 27-cell grid, the team view) read the same seasons, so they are labeled exploratory.
The app is built with Streamlit and Plotly, reads only precomputed result files, and is covered by an automated test suite. Code was written with AI coding assistants under a written rulebook in the repository (AGENTS.md).
Challenges we ran into
- Avoiding leakage. EPA and win probability are model outputs, so they are kept strictly as outcomes, never as inputs to our play-call model.
- Statistical power. Two seasons gave wide intervals. We measured the power with simulations and show it in the app, so "inconclusive" is not mistaken for "nothing there."
- Multiple testing. One situation looked promising on its own, with an interval above zero. After correcting for checking 24 situations at once, it did not hold up. The app is built to show that correction.
- A rough edge we disclose. One placebo check produced a distribution not centered exactly on zero. We report that in our write-up instead of hiding it.
- Selection. Coaches may break tendency when they spot something, so these are associations, not explanations of why a call was made.
What we learned
A clean null result is worth reporting. Writing the rule down first changes how you work: you stop chasing a story and start reporting what the data can support. And uncertainty belongs on the main screen, not in a footnote.
What we're proud of
- A genuinely pre-registered analysis for a hackathon, with a verdict we would have published either way.
- A tool that says "can't tell" instead of guessing.
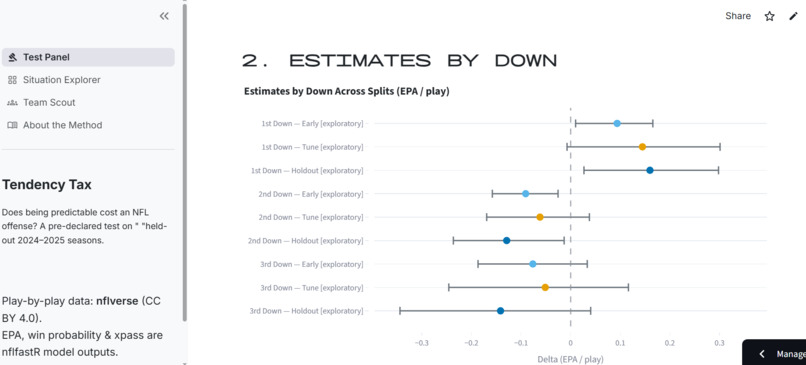
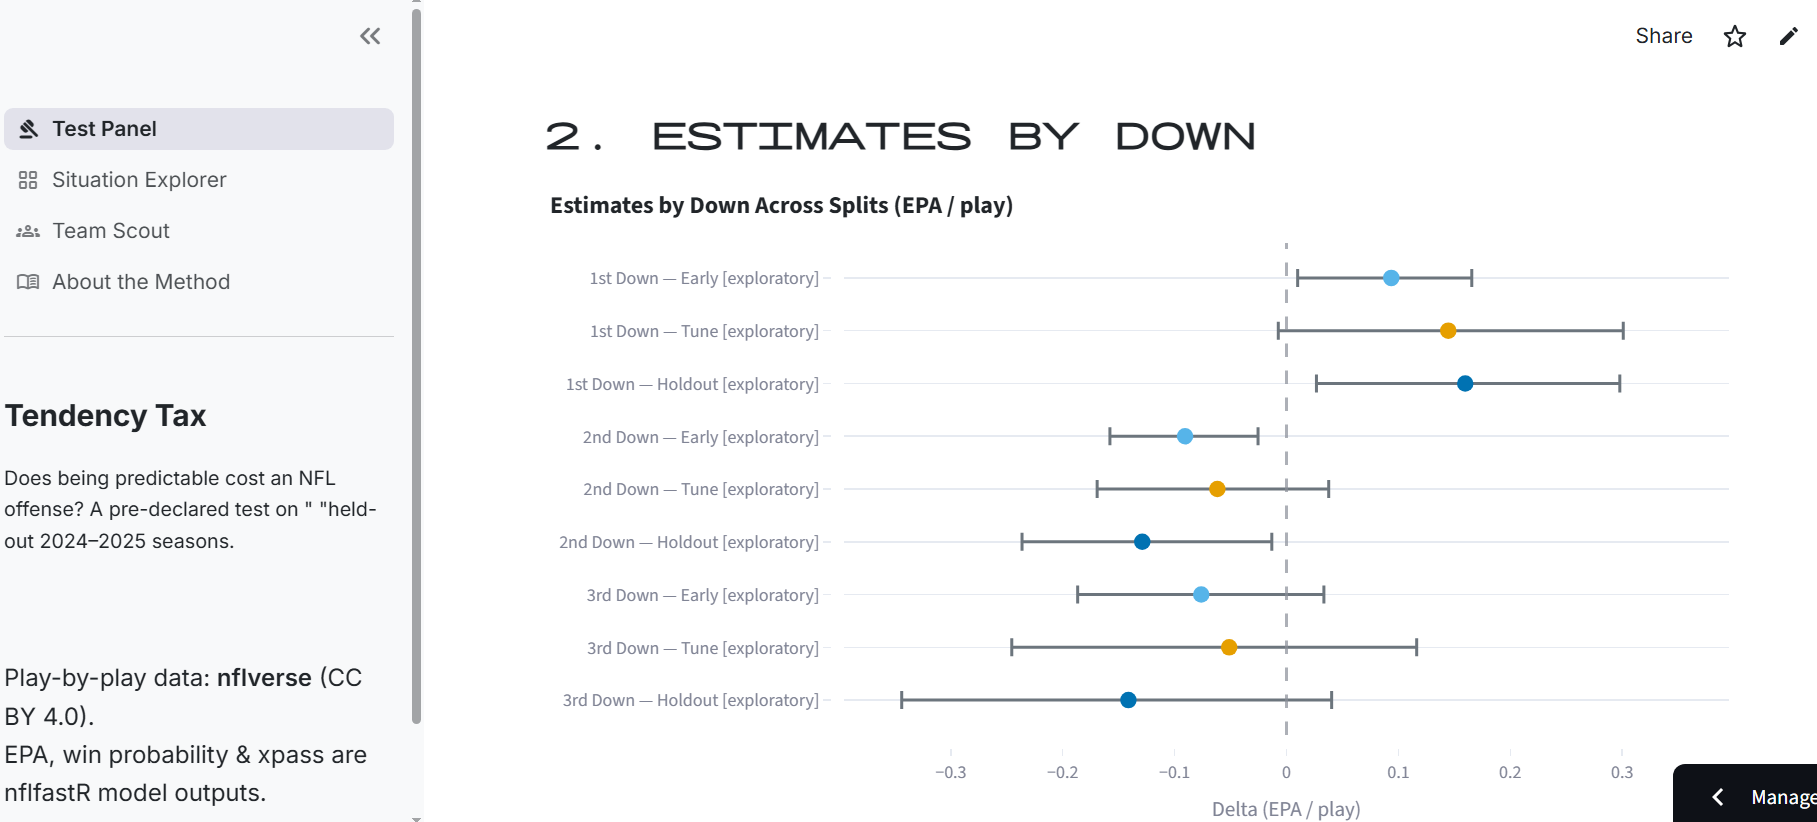
- One exploratory pattern worth testing next: across all three groups of seasons, first-down estimates were positive and second- and third-down estimates were negative. We label it a question for future seasons, not a finding.
What's next
Test the by-down pattern on new seasons as they arrive, add formation and personnel data to reduce selection concerns, and extend the same pre-declared design to other situational choices, such as fourth-down decisions.
Data and attribution
Play-by-play data: nflverse (CC BY 4.0). EPA, win probability and xpass are nflfastR model outputs. Raw data is not included in the repository, and the app runs from committed result files.


Log in or sign up for Devpost to join the conversation.