-
-
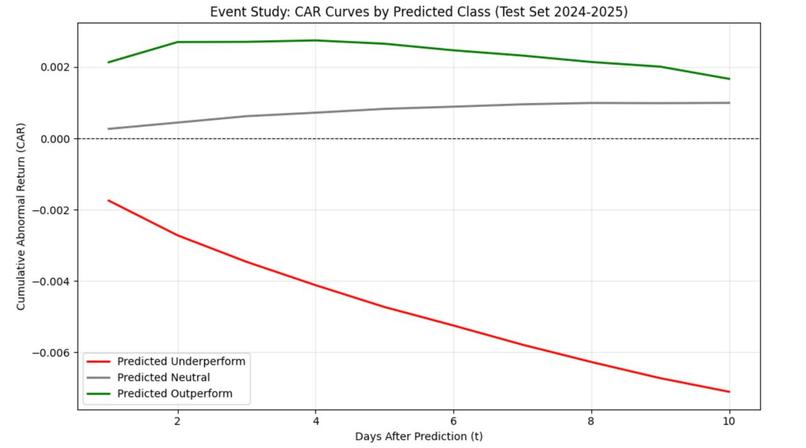
Cumulative Abnormal Returns Graph
-
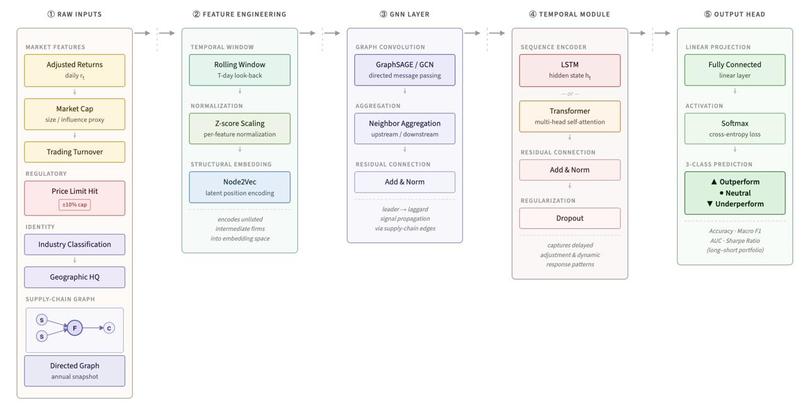
Data Flowchart + Model Structure
Inspiration
Ever noticed how stock markets don't absorb news instantly? If a raw material supplier gets hit with a shock, it takes time for that ripple to reach their downstream customers. This delay is called the "lead-lag" effect. We realized that traditional quant models trying to predict exact returns fail because the market is just too noisy. So, we thought: what if we treat the market as a massive, living graph and just try to predict the direction a stock will move based on what its business partners are doing?
How we built it
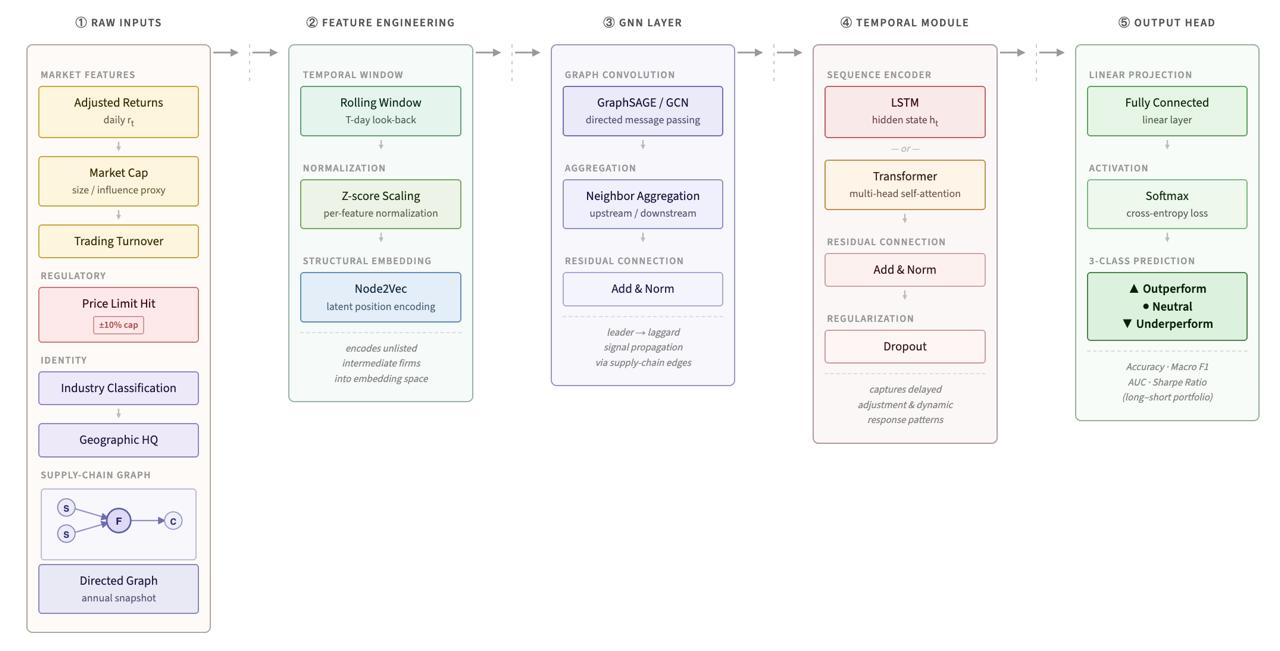
We built a pipeline called leadlag using a Hybrid-Temporal Graph Neural Network (HT-GNN).
- The Data: We pulled over 10 years of Chinese A-share daily market data (2016-2025) along with annual supply chain connections.
- The Graph: We mapped out both public and private/unlisted companies as a directed graph. We trained a
Node2Vecmodel to create 64-dimensional structural embeddings for every company so our model could "understand" the network shape. - The Temporal Model: We took those network embeddings and combined them with a 20-day rolling window of daily market features (like returns, log market cap, and daily price limits). We fed all of this into an LSTM model.
- The Math: Instead of regression, we framed this as a classification problem. Our model outputs a probability distribution over the classes ( y \in {\text{Outperform}, \text{Neutral}, \text{Underperform}} ), optimizing with a standard Cross-Entropy loss function:
$$\mathcal{L} = -\sum_{c=1}^{3} y_c \log(\hat{y}_c)$$
(Where ( y_c ) is the true label and ( \hat{y}_c ) is our predicted probability).
Challenges we ran into
- Insane Market Noise: Stock data is incredibly messy. Shifting to classification instead of regression saved us from getting totally lost in the noise.
- Look-Ahead Bias: We had to be super careful not to "cheat" by leaking future data into our training set. We strictly enforced rules like only using the supply chain graph from Dec 31 of Year ( Y-1 ) to make predictions for dates on or after May 1 of Year ( Y ).
- Invisible Companies: Incorporating unlisted private companies was tricky since they don't have daily stock prices, but we needed them to act as bridges connecting the public companies in our graph.
What we learned
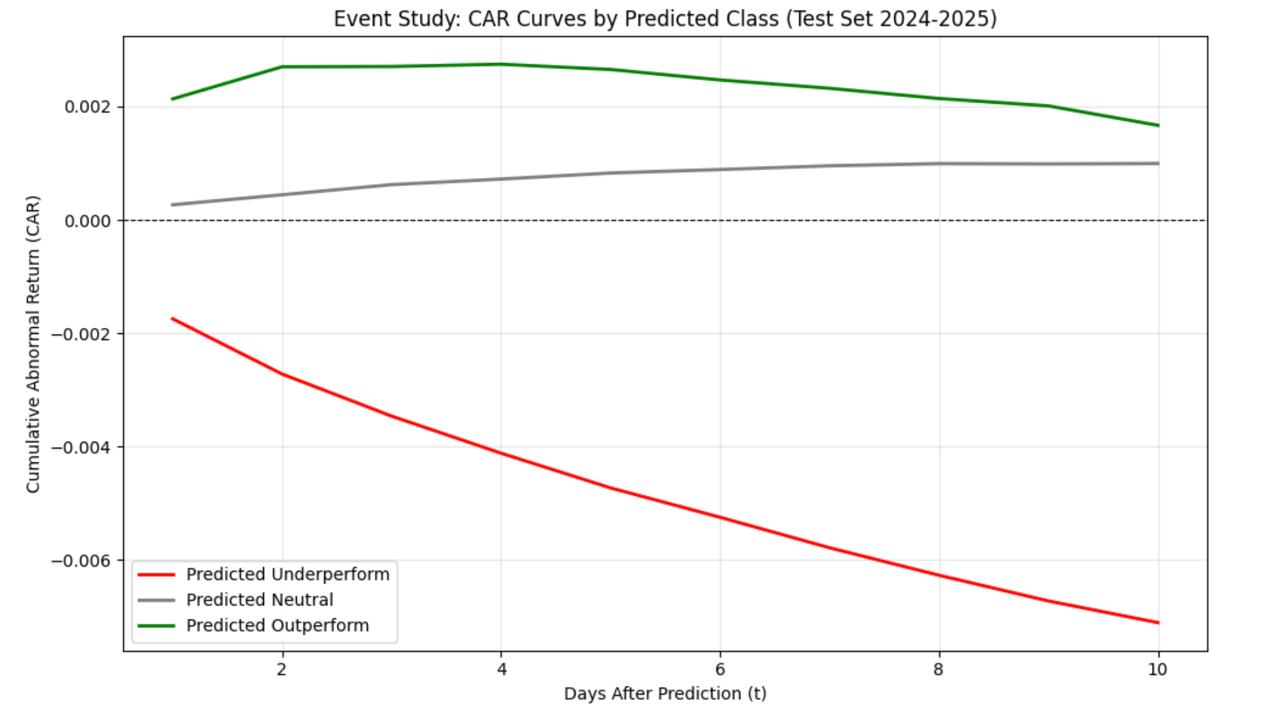
The biggest takeaway? The lead-lag effect is real and totally tradable! We ran a financial Event Study to calculate Cumulative Abnormal Returns (CAR) on unseen data from 2024-2025. Our plots showed that stocks we flagged to "Underperform" actually dropped by about ( 0.71\% ) (( CAR = -0.0071 )) over the next 10 days (( t=10 )). Meanwhile, the predicted "Outperformers" trended upward.
We ultimately learned that modeling the structure of who influences whom is just as important as the time-series price data itself.
Built With
- apache-parquet
- csmar
- matplotlib
- numpy
- pandas
- pyarrow
- pytorch
- pytorch-geometric
- scikit-learn
- seaborn

Log in or sign up for Devpost to join the conversation.