-
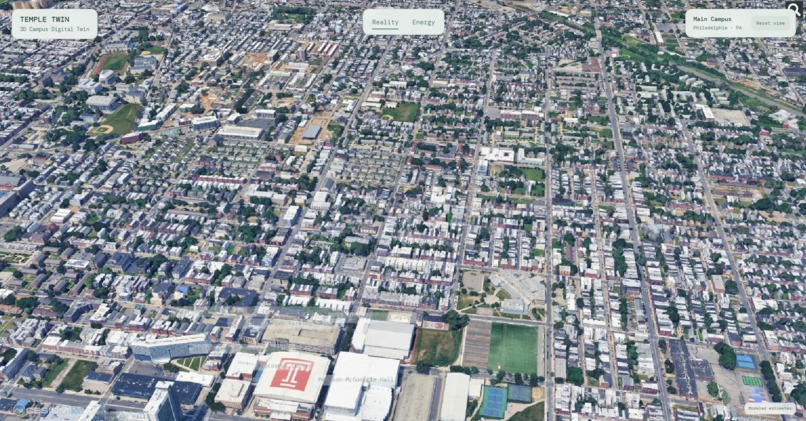
Reality View
-
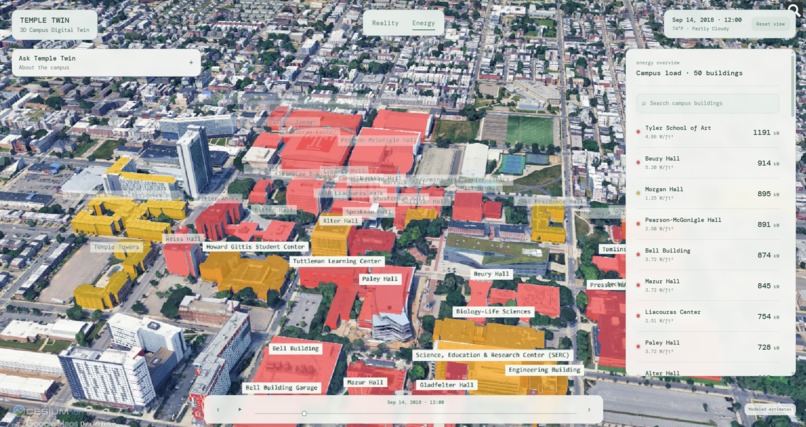
Energy View
-
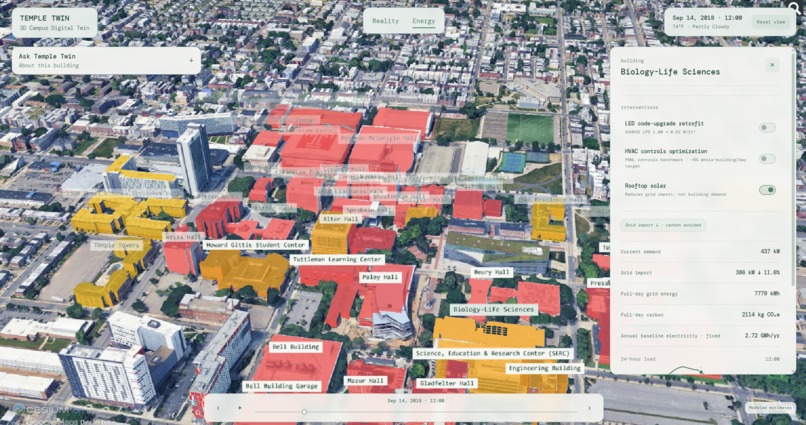
Building View
Inspiration
I've previously worked on research involving wind turbines and solar panels; this weekend, I wanted a way to visualize how much energy people use day-to-day. Campus buildings in particular are black boxes in terms of analyzing energy usage.
What it does
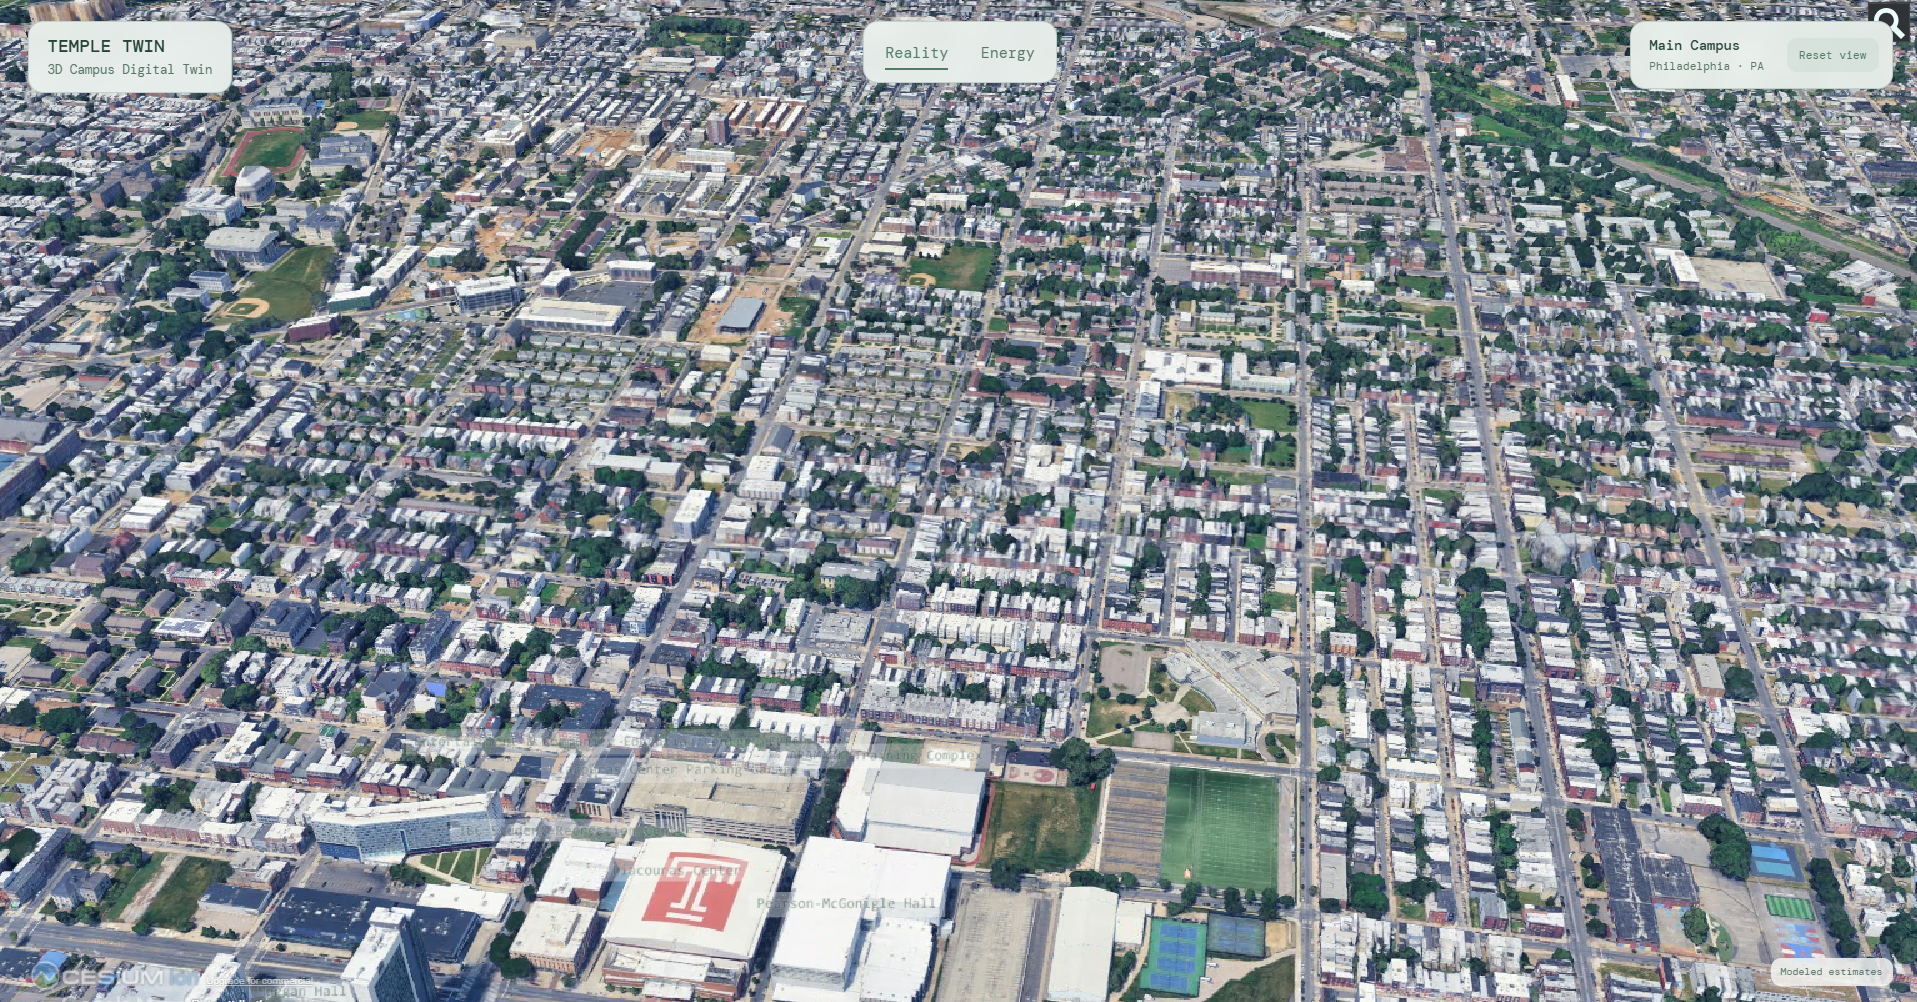
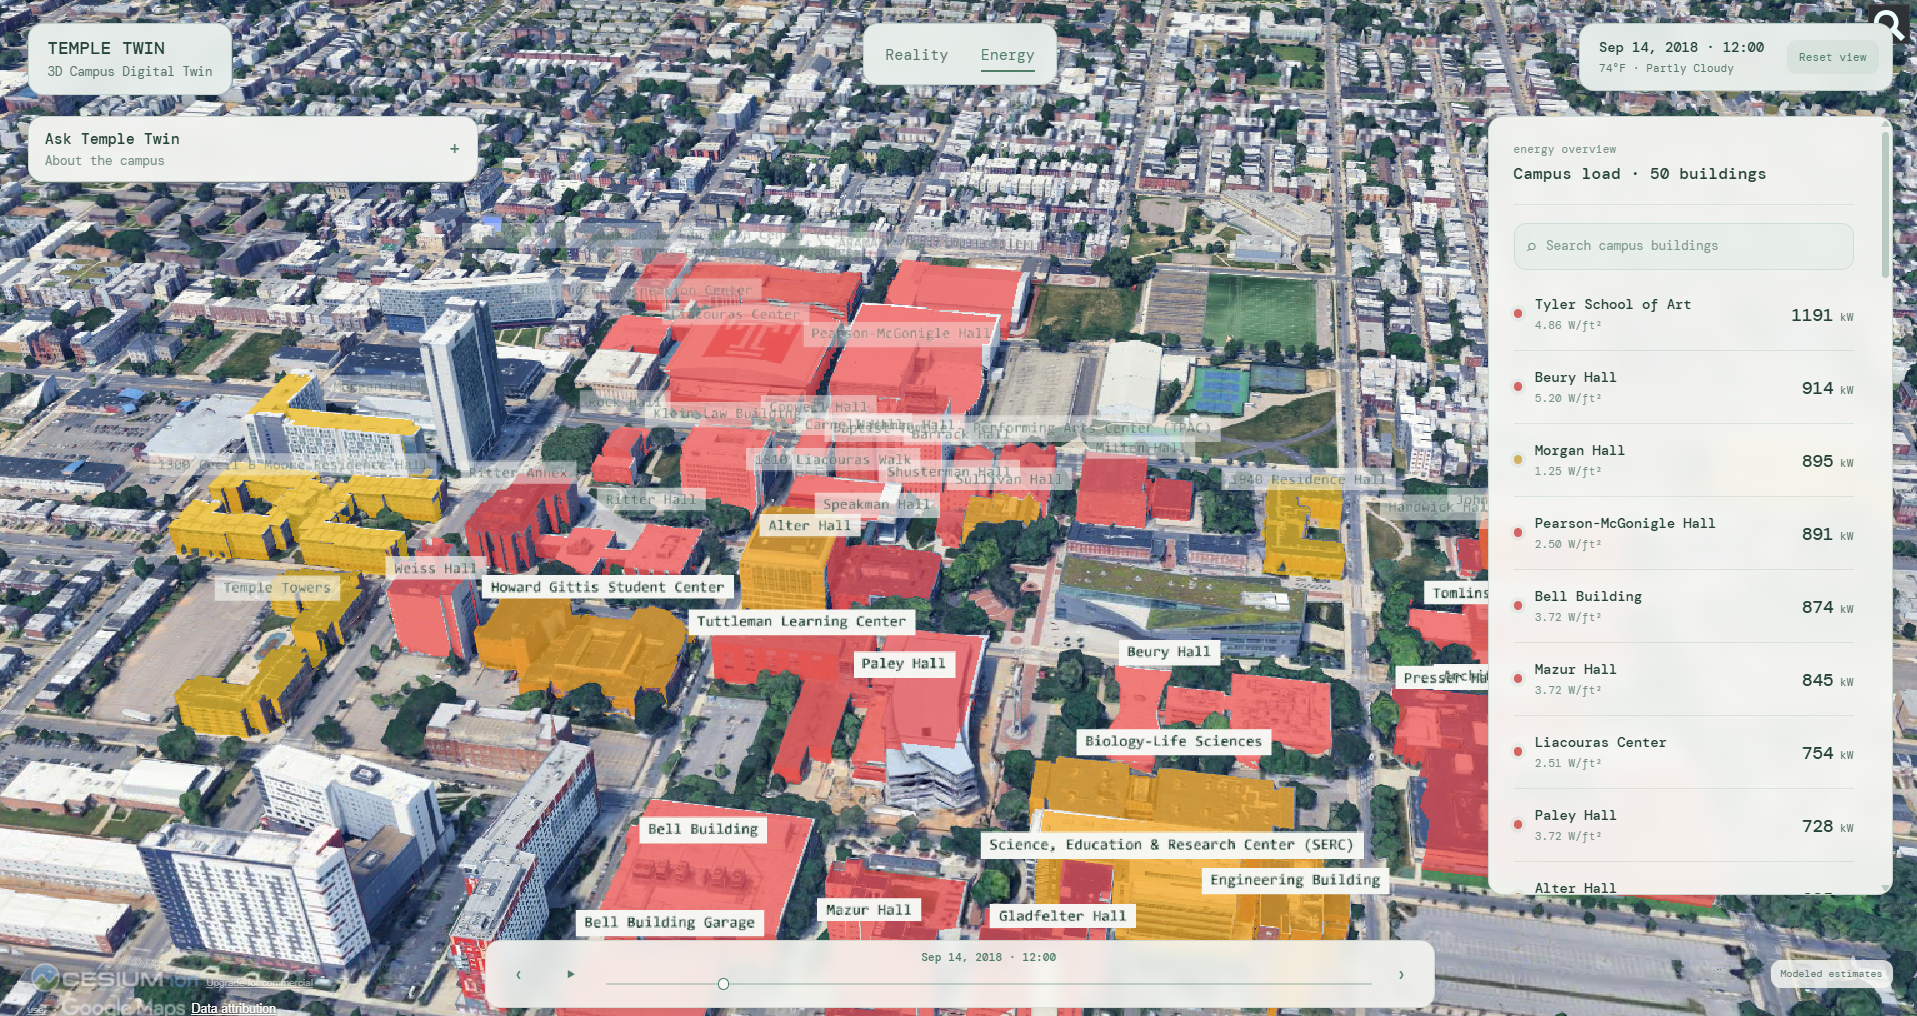
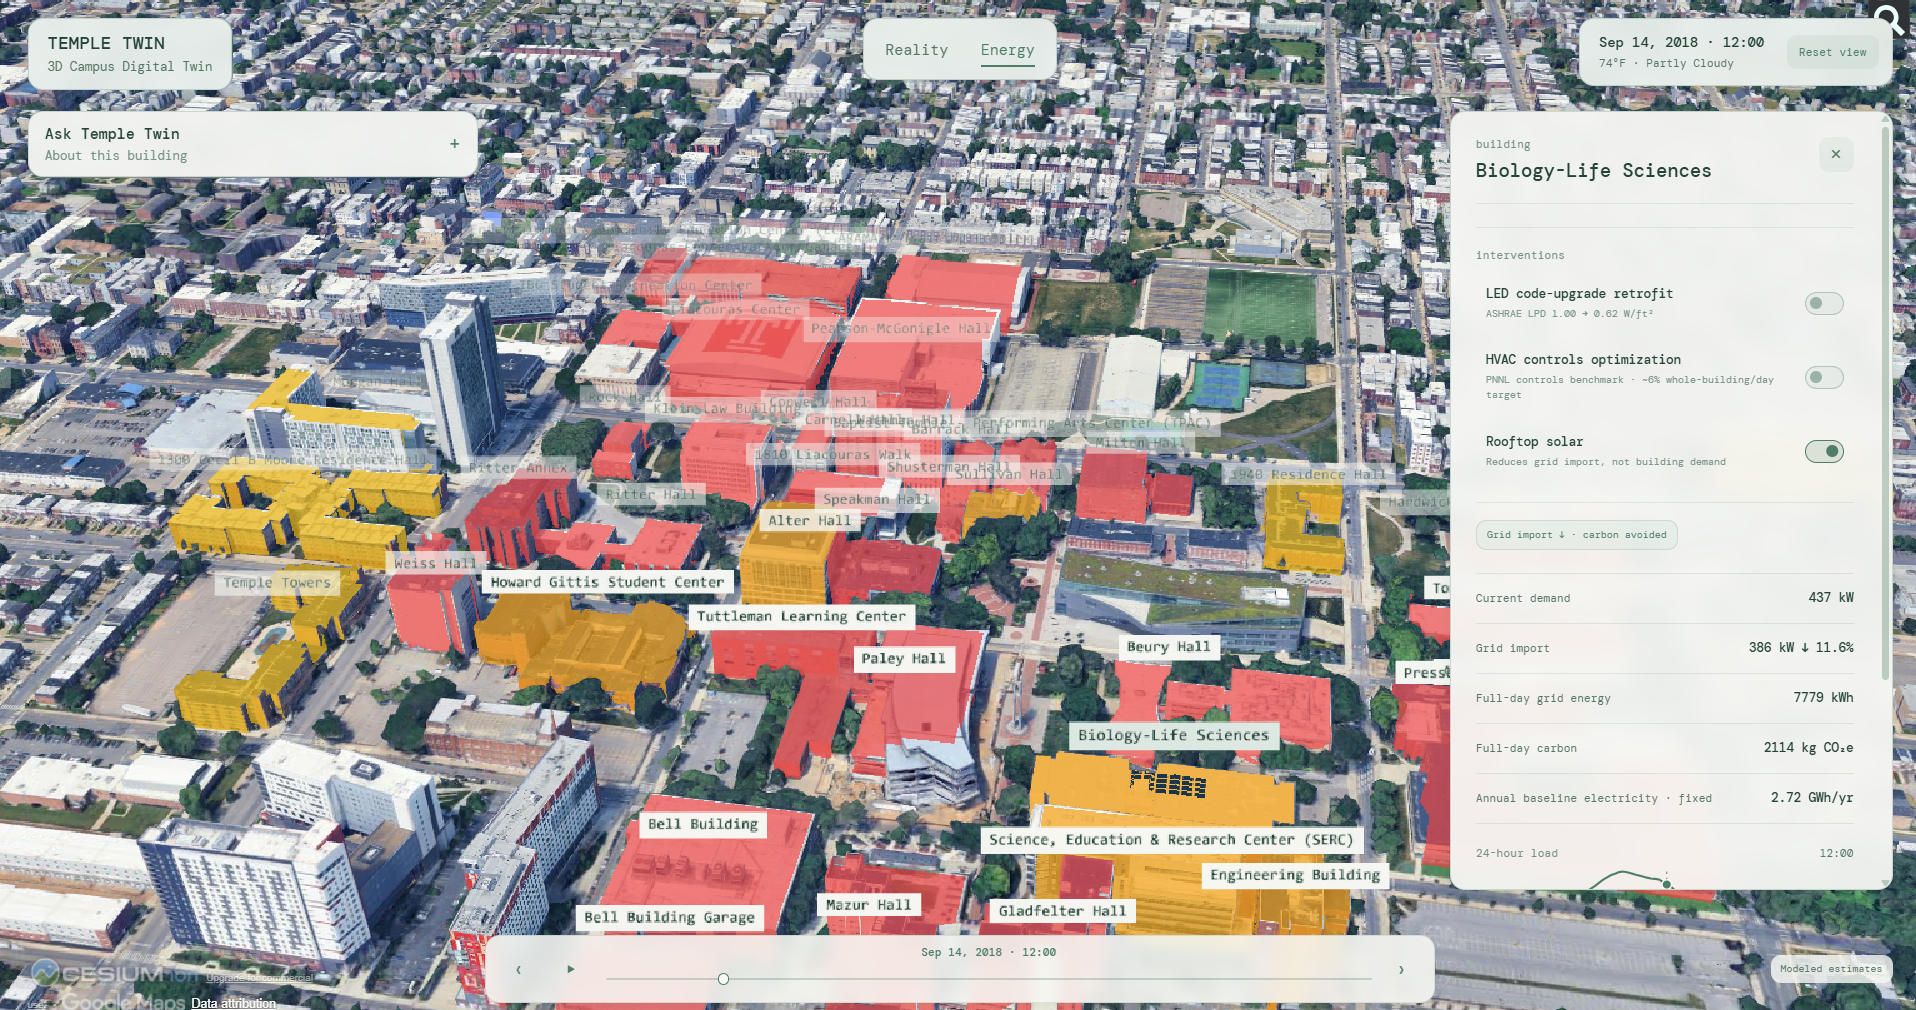
Temple Twin is a 3D Digital Twin, a virtual mirror of the main campus of Temple University. Switching between Reality and Energy modes lets you see a recognizable campus and observe the energy usage of each building. (Green shows it's using energy as expected, while orange/red means elevated energy usage) Clicking into any building pulls up a detailed breakdown of exactly where its energy is going (HVAC, lighting, etc.), and you can toggle LED, HVAC, and solar upgrades to see calculated savings. There's also Ask Temple Twin, a chat feature that lets you ask questions about any building's energy use.
How I built it
The frontend is React with CesiumJS, using Google's Photorealistic 3D Tiles to render Temple's campus in 3D. The backend is FastAPI connected to a Postgres database on Tiger Cloud (Timescale), storing all 50 buildings and their energy data. For the data, I pulled building footprints and floor areas from Temple's public GIS data. For energy usage, I used Philadelphia's public building energy benchmarking data where a building had a clean match, and Temple's campus-wide electricity usage per square foot where it didn't. I used NREL's ComStock 15-minute simulated loads, and scaled to match each building's annual total. Weather and solar data came from Open-Meteo's 2018 historical archive, and EPA eGRID's regional emissions factor converts energy into carbon numbers. Lastly, I built Ask Temple Twin using Snowflake Cortex.
Challenges I ran into
OwlHacks is my first hackathon, so I often ran into trouble with connecting services such as adding the SnowFlake Cortex or Tiger Data. At one point, I spent 30 minutes trying to figure out why my SnowFlake account wouldn't connect, but I'd just changed my password and forgot to update it. Because of the fast pace of a hackathon, I also had to learn new types of software on the fly, like 3D imaging with Cesium and building a backend with FastAPI.
Accomplishments that I'm proud of
I'm proud that all of the data showcased in Temple Twin is based of either Philadelphia's public building energy benchmarking data or campus-wide utility data, NREL ComStock 15-minute simulations, and historical weather data from 2018. I also got a working LLM feature (Ask Temple Twin, built on Snowflake Cortex) despite never creating one before!
What I learned
I always found the concept of a digital twin amazing so it was very cool to create one myself, even with many design assumptions. I also learned a lot about working with time-series energy data, REST APIs, PostgreSQL, 3D geospatial rendering, and generative AI services.
What's next for Temple Twin
The next step would be validating Temple Twin against energy data from Temple University. Access to utility bills or interval meter data would make it possible to compare the modeled profiles against actual performance and improve the accuracy. I’d also like to expand the experience with a street-level view to make the digital twin feel more immersive and easier to explore. Longer term, the same framework could be adapted to other universities, allowing campuses to visualize energy use and test sustainability interventions.
Built With
- cesiumjs
- fastapi
- postgresql
- python
- snowflake
- typescript
- vultr


Log in or sign up for Devpost to join the conversation.