-
-
CometSense
Inspiration
I wanted to make it easier and less stressful for UTD students to choose classes by giving them clear info on professors, grade trends, and TAs—all in one place.
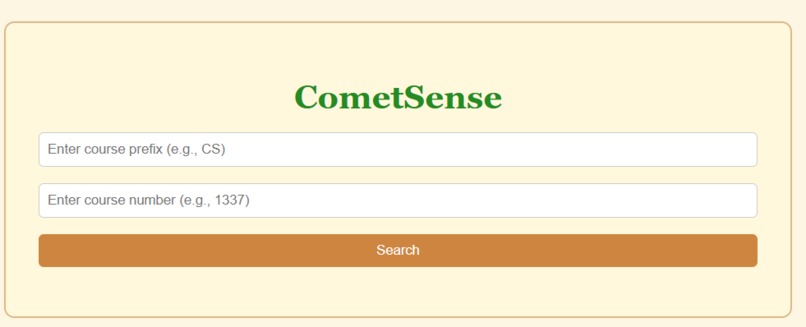
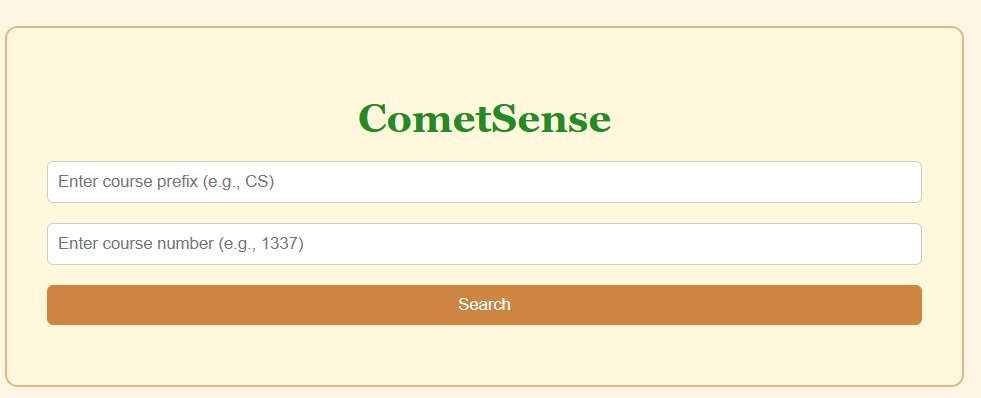
What it does
CometSense lets users search for a course and view detailed information regarding that course including the professor, grade distribution, and so much more.
How I built it
I used Python and Flask for the backend to fetch data from the Nebula Labs API, and React on the frontend to display the information. Recharts was used to show the grade distribution in graphs.
Challenges I ran into
Navigating with the Nebula Labs API was tricky and hard to manage at times. Connecting grade data to the right professors and making sure missing data didn’t break the visuals also took some work.
Accomplishments that I'm proud of
I'm especially proud of myself for stepping out of my comfort zone in this project by deciding to work solo. It has given me a lot of confidence moving forward as I know that I have the ability to create things all on my own, and I have learned so much in the process
What we learned
I learned to use React, Flask, the Nebula Labs API, and to chart data. I also learned a lot regarding python, as I have never used the language before.
What's next for CometSense
I'd love to add the ability to directly compare different classes and course sections and even build entire course schedules in CometSense. There are so many possibilities for CometSense that would make the lives of the students at UTD so much less stressful.

Log in or sign up for Devpost to join the conversation.